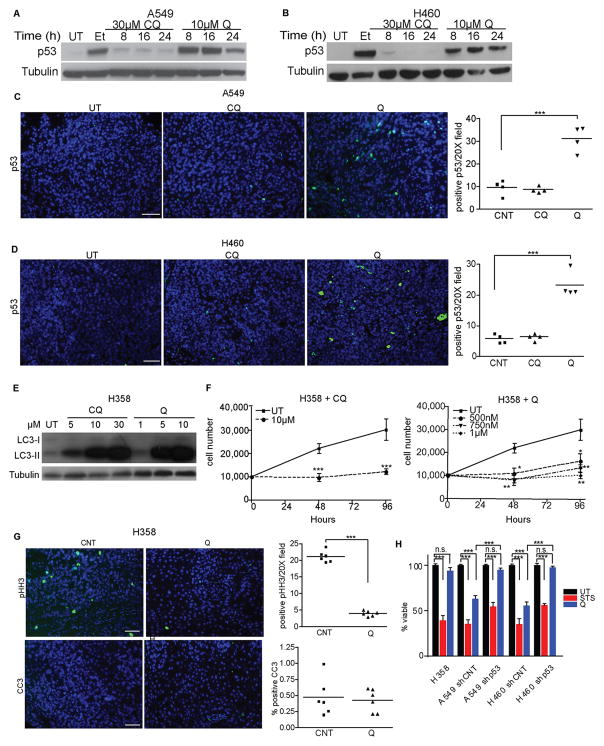
Figure 5. p53 is required for cell death in response to antimalarial treatment.
(A, B) p53 induction in A549 (A) or H460 (B) lung cancer cells upon CQ or Q treatment for the indicated times and doses. UT=untreated controls, Et= 50μM etoposide (positive control) (C, D) Immunostaining for p53 in A549 (C) and H460 (D) xenograft tumors treated for 3d with CQ and Q. Bar, 100μm. Right graphs: Quantification of p53 positive cells from tumors. Data are the mean ± SEM from 4 independent tumors for each condition. (E) LC3-II accumulation in p53 null H358 cells upon 18 h treatment with CQ or Q at indicated doses. (F) Growth curves of H358 cells treated with CQ or Q at indicated doses. Data represent the mean ± SEM from 3 independent experiments. (G) Immunostaining for pHH3 (proliferation) and CC3 (apoptosis) in H358 xenograft tumors treated with Q. Bar, 100μm. Right graphs: Quantification of pHH3 and CC3 positive cells. Data are the mean ± SEM from 6 independent tumors for each condition. (H) Reduced Q-mediated cell death in p53 null H358 cells and upon shRNA-mediated p53 knockdown in A549 and H460 cells. Q=10 μM quinacrine; STS=1μM staurosporine (positive control). Data represent the mean ± SEM from 3 independent experiments. Statistical significance was calculated using Student’s t-test for pair-wise comparisons in (F) or by ANOVA followed by Tukey’s HSD. *P≤0.05, **P≤0.01, ***P≤0.001.

