Abstract
Inhibition plays an important role in shaping responses to stimuli throughout the CNS, including in the inferior colliculus (IC), a major hub in both ascending and descending auditory pathways. Subdividing GABAergic cells has furthered the understanding of inhibition in many brain areas, most notably in the cerebral cortex. Here, we seek the same understanding of subcortical inhibitory cell types by combining staining for two types of extracellular markers—perineuronal nets (PNs) and perisomatic rings of terminals expressing vesicular glutamate transporter 2 (VGLUT2) —to subdivide IC GABAergic cells in adult guinea pigs. We found four distinct groups of GABAergic cells in the IC: (1) those with both a PN and a VGLUT2 ring; (2) those with only a PN; (3) those with only a VGLUT2 ring; and (4) those with neither marker. In addition, these four GABAergic subtypes differ in their soma size and distribution among IC subdivisions. Functionally, the presence or absence of VGLUT2 rings indicates differences in inputs, whereas the presence or absence of PNs indicates different potential for plasticity and temporal processing. We conclude that these markers distinguish four GABAergic subtypes that almost certainly serve different roles in the processing of auditory stimuli within the IC.
SIGNIFICANCE STATEMENT GABAergic inhibition plays a critical role throughout the brain. Identification of subclasses of GABAergic cells (up to 15 in the cerebral cortex) has furthered the understanding of GABAergic roles in circuit modulation. Inhibition is also prominent in the inferior colliculus, a subcortical hub in auditory pathways. Here, we use two extracellular markers to identify four distinct groups of GABAergic cells. Perineuronal nets and perisomatic rings of glutamatergic boutons are present in many subcortical areas and often are associated with inhibitory cells, but they have rarely been used to identify inhibitory subtypes. Our results further the understanding of inhibition in the inferior colliculus and suggest that these extracellular molecular markers may provide a key to distinguishing inhibitory subtypes in many subcortical areas.
Keywords: auditory, GABA, inhibition, perineuronal net, plasticity, VGLUT2
Introduction
Inhibition plays an essential role in neuronal processing. In many brain areas, a key to understanding inhibition has been the identification of subtypes of GABAergic cells (Bacci et al., 2005; Lawrence, 2008; Rudy et al., 2011; Kubota, 2014). Neocortical GABAergic neurons can be divided into as many as 15 categories based on immunostaining for molecules, such as calcium binding proteins and receptors (for review, see Rudy et al., 2011). Identification of inhibitory cell subtypes in cortical areas has allowed single subtypes to be tied directly to specific behaviors (for review, see Lovett-Barron and Losonczy, 2014). In the inferior colliculus (IC), a major processing center of the auditory system, approximately one-quarter of neurons is GABAergic (Merchán et al., 2005). These cells are important in both ascending projections from the IC and local inhibition within the IC (Peruzzi et al., 1997; Sivaramakrishnan et al., 2004; Kelly and Caspary, 2005; Pollak, 2013). The extent to which GABAergic IC cells comprise subtypes remains unclear. Up to four subtypes of IC GABAergic cells have been distinguished on the basis of intrinsic physiology (Ono et al., 2005; Geis and Borst, 2013), whereas no more than two subtypes have been distinguished with anatomical markers (Ito et al., 2009; Foster et al., 2014). Given the breadth of functions attributed to IC GABAergic cells, additional subtypes must exist.
Ito et al. (2009) subdivided IC GABAergic cells based on soma size in rats and found that the size of GABAergic somas is associated with their circuitry. Large GABAergic neurons (LG cells, somatic diameter >16.5 μm) receive dense axosomatic inputs from terminals containing vesicular glutamate transporter 2 (VGLUT2) and participate in the ascending projection to the medial geniculate body (MG). Small GABAergic neurons (SG cells, somatic diameter <10.7 μm) do not receive axosomatic VGLUT2-containing inputs and are less likely to participate in the MG projection. Although this study ties cell morphology to circuitry, it distinguishes only two subtypes of inhibitory cells and fails to give much information about inhibitory cells in the medium-size range (10.7–16.5 μm in diameter). Questions remain about whether the two main GABA subtypes in IC can be further divided in a functionally meaningful way.
In the cerebral cortex, aggregates of the extracellular matrix known as perineuronal nets (PNs) surround subsets of GABAergic neurons (Härtig et al., 1992). PNs affect plasticity and exert neuroprotective effects (Beurdeley et al., 2012; Suttkus et al., 2012; Cabungcal et al., 2013; de Vivo et al., 2013) and appear throughout the CNS, including the auditory system (for review, see Karetko and Skrangiel-Kramska, 2009; Sonntag et al., 2015). We previously used PNs to subdivide IC GABAergic cells into “netted” and “non-netted” categories and hypothesized that combining VGLUT2 and PN staining would yield meaningful subtypes of GABAergic cells that also differed in soma size.
To test this hypothesis, we used quadruple fluorescent staining to analyze a large population of neurons in the IC of guinea pigs, a species used widely in auditory research. Similar to reports in other species, the largest IC neurons are almost exclusively GABAergic, whereas the remaining sizes include a combination of both GABAergic and non-GABAergic cells. We combined GABAergic staining with additional markers for PNs and VGLUT2-containing terminals and identified four distinct subtypes of GABAergic cells that differ in their association with PNs and VGLUT2-positive (VGLUT2+) terminals, as well as in soma size and distribution within the IC.
Materials and Methods
All procedures were conducted in accordance with the Northeast Ohio Medical University Institutional Animal Care and Use Committee and National Institutes of Health guidelines. Results are described from four adult pigmented guinea pigs of either gender (three from Elm Hill Labs and one bred at Northeast Ohio Medical University). Animal weights ranged from 390 to 780 g, corresponding to an approximate age range of 35 to >100 d. Two of the animals had bilateral injections of fluorescent tracer into the MG as part of another study. Data from all four animals were qualitatively similar, so all results are presented as one dataset. Efforts were made to minimize the number of animals and their suffering.
Perfusion and tissue processing.
Each animal was deeply anesthetized with isoflurane until breathing stopped and corneal and withdrawal reflexes were absent. The animal was then perfused transcardially with Tyrode's solution, followed by 250 ml of 4% paraformaldehyde in 0.1 m phosphate buffer, pH 7.4, then 250 ml of the same fixative containing 10% sucrose. The brain was removed and stored in fixative containing 25% sucrose at 4°C overnight. The following day, the cortex and cerebellum were removed, and the brainstem was frozen and cut into 50 μm sections in the transverse plane on a sliding microtome. Sections were collected in six series. One series was stained for brain nitric oxide synthase (bNOS) to identify IC subdivisions, and one or more remaining series were stained with a four-color immunofluorescence procedure to analyze GABAergic and non-GABAergic cells.
For four-color staining, tissue sections were washed in PBS (0.9% NaCl in 0.01 m phosphate buffer) and then permeablized in 0.2% Triton X-100 in PBS for 30 min. Nonspecific staining was blocked by treating sections with a 10% normal goat serum (NGS) solution containing 0.1% Triton X-100 in PBS for 1 h. After blocking, PNs were stained with fluorescein-labeled Wisteria floribunda agglutinin in PBS for 1 h (WFA; 1:100; Vector Laboratories). Sections were rinsed with PBS, and then a mixture of primary antibodies was applied in a solution containing 1% NGS and 0.2% Triton X-100. Sections were allowed to incubate at 4°C for 48 h. The following antibodies were included in the mixture: anti-GAD67 to label GABAergic neurons (1:250; MAB5406; Millipore), anti-VGLUT2 to label VGLUT2-containing terminals (1:2500; AB2251; Millipore), and anti-NeuN as a neuron-specific stain (1:500; ABN78; Millipore). All antibodies have been used previously in guinea pigs (Foster et al., 2014). After primary incubation, sections were rinsed in PBS and treated with a biotinylated anti-guinea pig antibody to label the anti-VGLUT2 primary antibody (1:100; Vector Labs). Omission of the anti-VGLUT2 primary antibody revealed some staining resulting from the anti-guinea pig secondary antibody; because this secondary staining was restricted to cell bodies and we examined only VGLUT2-labeled terminals here, it was ignored (Sergeeva and Jansen, 2009). Next, sections were incubated in a mixture including an Alexa Fluor 594-tagged anti-mouse antibody, an Alexa Fluor 750-tagged anti-rabbit antibody, and an Alexa Fluor 647-tagged streptavidin (to reveal GAD67, NeuN, and the anti-guinea pig secondary, respectively; each at 1:100; Life Technologies). Sections were mounted on gelatin-coated slides from 0.2% gelatin solution, allowed to air dry, and then coverslipped with DPX mounting medium (Sigma).
For bNOS staining, sections were treated as described above, except the primary antibody was anti-bNOS (1:1000; N2280; Sigma). The tissue was incubated in the primary antibody in PBS with 1% NGS overnight at 4°C, followed by an Alexa Fluor 488-tagged anti-goat secondary antibody (1:50; Life Technologies) for 1 h. Sections were mounted on slides as described above.
Data analysis.
Two quadruple-stained transverse sections spaced 240 μm apart were selected from each case. Sections were specifically selected through the mid-rostrocaudal region of the IC in which all three major subdivisions are present. Care was taken to avoid especially rostral or caudal sections to avoid encroaching on other IC subdivisions (e.g., rostral pole, intercollicular tegmentum). Each section was outlined using a Neurolucida reconstruction system (MBF Bioscience) attached to a Zeiss AxioImager Z2 microscope (Carl Zeiss). The outline was overlaid onto an adjacent section stained for bNOS, and differential immunoreactivity was used to draw borders between the central nucleus (ICc) and the lateral (IClc) and dorsal (ICd) cortices of the IC (Coote and Rees, 2008). Borders between the layers of the IClc were added using the NeuN stain (Faye-Lund and Osen, 1985). The quadruple-stained section was then remounted in the microscope, and a “virtual tissue” photomontage of NeuN immunoreactivity was collected at 2-μm-depth intervals with a 63× oil-immersion objective (numerical aperture 1.4). The montage was displayed on a Cintiq 21UX interactive pen display (Wacom) attached to the Neurolucida system. The Cintiq stylus was used to manually trace the soma of every NeuN-reactive cell with a visible nucleolus within 4 μm of one cut surface of each section. We chose this depth as a criterion for analysis because preliminary analysis showed that each of the fluorescent markers penetrated the section at least this far; thus, lack of staining with a given marker is unlikely to be attributable to inadequate penetration of the staining reagents (Mellott et al., 2014). The section outline, with its associated NeuN-stained soma outlines, was then aligned to the original section, and each neuron was viewed with the appropriate fluorescence filters to identify expression of the stained markers (a PN, expression of GAD67, or a dense ring of axosomatic VGLUT2-expressing terminals). A soma was considered to have a dense ring of VGLUT2-expressing terminals if greater than ∼75% of the perimeter was covered by VGLUT2+ puncta. Each neuronal outline was color coded to indicate the marker(s) with which it was associated. A total of 28,607 neurons were outlined and coded. Neurons with a profile area that overlapped a subdivision outline were excluded from analysis, so as not to be counted twice.
Data were exported from Neuroexplorer (MBF Bioscience), including the coded cell type (e.g., GAD+), perimeter, area, x and y coordinates of the centroid, and minimum and maximum Feret diameters for each neuron outline. Average soma diameter for each neuron was determined by averaging the minimum and maximum Feret diameters. Throughout the study, soma profile areas were used to represent cell size because this measure is more complete than diameter. For example, diameter can be affected by cell shape to a greater extent than profile area. Furthermore, previous studies that use diameter as a measure of cell size are inconsistent and often unclear regarding the type of diameter used and how it is measured. In Discussion of this study, we use average Feret diameter as a representation of cell size to facilitate comparisons with previous studies. Data were imported into R (version 3.1.2 for Mac OS X; R Core Team, 2014) for all additional analyses. Packages used were “nlme” for model construction (Pinheiro et al., 2014) and “multcomp” for pairwise comparisons (Hothorn et al., 2008). Soma profile area data were log-normally distributed, so soma profile areas were log-transformed before conducting statistical testing. Means were determined by finding the mean of the log-transformed areas and computing the anti-log. For statistical testing, a linear mixed-effects model of the data was constructed with case included as a random factor, and the model was compared with a baseline model (a likelihood ratio test; Field et al., 2012). This accounts for soma size differences that may occur between cases attributable to variations in fixation. Correlation between the percentage of cells that were GAD+ and soma profile area was determined by computing Spearman's rank correlation coefficient.
To overlay all eight sections to create composite plots, the x and y coordinate for the centroid of each neuron outline was normalized. First, the minimum coordinate for each section was subtracted from all other coordinates within that section (so that the minimum x and y for each section were 0), and then this value was divided by the maximum coordinate for each section (to normalize values). These normalized x and y coordinates were plotted in R, and the plotted markers were overlaid onto a representative IC outline (chosen from one of the analyzed sections) in Adobe Illustrator (CS6; Adobe Systems). Bar graphs were created using Microsoft Excel, and box and whisker plots and scatter plots were created using R.
Photomicrographs were taken using a Zeiss AxioImager Z1 microscope with attached AxioVision software (Carl Zeiss). Adobe Photoshop (CS6; Adobe Systems) was used to add scale bars, crop images, and colorize images. Brightness and contrast levels were adjusted globally when necessary.
Results
GAD+ and GAD− neurons are present throughout the IC
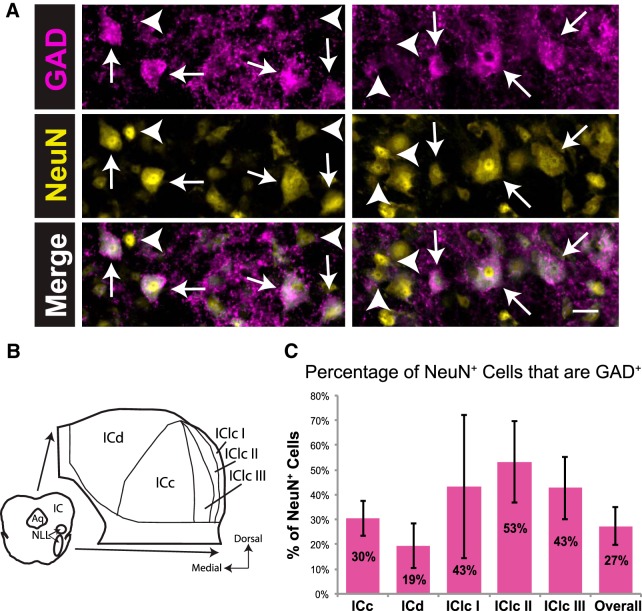
GAD+ neurons (arrows) and GAD− neurons (arrowheads) were readily distinguished in the IC (Fig. 1A). A schematic in Figure 2B shows a representation of the subdivisions of the guinea pig IC. Overall, 27% of NeuN+ neurons in the guinea pig IC were GAD+; this proportion varied in each IC subdivision (Fig. 1C). Across cases, the highest percentage of GAD+ neurons was found in layer II of the IClc (Fig. 1C; 53% of IClc layer II NeuN+ neurons were GAD+, on average). The lowest percentage of GAD+ neurons was found consistently in the ICd (19% of ICd NeuN+ neurons were GAD+, on average). In the ICc, an average of 30% of NeuN+ neurons were GAD+. Layer I of the IClc had the largest variation (43 ± 29% of NeuN+ neurons were GAD+). This is probably attributable to the low number of neurons in layer I (layer I contains only 10% of IClc neurons), making percentages more labile.
Figure 1.
GAD+ and GAD− neurons are present throughout the IC. A, Photographs of GAD+ neurons (arrows) and GAD− neurons (arrowheads) in the ICc (left column) and the IClc (right column). Scale bar, 20 μm. B, A schematic of a representative section showing the three main subdivisions of the IC, as well as the three layers of the IClc. Aq, Cerebral aqueduct; I, II, and III, layers of the IClc; NLL, nuclei of the lateral lemniscus. C, Bar graph showing the percentage of NeuN+ neurons that are GAD+ in each IC subdivision and overall. The percentage is highest in IClc layer II and lowest in the ICd. Error bars indicate 1 SD. Total sample size, 28,607 neurons. Sample sizes for subdivisions: ICc, 10,514; ICd, 14,023; IClc I, 406; IClc II, 1480; IClc III, 2184.
Figure 2.
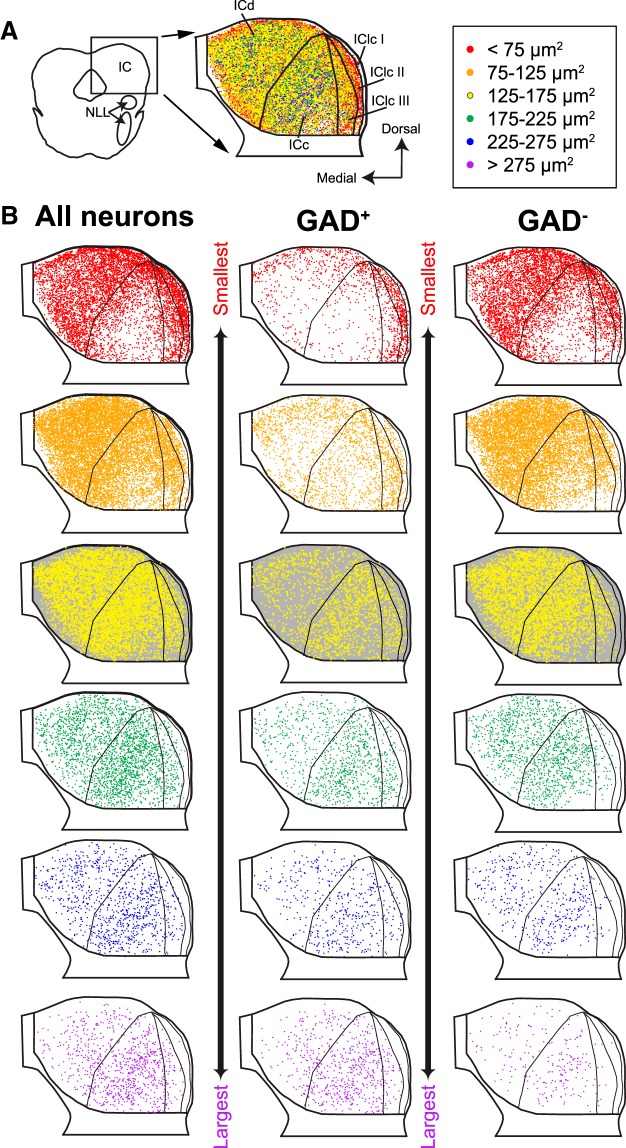
Neurons of different profile areas differ in their distribution within the IC. A, Composite plot with all NeuN+ neurons from eight transverse sections through the IC. Soma locations were normalized to overlay sections (see Materials and Methods). Dorsal is up, and medial is left. Subdivision outlines from one representative section are shown for reference. On the right is a legend showing the soma size categories represented by each marker color. Red markers indicate the smallest somatic profiles (<75 μm2), and purple markers indicate the largest somatic profiles (>275 μm2), with intermediate colors indicating groups with a range of 50 μm2. I, II, and III, Layers of the IClc; NLL, nuclei of the lateral lemniscus. B, Distribution of all NeuN+ neurons (left column), GAD+ neurons (center column), or GAD− neurons (right column), separated by soma size categories: the smallest neurons are represented at the top and the largest at the bottom. The background in row 3 was colored gray to enhance visibility of the yellow markers.
Neurons of different profile areas differ in their distribution within the IC
The distributions of neurons of different sizes in the guinea pig IC are similar to descriptions in other species. Figure 2A shows a composite plot of all NeuN+ cells in eight IC sections that have been overlaid. Each marker represents one neuron, with marker color indicating soma profile area. For initial analysis, the size categories (both the number of categories and the range of each category) were chosen arbitrarily; later, we will present an argument and criteria for distinguishing three size categories (small, medium, and large). In Figure 2B, markers are plotted separately based on soma size category. The left column shows all IC neurons. The smallest neurons are most numerous in the ICd and the IClc (top, red markers). Larger somas are more common in the ICc. When GAD+ (middle column), and GAD− (right column) neurons are separated, it becomes clear that, although the majority of IC neurons are GAD−, proportionally more of the largest neurons are GAD+.
GAD+ neurons are larger than GAD− neurons, on average
Figure 3A shows the wide range of soma sizes for both GAD+ and GAD− neurons. A linear mixed-effects model of the data was constructed, and a likelihood ratio test showed that soma profile area was significantly larger for GAD+ neurons (mean of 126 μm2) than for GAD− neurons (mean of 98 μm2; χ2(1) = 1376, p < 0.001). The percentage of neurons that were GAD+ was significantly correlated with soma profile area (ρ = 0.86, p < 0.001; Fig. 3B). Approximately 20% of neurons with profile areas smaller than 150 μm2 are GAD+, whereas almost 100% of neurons larger than 500 μm2 are GAD+.
Figure 3.
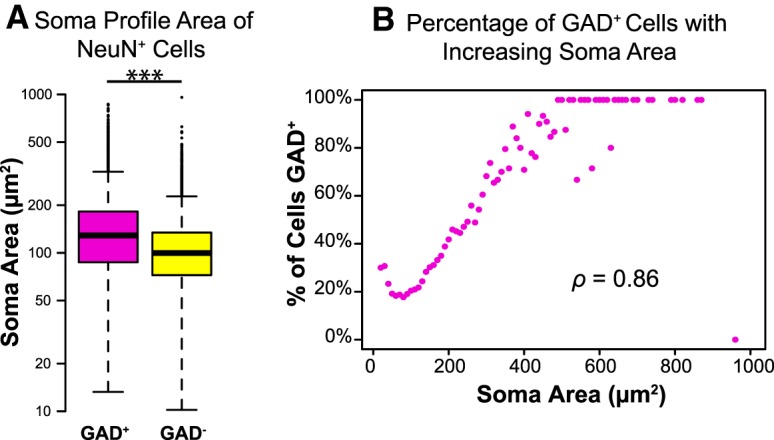
GAD+ neurons are larger, on average, than GAD− neurons. A, Box and whisker plot showing the range and median of soma profile area for GAD+ (magenta) and GAD− (yellow) neurons. The box indicates the interquartile range (and thus contains the central 50% of the values), a bold horizontal line in the box indicates the median, and the 95% confidence intervals are indicated by the whiskers. Circles beyond the whiskers indicate outliers. Both GAD+ and GAD− neurons represent a range of sizes, but GAD+ neurons are significantly larger, on average, than GAD− neurons. ***p < 0.001. Note that the y-axis is scaled logarithmically. Sample sizes: 7575 GAD+ neurons and 21,032 GAD− neurons. B, Plot showing the percentage of neurons that are GAD+ as a function of soma area. Areas were binned in 10 μm2 increments. The percentage of neurons that are GAD+ increases with increasing soma size, and the two parameters are significantly correlated.
GAD+ neurons surrounded by VGLUT2 rings are larger, on average, than those lacking VGLUT2 rings
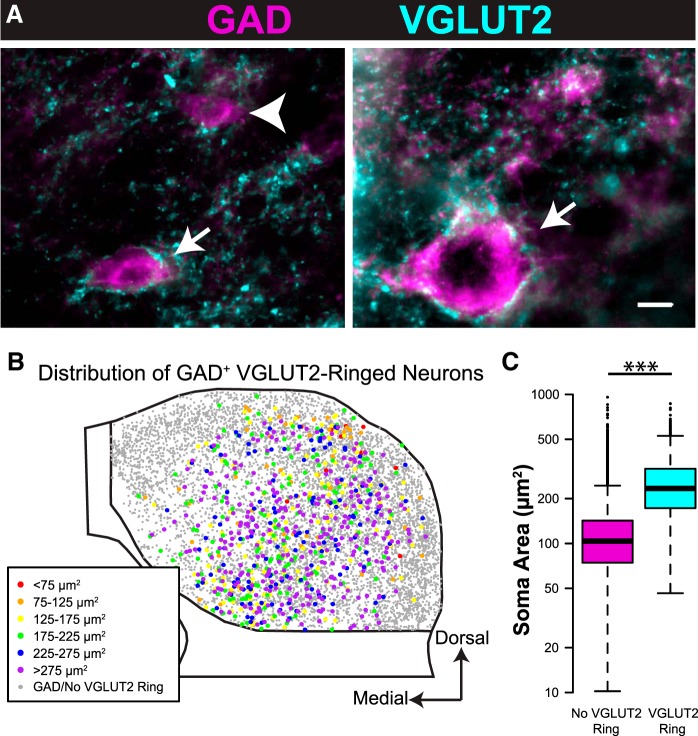
Ito et al. (2009) reported perisomatic rings of VGLUT2+ boutons surrounding a group of GABAergic IC cells in rats. Similar “VGLUT2 rings” are present around some IC cells in guinea pigs, in which a majority (97%) of the ringed cells are GAD+. Figure 4A shows examples of “ringed” (arrows) and “nonringed” (arrowheads) GAD+ neurons. Although the typical ringed neuron has a perimeter outlined with VGLUT2 boutons, some neurons have especially dense somatic coverage that can extend onto proximal dendrites (Fig. 4A, right). Nonringed neurons may have some perisomatic VGLUT2+ terminals but are not densely surrounded like ringed cells. Ringed neurons are present in all subdivisions of the IC considered here, but the proportion of GAD+ cells with rings varies. A higher percentage of GAD+ neurons are ringed in ICc than in the other subdivisions (on average, 16% of GAD+ neurons are ringed in ICc vs 7% in ICd, <1% in IClc layer I, 1% in IClc layer II, and 7% in IClc layer III). Figure 4B shows a composite plot of all ringed GAD+ neurons from eight transverse sections through the IC. Ringed neurons are more numerous in the central regions of the IC, and many of the ringed neurons are in the largest size category (purple markers). A linear mixed-effects model of the data was constructed, and a likelihood ratio test showed that soma profile area was significantly larger for GAD+ neurons with VGLUT2 rings (mean of 233 μm2) than for GAD+ neurons without VGLUT2 rings (mean of 102 μm2; χ2(1) = 2126, p < 0.001; Fig. 4C).
Figure 4.
GAD+ neurons surrounded by VGLUT2 rings are larger, on average, than those lacking VGLUT2 rings. A, Photographs of GAD+ neurons of a range of sizes surrounded by (arrows) or lacking (arrowheads) dense rings of VGLUT2+ terminals. Scale bar, 10 μm. B, A composite plot showing all GAD+ neurons from eight IC sections, similar to Figure 2, but with colored markers representing only GAD+ neurons surrounded by dense rings of VGLUT2+ terminals. Gray markers represent GAD+ neurons lacking VGLUT2 rings. Note that many GAD+ neurons with VGLUT2 rings are in the largest size category, with somatic profile areas >275 μm2 (purple markers). C, Box and whisker plot showing the range and median of soma areas for GAD+ neurons without (magenta) and with (cyan) dense perisomatic rings of VGLUT2+ terminals. GAD+ neurons with VGLUT2 rings are larger on average than GAD+ neurons lacking VGLUT2 rings. ***p < 0.001.
GAD+ neurons surrounded by PNs are larger, on average, than those lacking PNs
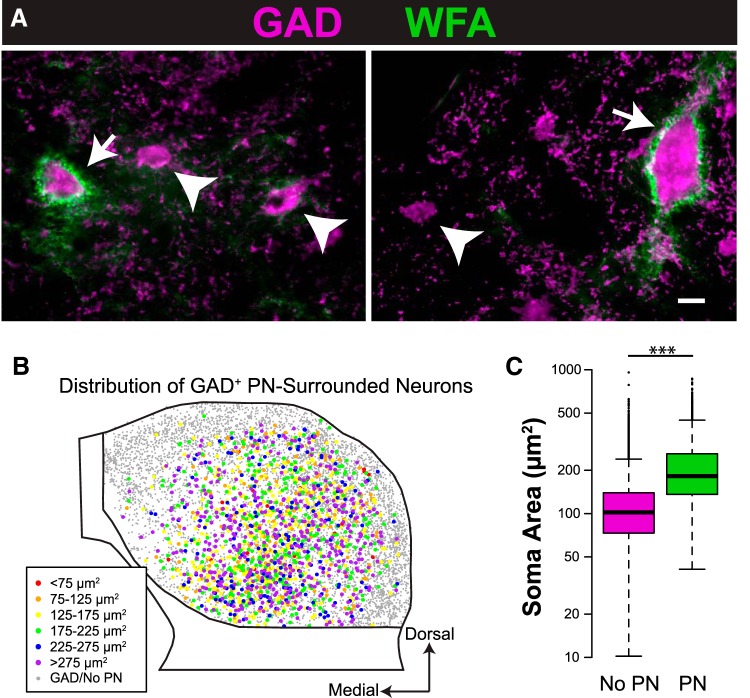
We reported previously that some neurons in the guinea pig IC are surrounded by aggregates of extracellular matrix known as PNs (Foster et al., 2014). These PN-surrounded neurons are most often GABAergic (GAD+) and are most numerous in the ICc. In the present study (which is based on a larger sample size than our previous study), an average of 21% of IC GAD+ neurons had PNs. This proportion was highest in ICc (on average, 37% of GAD+ neurons had PNs) and lowest in IClc (on average, 2% of GAD+ neurons had PNs in layer II and 13% in layer III; PNs were never observed around GAD+ neurons in layer I). Figure 5A shows examples of GAD+ neurons with PNs (arrows) or without PNs (arrowheads). All PN-surrounded GAD+ neurons from eight transverse sections through the IC are shown in Figure 5B. As described previously, GAD+ neurons with PNs are more numerous in central parts of the IC. Many PN-surrounded GAD+ neurons have soma sizes in the largest category (purple markers). A linear mixed-effects model of the data was constructed, and a likelihood ratio test showed that soma profile area was significantly larger for GAD+ neurons with PNs (mean of 189 μm2) than for GAD+ neurons without PNs (mean of 100 μm2; χ2(1) = 3024, p < 0.001; Fig. 5C).
Figure 5.
GAD+ neurons surrounded by PNs are larger, on average, than those lacking PNs. A, Photographs of GAD+ neurons of a range of sizes surrounded by (arrows) or lacking (arrowheads) PNs. Scale bar, 10 μm. B, A composite plot showing all GAD+ neurons from eight IC sections, similar to Figure 2, but with colored markers representing only GAD+ neurons surrounded by PNs. Smaller gray markers represent GAD+ neurons lacking PNs. Note that many GAD+ neurons with PNs are in the largest size category, with somatic profile areas >275 μm2 (purple markers). C, Box and whisker plot showing the range and median of soma areas for GAD+ neurons without (magenta) and with (green) PNs. GAD+ neurons with PNs are larger on average than GAD+ neurons lacking PNs. ***p < 0.001.
GAD+ neurons can be divided into four distinct subtypes
Because of the similarities between VGLUT2-ringed GAD+ neurons and those with a PN (both VGLUT2 rings and PNs are associated with larger GAD+ neurons more commonly located in central IC), we examined the relationship between these two markers. IC GAD+ neurons fall into one of four groups. “GAD–PN–VGLUT2 ring” neurons have both a PN and a perisomatic ring of VGLUT2+ terminals (Fig. 6A–C, arrows). “GAD–PN” neurons have a PN but lack a VGLUT2 ring (Fig. 6B,C, open arrowheads). “GAD–VGLUT2 ring” neurons have a VGLUT2 ring but lack a PN (Fig. 6D, double arrow). Last, “GAD–only” neurons lack both a PN and a VGLUT2 ring (Fig. 6A,C, arrowheads). As shown in Figure 6E, GAD-only neurons make up the majority of GAD+ neurons throughout the IC (an average of 76% of IC GAD+ neurons overall). They constitute a smaller proportion in the ICc (on average, 61% of ICc GAD+ neurons) but still represent a majority. GAD–PN neurons make up the second largest group throughout the IC and are present in the highest proportions in the ICc. GAD–VGLUT2 ring neurons make up the least numerous group and are present in the highest proportions in ICc.
Figure 6.
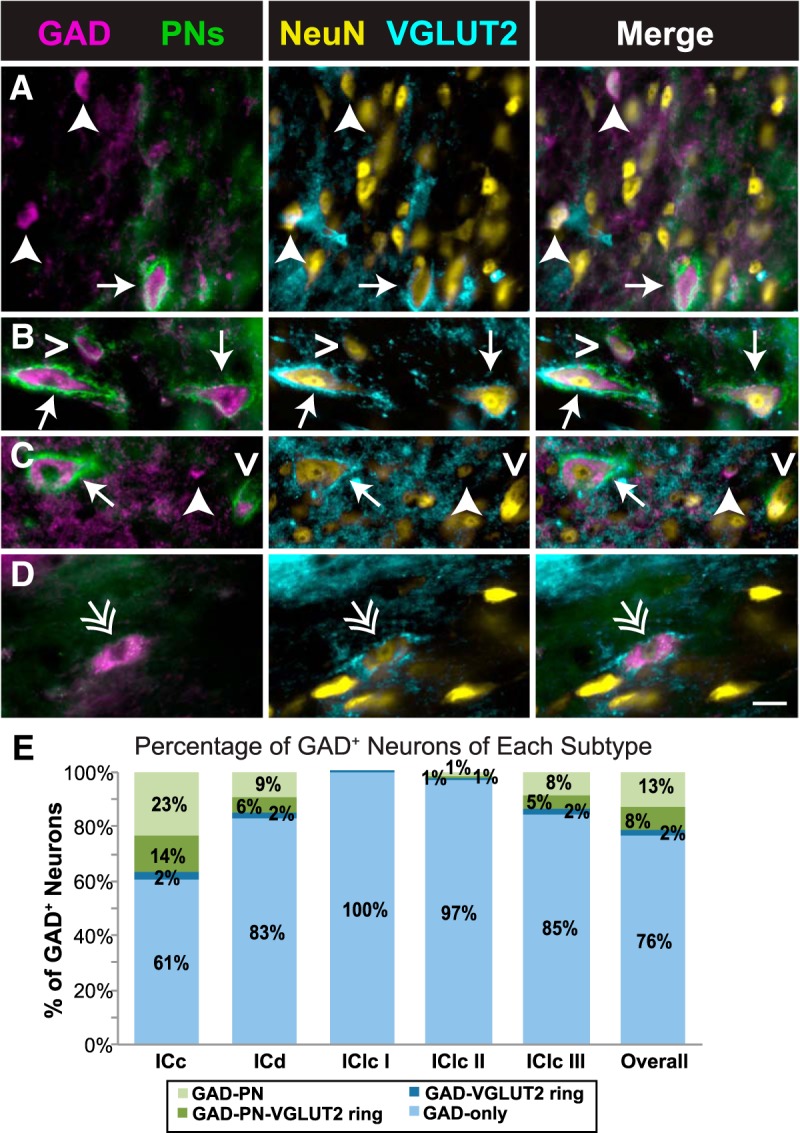
GAD+ neurons can be divided into four distinct subtypes. A–D, Photographs of four subtypes of GAD+ neurons in the IC. Each image row shows a single field that was imaged to reveal four markers. The first column shows an overlay of images stained for GAD and PNs; the second column shows an overlay of images stained for NeuN and VGLUT2; the third column shows an overlay of all four images. Some neurons have both a PN and a ring of VGLUT2+ terminals (GAD–PN–VGLUT2 ring; arrows in A–C), some neurons only have a PN (GAD–PN; open arrowheads in B and C), some neurons only have a ring of VGLUT2+ terminals (GAD–VGLUT2 ring; double arrow in D), and some neurons lack both a PN and a ring of VGLUT2+ terminals (GAD-only; arrowheads in A and C). The complete lack of PN staining in D is attributable to a local lack of PNs rather than a staining issue, because other photographs (not shown here) of PN-surrounded cells were collected from the same section, and a small amount of WFA labeling of the extracellular matrix is present in the background. Scale bar, 20 μm. E, Bar graph showing the proportion of each GAD subtype in each IC subdivision. GAD+ neurons lacking both a PN and a ring of VGLUT2+ terminals (light blue) are the majority in each subdivision but are a smaller majority in ICc. Overall and in each subdivision, most GAD+ neurons with a PN (light and dark green bars) lack a VGLUT2 ring (light green bars).
Four subtypes of GAD+ neurons differ in distribution
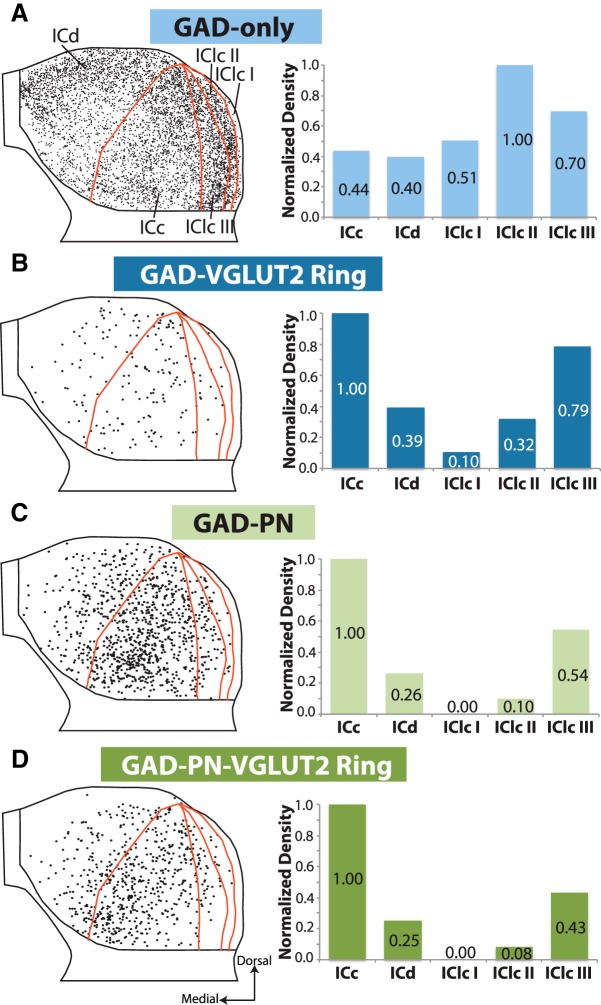
These four subtypes of GAD+ neurons, distinguished on the basis of extracellular markers, also differ in two additional characteristics: (1) distribution within the IC; and (2) soma size. GAD-only neurons are the majority throughout the IC (Fig. 7A). They are densest in the IClc, particularly in layer II. In both the ICd and the ICc, they are denser in the dorsal part of the subdivision. In contrast, the other three types of GAD+ neurons are present at the highest relative density in ICc (Fig. 7B–D). GAD–PN and GAD–PN–VGLUT2 ring neurons follow the pattern of staining described previously for PNs in guinea pig: these types are most numerous in central regions of IC, with an area of highest density in the ventral ICc (Fig. 7C,D). GAD–VGLUT2 ring neurons are also located more centrally in the IC but do not show the same clustering in ventral IC (Fig. 7B).
Figure 7.
Four subtypes of GAD+ neurons differ in distribution. A–D, Composite plots showing all GAD+ neurons from eight IC sections, with each GAD subtype shown in a separate panel. For each, the composite plot shows all neurons of that subtype, with subdivision outlines from one representative case for reference. GAD-only neurons (A) are denser in IClc, whereas GAD–PN and GAD–PN–VGLUT2 ring neurons (C, D) cluster in the ventromedial part of central IC. There is no definitive clustering of GAD–VGLUT2 ring neurons (B). To the right of each composite plot, a bar graph shows the normalized average density (cells per square millimeter divided by the maximum) for each GAD subtype across IC subdivisions.
Four subtypes of GAD+ neurons differ in soma size
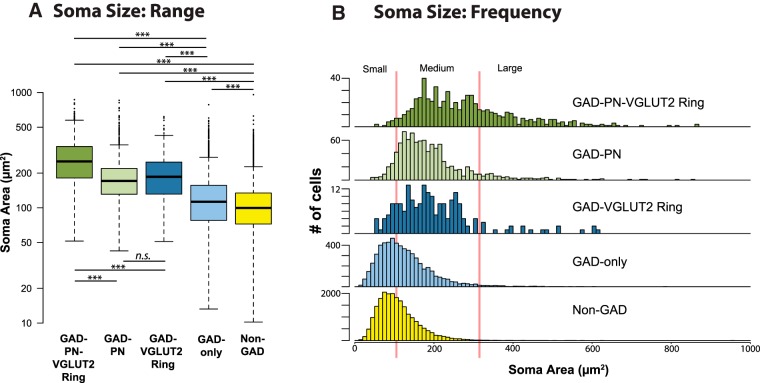
Figure 8A shows the soma profile areas for GAD− neurons and the four subtypes of GAD+ cells. GAD-only neurons have the smallest profile areas (109 μm2, on average), followed by GAD–PN neurons (176 μm2, on average), GAD–VGLUT2 ring neurons (180 μm2, on average), and GAD–PN–VGLUT2 ring neurons (254 μm2, on average). A linear mixed-effects model of the data was constructed, and a likelihood ratio test showed that there was a significant relationship between GAD type and soma profile area (χ2(4) = 3805, p < 0.001). Pairwise comparisons using a Tukey's HSD showed significant differences between all groups (p < 0.001), except for the GAD–PN and GAD–VGLUT2 ring groups (p = 0.998). The size distribution of GAD− cells is also shown for comparison (yellow box: 98 μm2, on average). Statistical analysis showed that each of the GAD+ subtypes is significantly larger, on average, than the GAD− neurons (p < 0.001; Fig. 8A).
Figure 8.
Four subtypes of GAD+ neurons differ in soma profile area. A, Box and whisker plot showing the soma profile area range and median for GAD− neurons (yellow), as well as each GAD subtype. GAD-only neurons (light blue) are significantly smaller than GAD+ neurons in the other groups, whereas GAD–PN–VGLUT2 ring neurons (dark green) are significantly larger than GAD+ neurons in other groups. GAD− neurons are significantly smaller than all four groups of GAD+ neurons. ***p < 0.001. B, Frequency distributions of soma profile area for each of the GAD+ subtypes, as well as GAD− neurons. Vertical red lines indicate the soma size classification scheme proposed in this study for IC GAD+ neurons (small, <105 μm2; medium, 105–318 μm2; large, >318 μm2).
Figure 8B shows frequency distributions for soma profile area for each of the GABA groups, as well as all GAD− neurons. Red lines represent proposed borders to split IC GAD+ neurons into small, medium, and large categories. The lower border (i.e., the small-medium border) was drawn by taking the log-transformed data and subtracting 2 SDs from the mean log-profile area of the GAD–PN–VGLUT2 ring group. This sets the lower border at 105 μm2, with ∼98% of GAD–PN–VGLUT2 ring neurons falling above this criterion. Similarly, a medium-large border was set by taking the log-transformed data and adding 2 SDs to the mean log-profile area of the GAD-only group. This sets the upper border at 318 μm2, with ∼98% of GAD-only neurons falling below this criterion. Based on these borders, non-GAD and GAD-only neurons fall mainly into the small- and medium-size categories. GAD–VGLUT2 ring and GAD–PN neurons fall mainly into the medium category. Finally, GAD–PN–VGLUT2 ring neurons fall mainly into the medium and large categories.
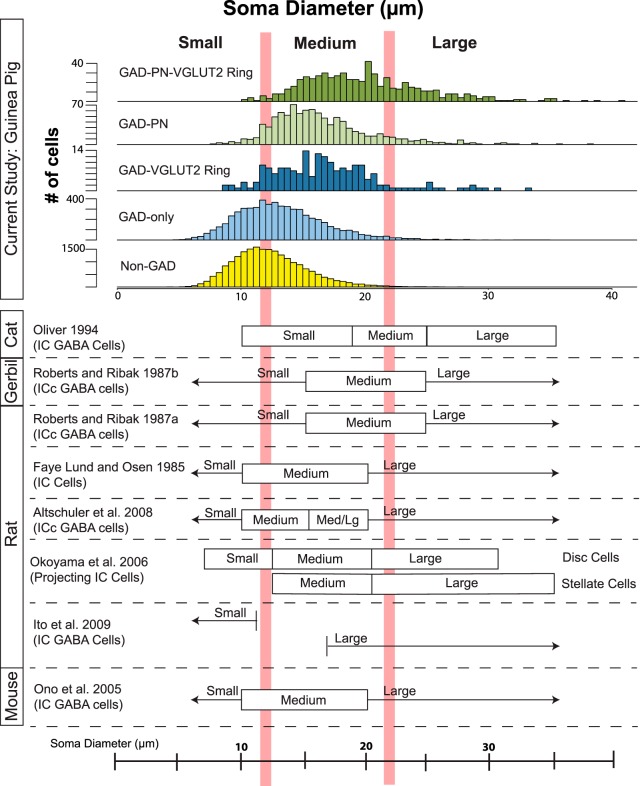
Classifications of IC cells based on soma size in other species often use average diameter as the sole soma measurement. To facilitate comparison, Figure 9 shows histograms representing soma diameter for each of our neuron types, as well as classification schemes from eight previous studies in four species. With size criteria determined using the same strategy described above, borders fall at 12 and 22 μm to distinguish small, medium, and large categories (Fig. 9, vertical red lines). Across studies, some disparity between classification schemes is immediately apparent, although possibly with good reason. These eight studies each examined different cell populations (e.g., GABAergic cells only in the ICc vs GABAergic cells throughout the IC), and many used different methods for measuring diameter.
Figure 9.
Average soma diameter of neuron types in this study compared with IC cell size classifications from previous studies. The top shows histograms of average soma diameters for each GAD+ subtype and for GAD− neurons from the present study. Vertical red lines indicate the soma size classification scheme proposed in this study (small, <12 μm; medium, 12–22 μm; and large, >22 μm). In the bottom, each row indicates a previous study that used soma diameter to classify IC cells. Filled boxes indicate finite ranges, and arrows indicate unbounded classification windows (i.e., < or >).
Discussion
The current study uses extracellular markers to subdivide GABAergic neurons in the guinea pig IC. The percentage of GABAergic neurons in guinea pig IC (27%) is similar to that in cats (20%; Oliver et al., 1994) and rats (25%; Merchán et al., 2005). Four subtypes of GABAergic neurons can be distinguished based on the presence or absence of a PN and a dense perisomatic ring of VGLUT2-expressing terminals. Differences in soma size and distribution across IC subdivisions further differentiate the subtypes. These differences suggest that these four subtypes of inhibitory neurons serve different functions in the processing of auditory stimuli.
Identification of GABAergic subtypes
In addition to our use of a substantially larger dataset (>7700 GABAergic cells), our main advance over previous studies is the use of two markers that likely have important functional implications. Ito et al. (2009) were the first to distinguish IC GABAergic cell types according to the presence of perisomatic VGLUT2+ boutons. These rings reflect differences in sources of inputs to IC cells (Ito and Oliver, 2012). Moreover, the target cell is likely to integrate the soma-targeted ring inputs differently from inputs targeting dendrites. Thus, VGLUT2 rings are likely to reflect functional differences in the ringed versus non-ringed cells. However, rings appear to be insufficient for distinguishing the full range of GABAergic subtypes; intrinsic membrane properties suggest at least four GABAergic subtypes, but VGLUT2 rings distinguish only two subtypes (Ono et al., 2005).
In combination with VGLUT2 rings, PNs allow distinction of four GABAergic subtypes. PNs, like the rings, are likely to distinguish cell types according to functional differences (Sonntag et al., 2015; discussed below). As such, GABAergic cells distinguished by these markers are highly likely to serve different functional roles in hearing.
Soma size is also likely to affect integrative properties. Previous studies used arbitrary criteria to distinguish size groups, whereas our criteria are based on differences between four subtypes distinguished by other, objective criteria (i.e., the presence or absence of PNs and VGLUT2 rings). Our data suggest that three size categories could account for the different distributions. Despite technical differences and likely differences between species, most previous studies also distinguished three sizes (Fig. 9). In any case, the use of size criteria allows finer discrimination of GABAergic cell types. Two subtypes—GAD–PN and GAD–VGLUT2 ring—are dominated by medium cells (Fig. 8B). The GAD–PN–VGLUT2 ring subtype is dominated by medium cells but includes a substantial number of large cells. Finally, the GAD-only subtype includes many medium and small cells. The possibility of more than four GABAergic subtypes is consistent with the numerous roles of GABA in the IC (Kelly and Caspary, 2005; Pollak, 2013) and the recognition of many GABAergic cell types in other brain areas (Lawrence, 2008; Kubota, 2014; Lovett-Barron and Losonczy, 2014). Nonetheless, we believe that these size categories should be considered putative until other characteristics (for example, axonal projection patterns or other molecular markers) corroborate the distinctions.
Physiological classifications of IC GABAergic cells
Ono et al. (2005) distinguished four subtypes of GABAergic IC cells based on intrinsic response properties. Three subtypes were heterogeneous in soma size, preventing a simple association of these physiological subtypes with the present anatomical subtypes. Their Th+ subtype (characterized by transient firing and a depolarization hump after the action potential) was distributed similarly to our GAD-only subtype and had a similar mean average diameter. It is possible that the Th+ cells described by Ono and colleagues match our GAD-only subtype and therefore likely lack PNs or VGLUT2 rings. Ono et al. speculated that T currents responsible for the depolarization hump in Th+ cells could combine with low-threshold K+ currents to increase throughput of synaptic transmission and that, because of their specific distribution pattern, this subtype is involved in integrative information processing.
Geis and Borst (2013) examined physiological properties of large (>30 μm diameter) GABAergic neurons in the ICd of mice in vivo. They found that large cells have low input resistance and fire action potentials with short delays and argued that these neurons constitute a distinct physiological subtype. This specific subtype had projections to the ventral and dorsal subdivisions of the MG and the nucleus of the brachium of the IC. Geis and Borst speculated that this group of GABAergic cells was specialized for fast inhibitory signaling to the thalamus. Comparison with the current data suggests a correlation with our GABAergic subtype with PNs and VGLUT2 rings. Interestingly, PNs are associated with a voltage-gated potassium channel subunit important in high-frequency firing both in the IC and other brain areas (Wang et al., 1998; Härtig et al., 1999; Hilbig et al., 2007), bolstering this “fast inhibitory signaling” theory.
Functional implications
Previous investigators suggested that dense rings of axosomatic VGLUT2+ terminals on large GABAergic cells in IC could allow these cells to overcome slow membrane time constants or to specialize in fast signaling (Ito et al. 2009, Geis and Borst 2013). In the visual system, VGLUT2 has been associated with driving inputs and feedforward circuits (as opposed to VGLUT1, which has been associated with modulatory inputs; Balaram et al., 2013). This same distinction may be present in the auditory system, because VGLUT1 and VGLUT2 are present in primarily separate terminal populations in the IC (Altschuler et al., 2008). VGLUT2+ axosomatic terminals on large GABAergic neurons in the IC come, at least in part, from local and commissural IC neurons (Ito and Oliver, 2014). These neurons also receive inputs from the cochlear nuclei, the superior olivary complex, and the nuclei of the lateral lemniscus (Ito et al., 2015). According to Ito et al. (2009), large GABAergic neurons receiving VGLUT2-expressing axosomatic terminals participate in the ascending projection to the MG, whereas smaller neurons without axosomatic VGLUT2+ inputs participate in the ascending projection less often. Because there appear to be very few GABAergic commissural neurons (Nakamoto et al., 2013), some GAD-only neurons may represent true interneurons, with no projection to the MG, the contralateral IC, or any other outside target. In contrast, GABAergic neurons surrounded by PNs and dense rings of VGLUT2+ terminals are likely to project to the MG and may have fewer local collaterals than small GAD-only cells (Geis and Borst, 2013). Additionally, projections to different MG subdivisions may have GABAergic subtype specificity, because the proportion of GABAergic cells in the IC–MG projection differs for the different MG subdivisions (Mellott et al., 2014).
PNs may serve multiple functions in the IC (Foster et al., 2014). The frequent co-occurrence of PNs and VGLUT2 rings around large GABAergic cells suggests several possibilities. PNs inhibit axonal sprouting and spine motility (Corvetti and Rossi, 2005; de Vivo et al., 2013). By inhibiting structural plasticity, PNs may serve to “lock in” this specialized synaptic structure (the VGLUT2 ring). PNs could also protect these large GABAergic cells from glutamate excitotoxicity (Okamoto et al., 1994). Such protection could be especially important because, unlike VGLUT1, VGLUT2 is upregulated with increased activity (De Gois et al., 2005). This raises the question of whether PNs around nonringed neurons serve a different function. PNs may regulate excitability (Dityatev et al., 2007; Vigetti et al., 2008) and protect neurons from oxidative stress (Cabungcal et al., 2013). PNs also regulate synaptic plasticity and stability, including the changes associated with closure of critical periods (Bukalo et al., 2001; Balmer et al., 2009; Frischknecht et al., 2009). In fact, removal of PNs restores juvenile-like plasticity in adults and may represent a target for therapeutic intervention after CNS injury (Bradbury et al., 2002; Pizzorusso et al., 2002; Gogolla et al., 2009).
Conclusions
PNs and perisomatic rings of VGLUT2+ terminals are preferentially associated with GABAergic cells. These markers allow IC GABAergic cells to be divided into four subtypes that also differ in soma size and distribution within the IC. GAD-only neurons are small or medium IC neurons lacking both a PN and a ring of VGLUT2+ terminals. This category represents the majority of GABAergic IC cells. GAD–PN and GAD–VGLUT2 ring neurons are surrounded by either a PN or a ring of VGLUT2+ terminals, respectively, and are medium cells present in more central IC regions. GAD–PN–VGLUT2 ring neurons are medium and large IC neurons surrounded by both a PN and a ring of VGLUT2+ terminals. This group includes the largest GABA cells. We conclude that these groups represent four distinct inhibitory subtypes that serve different functions in auditory processing.
PNs and VGLUT2 rings may be particularly valuable for identifying GABAergic subtypes outside the IC and beyond the auditory system. PNs are prominent in other areas of the brain, including the cerebral cortex, subcortical forebrain, and many brainstem centers (Härtig et al., 1992; Bertolotto et al., 1996). Although numerous markers, including calcium binding proteins and various neuropeptides, have been used to distinguish GABAergic subtypes in some regions (Lawrence, 2008; Rudy et al., 2011), the wide-ranging functions of PNs and VGLUT2 rings suggest that these extracellular markers may provide important functional insights into the GABAergic subtypes.
Footnotes
This work was supported by National Institutes of Health Grants R01 DC04391 and F31 DC014228. We thank Colleen Sowick and Megan Storey-Workley for expert technical assistance, as well as Will Noftz, and Drs. Yong Lu, Christine Dengler-Crish, and Samuel Crish for constructive comments on previous versions of this manuscript.
The authors declare no competing financial interests.
References
- Altschuler RA, Tong L, Holt AG, Oliver DL. Immunolocalization of vesicular glutamate transporters 1 and 2 in the rat inferior colliculus. Neuroscience. 2008;154:226–232. doi: 10.1016/j.neuroscience.2008.03.036. [DOI] [PMC free article] [PubMed] [Google Scholar]
- Bacci A, Huguenard JR, Prince DA. Modulation of neocortical interneurons: extrinsic influences and exercises in self-control. Trends Neurosci. 2005;28:602–610. doi: 10.1016/j.tins.2005.08.007. [DOI] [PubMed] [Google Scholar]
- Balaram P, Hackett TA, Kaas JH. Differential expression of vesicular glutamate transporters 1 and 2 may identify distinct modes of glutamatergic transmission in the macaque visual system. J Chem Neuroanat. 2013;50–51:21–38. doi: 10.1016/j.jchemneu.2013.02.007. [DOI] [PMC free article] [PubMed] [Google Scholar]
- Balmer TS, Carels VM, Frisch JL, Nick TA. Modulation of perineuronal nets and parvalbumin with developmental song learning. J Neurosci. 2009;29:12878–12885. doi: 10.1523/JNEUROSCI.2974-09.2009. [DOI] [PMC free article] [PubMed] [Google Scholar]
- Bertolotto A, Manzardo E, Guglielmone R. Immunohistochemical mapping of perineuronal nets containing chondroitin unsulfated proteoglycan in the rat central nervous system. Cell Tissue Res. 1996;283:283–295. doi: 10.1007/s004410050538. [DOI] [PubMed] [Google Scholar]
- Beurdeley M, Spatazza J, Lee HH, Sugiyama S, Bernard C, Di Nardo AA, Hensch TK, Prochiantz A. Otx2 binding to perineuronal nets persistently regulates plasticity in the mature visual cortex. J Neurosci. 2012;32:9429–9437. doi: 10.1523/JNEUROSCI.0394-12.2012. [DOI] [PMC free article] [PubMed] [Google Scholar]
- Bradbury EJ, Moon LD, Popat RJ, King VR, Bennett GS, Patel PN, Fawcett JW, McMahon SB. Chondroitinase ABC promotes functional recovery after spinal cord injury. Nature. 2002;416:636–640. doi: 10.1038/416636a. [DOI] [PubMed] [Google Scholar]
- Bukalo O, Schachner M, Dityatev A. Modification of extracellular matrix by enzymatic removal of chondroitin sulfate and by lack of tenascin-R differentially affects several forms of synaptic plasticity in the hippocampus. Neuroscience. 2001;104:359–369. doi: 10.1016/S0306-4522(01)00082-3. [DOI] [PubMed] [Google Scholar]
- Cabungcal JH, Steullet P, Morishita H, Kraftsik R, Cuenod M, Hensch TK, Do KQ. Perineuronal nets protect fast-spiking interneurons against oxidative stress. Proc Natl Acad Sci U S A. 2013;110:9130–9135. doi: 10.1073/pnas.1300454110. [DOI] [PMC free article] [PubMed] [Google Scholar]
- Coote EJ, Rees A. The distribution of nitric oxide synthase in the inferior colliculus of guinea pig. Neuroscience. 2008;154:218–225. doi: 10.1016/j.neuroscience.2008.02.030. [DOI] [PubMed] [Google Scholar]
- Corvetti L, Rossi F. Degradation of chondroitin sulfate proteoglycans induces sprouting of intact purkinje axons in the cerebellum of the adult rat. J Neurosci. 2005;25:7150–7158. doi: 10.1523/JNEUROSCI.0683-05.2005. [DOI] [PMC free article] [PubMed] [Google Scholar]
- De Gois S, Schäfer MK, Defamie N, Chen C, Ricci A, Weihe E, Varoqui H, Erickson JD. Homeostatic scaling of vesicular glutamate and GABA transporter expression in rat neocortical circuits. J Neurosci. 2005;25:7121–7133. doi: 10.1523/JNEUROSCI.5221-04.2005. [DOI] [PMC free article] [PubMed] [Google Scholar]
- de Vivo L, Landi S, Panniello M, Baroncelli L, Chierzi S, Mariotti L, Spolidoro M, Pizzorusso T, Maffei L, Ratto GM. Extracellular matrix inhibits structural and functional plasticity of dendritic spines in the adult visual cortex. Nat Commun. 2013;4:1484. doi: 10.1038/ncomms2491. [DOI] [PubMed] [Google Scholar]
- Dityatev A, Brückner G, Dityateva G, Grosche J, Kleene R, Schachner M. Activity-dependent formation and functions of chondroitin sulfate-rich extracellular matrix of perineuronal nets. Dev Neurobiol. 2007;67:570–588. doi: 10.1002/dneu.20361. [DOI] [PubMed] [Google Scholar]
- Faye-Lund H, Osen KK. Anatomy of the inferior colliculus in rat. Anat Embryol (Berl) 1985;171:1–20. doi: 10.1007/BF00319050. [DOI] [PubMed] [Google Scholar]
- Field A, Miles J, Field Z. Discovering statistics using R. London: Sage Publications; 2012. [Google Scholar]
- Foster NL, Mellott JG, Schofield BR. Perineuronal nets and GABAergic cells in the inferior colliculus of guinea pigs. Front Neuroanat. 2014;7:53. doi: 10.3389/fnana.2013.00053. [DOI] [PMC free article] [PubMed] [Google Scholar]
- Frischknecht R, Heine M, Perrais D, Seidenbecher CI, Choquet D, Gundelfinger ED. Brain extracellular matrix affects AMPA receptor lateral mobility and short-term synaptic plasticity. Nat Neurosci. 2009;12:897–904. doi: 10.1038/nn.2338. [DOI] [PubMed] [Google Scholar]
- Geis HR, Borst JG. Large GABAergic neurons form a distinct subclass within the mouse dorsal cortex of the inferior colliculus with respect to intrinsic properties, synaptic inputs, sound responses, and projections. J Comp Neurol. 2013;521:189–202. doi: 10.1002/cne.23170. [DOI] [PubMed] [Google Scholar]
- Gogolla N, Caroni P, Lüthi A, Herry C. Perineuronal nets protect fear memories from erasure. Science. 2009;325:1258–1261. doi: 10.1126/science.1174146. [DOI] [PubMed] [Google Scholar]
- Härtig W, Brauer K, Brückner G. Wisteria floribunda agglutinin-labelled nets surround parvalbumin-containing neurons. Neuroreport. 1992;3:869–872. doi: 10.1097/00001756-199210000-00012. [DOI] [PubMed] [Google Scholar]
- Härtig W, Derouiche A, Welt K, Brauer K, Grosche J, Mäder M, Reichenbach A, Brückner G. Cortical neurons immunoreactive for the potassium channel Kv3.1b subunit are predominantly surrounded by perineuronal nets presumed as a buffering system for cations. Brain Res. 1999;842:15–29. doi: 10.1016/S0006-8993(99)01784-9. [DOI] [PubMed] [Google Scholar]
- Hilbig H, Nowack S, Boeckler K, Bidmon HJ, Zilles K. Characterization of neuronal subsets surrounded by perineuronal nets in the rhesus auditory brainstem. J Anat. 2007;210:507–517. doi: 10.1111/j.1469-7580.2007.00713.x. [DOI] [PMC free article] [PubMed] [Google Scholar]
- Hothorn T, Bretz F, Westfall P. Simultaneous inference in general parametric models. Biom J. 2008;50:346–363. doi: 10.1002/bimj.200810425. [DOI] [PubMed] [Google Scholar]
- Ito T, Oliver DL. The basic circuit of the IC: tectothalamic neurons with different patterns of synaptic organization send different messages to the thalamus. Front Neural Circuits. 2012;6:48. doi: 10.3389/fncir.2012.00048. [DOI] [PMC free article] [PubMed] [Google Scholar]
- Ito T, Oliver DL. Local and commissural IC neurons make axosomatic inputs on large GABAergic tectothalamic neurons. J Comp Neurol. 2014;522:3539–3554. doi: 10.1002/cne.23623. [DOI] [PMC free article] [PubMed] [Google Scholar]
- Ito T, Bishop DC, Oliver DL. Two classes of GABAergic neurons in the inferior colliculus. J Neurosci. 2009;29:13860–13869. doi: 10.1523/JNEUROSCI.3454-09.2009. [DOI] [PMC free article] [PubMed] [Google Scholar]
- Ito T, Hioki H, Sohn J, Okamoto S, Kaneko T, Iino S, Oliver DL. Convergence of lemniscal and local excitatory inputs on large GABAergic tectothalamic neurons. J Comp Neurol. 2015;523:2277–2296. doi: 10.1002/cne.23789. [DOI] [PMC free article] [PubMed] [Google Scholar]
- Karetko M, Skangiel-Kramska J. Diverse functions of perineuronal nets. Acta Neurobiol Exp (Wars) 2009;69:564–577. doi: 10.55782/ane-2009-1766. [DOI] [PubMed] [Google Scholar]
- Kelly JB, Caspary DM. Pharmacology of the inferior colliculus. In: Winer JA, Schreiner CE, editors. The inferior colliculus. New York: Springer; 2005. pp. 248–281. [Google Scholar]
- Kubota Y. Untangling GABAergic wiring in the cortical microcircuit. Curr Opin Neurobiol. 2014;26:7–14. doi: 10.1016/j.conb.2013.10.003. [DOI] [PubMed] [Google Scholar]
- Lawrence JJ. Cholinergic control of GABA release: emerging parallels between neocortex and hippocampus. Trends Neurosci. 2008;31:317–327. doi: 10.1016/j.tins.2008.03.008. [DOI] [PubMed] [Google Scholar]
- Lovett-Barron M, Losonczy A. Behavioral consequences of GABAergic neuronal diversity. Curr Opin Neurobiol. 2014;26:27–33. doi: 10.1016/j.conb.2013.11.002. [DOI] [PubMed] [Google Scholar]
- Mellott JG, Foster NL, Ohl AP, Schofield BR. Excitatory and inhibitory projections in parallel pathways from the inferior colliculus to the auditory thalamus. Front Neuroanat. 2014;8:124. doi: 10.3389/fnana.2014.00124. [DOI] [PMC free article] [PubMed] [Google Scholar]
- Merchán M, Aguilar LA, Lopez-Poveda EA, Malmierca MS. The inferior colliculus of the rat: quantitative immunocytochemical study of GABA and glycine. Neuroscience. 2005;136:907–925. doi: 10.1016/j.neuroscience.2004.12.030. [DOI] [PubMed] [Google Scholar]
- Nakamoto KT, Sowick CS, Schofield BR. Auditory cortical axons contact commissural cells throughout the guinea pig inferior colliculus. Hear Res. 2013;306:131–144. doi: 10.1016/j.heares.2013.10.003. [DOI] [PMC free article] [PubMed] [Google Scholar]
- Okamoto M, Mori S, Endo H. A protective action of chondroitin sulfate proteoglycans against neuronal cell death induced by glutamate. Brain Res. 1994;637:57–67. doi: 10.1016/0006-8993(94)91217-3. [DOI] [PubMed] [Google Scholar]
- Okoyama S, Ohbayashi M, Ito M, Harada S. Neuronal organization of the rat inferior colliculus participating in four major auditory pathways. Hear Res. 2006;218:72–80. doi: 10.1016/j.heares.2006.04.004. [DOI] [PubMed] [Google Scholar]
- Oliver DL, Winer JA, Beckius GE, Saint Marie RL. Morphology of GABAergic neurons in the inferior colliculus of the cat. J Comp Neurol. 1994;340:27–42. doi: 10.1002/cne.903400104. [DOI] [PubMed] [Google Scholar]
- Ono M, Yanagawa Y, Koyano K. GABAergic neurons in inferior colliculus of the GAD67-GFP knock in mouse: electrophysiological and morphological properties. Neurosci Res. 2005;51:475–492. doi: 10.1016/j.neures.2004.12.019. [DOI] [PubMed] [Google Scholar]
- Peruzzi D, Bartlett E, Smith PH, Oliver DL. A monosynaptic GABAergic input from the inferior colliculus to the medial geniculate body in rat. J Neurosci. 1997;17:3766–3777. doi: 10.1523/JNEUROSCI.17-10-03766.1997. [DOI] [PMC free article] [PubMed] [Google Scholar]
- Pinheiro J, Bates D, DebRoy S Sarkar D and R Core Team. _nlme: linear and nonlinear mixed effects models_. R package version 3.1–118. 2014. http://CRAN.R-project.org/package=nlme.
- Pizzorusso T, Medini P, Berardi N, Chierzi S, Fawcett JW, Maffei L. Reactivation of ocular dominance plasticity in the adult visual cortex. Science. 2002;298:1248–1251. doi: 10.1126/science.1072699. [DOI] [PubMed] [Google Scholar]
- Pollak GD. The dominant role of inhibition in creating response selectivities for communication calls in the brainstem auditory system. Hear Res. 2013;305:86–101. doi: 10.1016/j.heares.2013.03.001. [DOI] [PMC free article] [PubMed] [Google Scholar]
- R Core Team. R: A language and environment for statistical computing. Vienna: R Foundation for Statistical Computing; 2014. [Google Scholar]
- Roberts RC, Ribak CE. An electron microscopic study of GABAergic neurons and terminals in the central nucleus of the inferior colliculus of the rat. J Neurocytol. 1987a;16:333–345. doi: 10.1007/BF01611345. [DOI] [PubMed] [Google Scholar]
- Roberts RC, Ribak CE. GABAergic neurons and axon terminals in the brainstem auditory nuclei of the gerbil. J Comp Neurol. 1987b;258:267–280. doi: 10.1002/cne.902580207. [DOI] [PubMed] [Google Scholar]
- Rudy B, Fishell G, Lee S, Hjerling-Leffler J. Three groups of interneurons account for nearly 100% of neocortical GABAergic neurons. Dev Neurobiol. 2011;71:45–61. doi: 10.1002/dneu.20853. [DOI] [PMC free article] [PubMed] [Google Scholar]
- Sergeeva A, Jansen HT. Neuroanatomical plasticity in the gonadotropin-releasing hormone system of the ewe: seasonal variation in glutamatergic and γ-aminobutyric acidergic afferents. J Comp Neurol. 2009;515:615–628. doi: 10.1002/cne.22087. [DOI] [PubMed] [Google Scholar]
- Sivaramakrishnan S, Sterbing-D'Angelo SJ, Filipovic B, D'Angelo WR, Oliver DL, Kuwada S. GABAA synapses shape neuronal responses to sound intensity in the inferior colliculus. J Neurosci. 2004;24:5031–5043. doi: 10.1523/JNEUROSCI.0357-04.2004. [DOI] [PMC free article] [PubMed] [Google Scholar]
- Sonntag M, Blosa M, Schmidt S, Rübsamen R, Morawski M. Perineuronal nets in the auditory system. Hear Res. 2015;329:21–32. doi: 10.1016/j.heares.2014.12.012. [DOI] [PubMed] [Google Scholar]
- Suttkus A, Rohn S, Jäger C, Arendt T, Morawski M. Neuroprotection against iron-induced cell death by perineuronal nets - an in vivo analysis of oxidative stress. Am J Neurodegener Dis. 2012;1:122–129. [PMC free article] [PubMed] [Google Scholar]
- Vigetti D, Andrini O, Clerici M, Negrini D, Passi A, Moriondo A. Chondroitin sulfates act as extracellular gating modifiers on voltage-dependent ion channels. Cell Physiol Biochem. 2008;22:137–146. doi: 10.1159/000149791. [DOI] [PubMed] [Google Scholar]
- Wang LY, Gan L, Forsythe ID, Kaczmarek LK. Contribution of the Kv3.1 potassium channel to high-frequency firing in mouse auditory neurones. J Physiol. 1998;509:183–194. doi: 10.1111/j.1469-7793.1998.183bo.x. [DOI] [PMC free article] [PubMed] [Google Scholar]


