Abstract
High-pressure Raman spectroscopy and x-ray diffraction of Sb2S3 up to 53 GPa reveals two phase transitions at 5 GPa and 15 GPa. The first transition is evidenced by noticeable compressibility changes in distinct Raman-active modes, in the lattice parameter axial ratios, the unit cell volume, as well as in specific interatomic bond lengths and bond angles. By taking into account relevant results from the literature, we assign these effects to a second-order isostructural transition arising from an electronic topological transition in Sb2S3 near 5 GPa. Close comparison between Sb2S3 and Sb2Se3 up to 10 GPa reveals a slightly diverse structural behavior for these two compounds after the isostructural transition pressure. This structural diversity appears to account for the different pressure-induced electronic behavior of Sb2S3 and Sb2Se3 up to 10 GPa, i.e. the absence of an insulator-metal transition in Sb2S3 up to that pressure. Finally, the second high-pressure modification appearing above 15 GPa appears to trigger a structural disorder at ~20 GPa; full decompression from 53 GPa leads to the recovery of an amorphous state.
The Sb2S3 material (stibnite) is a well-known binary semiconductor with an optical band gap Eg ~ 1.7 eV1. This material constitutes a promising candidate for solar energy conversion2 and optoelectronic applications3. At ambient conditions, Sb2S3 crystallizes in a complex orthorhombic structure (SG Pnma, Z = 4, U2S3-type)4. This Pnma phase can be described as a layered structure, consisting of parallel molecular (Sb4S6)n ribbon-like chains along the short b-axis held together by weak intermolecular forces. The Sb3+ ions are located at two different sites in this phase, and their coordination environment can be described as sevenfold for the Sb(1) ion and eightfold (7 + 1) for the Sb(2) ion, respectively (Fig. 1). The same structure is adopted by Sb2Se35, whereas Sb2Te3 adopts a rhombohedral structure (SG  , Z = 3) made up of SbTe6 octahedral layers piled up along c-axis6 due to the absence of the Sb3+ lone electron pair stereochemical activity7.
Figure 1. Unit cell of Sb2S3 at ambient conditions (SG Pnma, Z = 4).
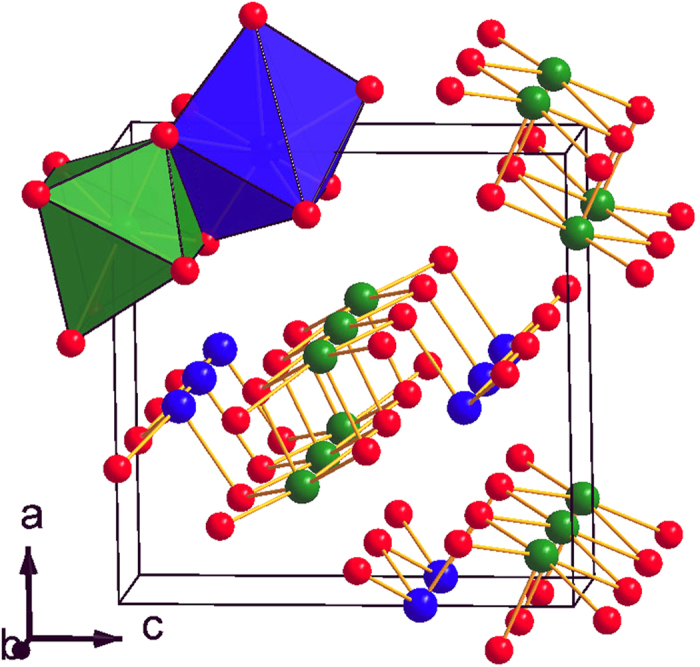
The blue, green, and red spheres correspond to the Sb(1), Sb(2), and S ions, respectively. The blue Sb(1)S7 and green Sb(2)S7+1 polyhedra are also displayed.
Very recently, Sb2Se3 was shown also to undergo an electronic topological transition (ETT) near 3 GPa8, with theoretical works corroborating such behavior9,10. This ETT, which appears to be a common trend for these systems11, was manifested as a second-order isostructural transition via compressibility changes in several structural parameters11,12. We remind here that an ETT occurs when a band extremum, which is associated to a Van Hove singularity, crosses the Fermi energy (EF) and leads to a strong redistribution of the electronic density of states (EDOS) near EF. This EDOS redistribution induces a second-order isostructural transition, i.e. a transition without any volume discontinuity at the transition point or changes in the crystalline symmetry. The elastic constants are affected by the ETT, however, hence leading to distinct compressibility changes of the material under study13,14. In addition, high-pressure resistivity measurements of Sb2Se3 revealed also an insulator-metal transition near 3 GPa, whereas pressure-induced superconductivity was observed above 10 GPa12. The superconducting state persisted up to 40 GPa, with further compression leading to the transformation of the Pnma structure into a disordered body-centered cubic (bcc) phase above 55 GPa15.
A similar ETT was recently observed for Sb2S3 by means of Raman spectroscopic and resistivity probes near 5 GPa, with a second phase transition following at 20 GPa16. Even though a x-ray diffraction (XRD) study of Sb2S3 up to 10 GPa showed the persistence of the Pnma phase up to that pressure17, the mechanism of ETT at 5 GPa, the detection of the second transition at 20 GPa, as well as the possibility of additional structural modifications upon further compression15,18,19,20, calls for an updated structural investigation of Sb2S3 in a more extended pressure range.
We present here our combined high-pressure Raman and XRD studies on Sb2S3 up to 25 GPa and 53 GPa, respectively. Overall, we have detected two phase transitions at 5 GPa and 15 GPa. The first transition is manifested via compressibility changes in several structural parameters, an observation which correlates strongly with the reported ETT16. As for the second transition at 15 GPa, this new phase could not be identified due to the onset of structural disorder above 20 GPa. Full decompression of Sb2S3 from 53 GPa leads to the recovery of an amorphous state.
Results
Given that Raman spectroscopy is a more sensitive probe for isostructural transitions11, we present first our high-pressure Raman spectroscopic investigation on Sb2S3. According to group theory, a sum of thirty Raman-active modes are expected for the Pnma phase of Sb2S321:
 |
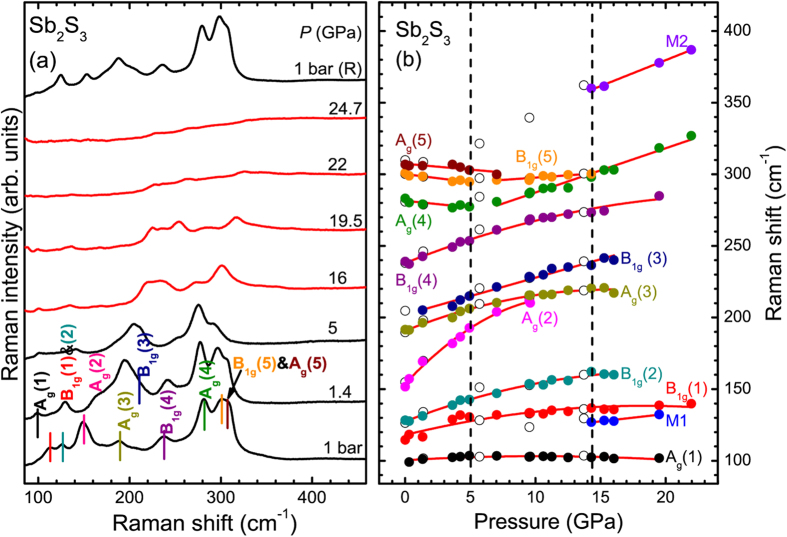
We can resolve ten broad bands in our Raman spectra (Fig. 2), which is consistent with the reported literature16,22,23. The mode assignment is adopted from the polarization studies of Sereni et al.23 (Table 1). Upon increasing pressure, most of the Raman modes upshift in frequency; on the contrary, the high-frequency Ag(4), Ag(5), and B1g(5) modes downshift in energy up to 5 GPa. Beyond that pressure, the Ag(4) and B1g(5) features display a compressibility change, with the Ag(4) mode exhibiting a completely different pressure-induced behavior after 5 GPa with a positive pressure slope [Fig. 2(b) and Table 1]. In addition, the pressure slope of the B1g(5) mode reduces substantially beyond 5 GPa. As for the Ag(5) mode, it merges with its neighboring B1g(5) mode at 7 GPa, and could not be followed above that pressure. Since these modes correspond to the stretching vibrations of the shorter Sb-S distances22, the observed compressibility changes should reflect the pressure-induced behavior of the corresponding bond lengths. Overall, our observations are in excellent agreement with the recent study of Sorb et al.16.
Figure 2. High-pressure Raman spectroscopic results of Sb2S3.
(a) Raman spectra of Sb2S3 at selected pressures (λ = 532 nm, T = 300 K). Vertical lines indicate the Sb2S3 Raman-active modes. (b) Raman mode frequency evolution of Sb2S3 against pressure. Solid and open circles correspond to data collected upon compression and decompression, respectively. Solid lines represent least square fits. The dashed lines mark the onset of phase transitions (see text).
Table 1. Mode assignment23, Raman mode frequencies, pressure coefficients, and the mode Gruneisen parameters γ of the Raman features of Sb2S3 calculated at a reference pressure P R.
| Modesymmetry | PR(GPa) | ωR(cm−1) | ∂ω/∂P(cm−1/GPa) | ∂2ω/∂P2(cm−1/GPa2) | γ |
|---|---|---|---|---|---|
| Ag(1) | 10−4 | 100.4 | 0.6 | −0.03 | 0.16 |
| B1g(1) | 10−4 | 108 | 2.2 | −0.06 | 0.55 |
| B1g(2) | 10−4 | 127.5 | 3.5 | −0.09 | 0.75 |
| Ag(2) | 10−4 | 153.8 | 9.7 | −0.4 | 1.72 |
| Ag(3) | 10−4 | 190.8 | 3.6 | −0.11 | 0.51 |
| B1g(3) | 10−4 | 202 | 2.6 | – | 0.35 |
| B1g(4) | 10−4 | 238 | 3.7 | −0.07 | 0.42 |
| Ag(4) | 10−4 | 281.5 | −0.9 | – | −0.09 |
| 5 | 271 | 3.1 | – | 0.74 | |
| B1g(5) | 10 − 4 | 300.1 | −1.1 | – | −0.1 |
| 5 | 295 | −0.6 | – | −0.13 | |
| Ag(5) | 307 | −0.8 | – | 0.07 | |
| M1 | 15 | 127 | 1 | – | – |
| M2 | 15 | 361 | 3.6 | – | – |
The pressure depencence of the Raman-active modes is described by the relation: ω(P) = ωR + αP + bP2. Mode Gruneisen parameters γ are determined from the relation: γ = (B0/ωR) × (∂ω/∂P); the bulk modulus B0 = 27.2 GPa (or B = 65 GPa at 5 GPa) was employed.
Further compression of Sb2S3 results in the appearance of two new low-intensity features beyond 15 GPa [denoted as M1 and M2 in Fig. 2(b), see also supplementary Fig. S1]. Since the strongest Raman features of elemental Sb24 and S25,26,27 do not reside in these frequencies, we can safely exclude any decomposition and attribute the appearance of the M1 and M2 features to a pressure-induced phase transition. The M2 feature was also detected in the study of Sorb et al. above 20 GPa16. Beyond 15 GPa, however, the Raman modes exhibit pronounced broadening; consequently, the Raman spectra become rather featureless at 22 GPa [Fig. 2(a)]. Full decompression from 25 GPa leads to the recovery of the original Sb2S3 Raman spectrum, indicating the reversibility of the pressure-induced Raman changes.
Having documented the pressure-induced changes from our Raman investigation, we now focus on the structural properties of Sb2S3 under pressure. Selected XRD patterns are presented in Fig. 3. As we can observe, the Bragg peaks of the Pnma phase could be detected up to the highest pressure, i.e. 53 GPa. The Bragg peaks, however, exhibit significant broadening beyond 20 GPa, indicating the onset of structural disorder above that pressure. This pressure-induced structural disorder is most likely responsible for the featureless Raman spectra at 22 GPa [Fig. 2(a)]. Further compression leads to the substantial broadening of the Pnma Bragg peaks in our XRD patterns. Upon decompression from 53 GPa we obtain an amorphous-like state, in apparent contradiction with our Raman study where the original phase is recovered upon decompression from 25 GPa [Fig. 2(a)]. It appears that unloading from a significantly larger pressure favors the quenching of an amorphous state instead of the original structure.
Figure 3. Selected XRD patterns of Sb2S3 at various pressures pressures (λ = 0.4246 Å, T = 300 K).
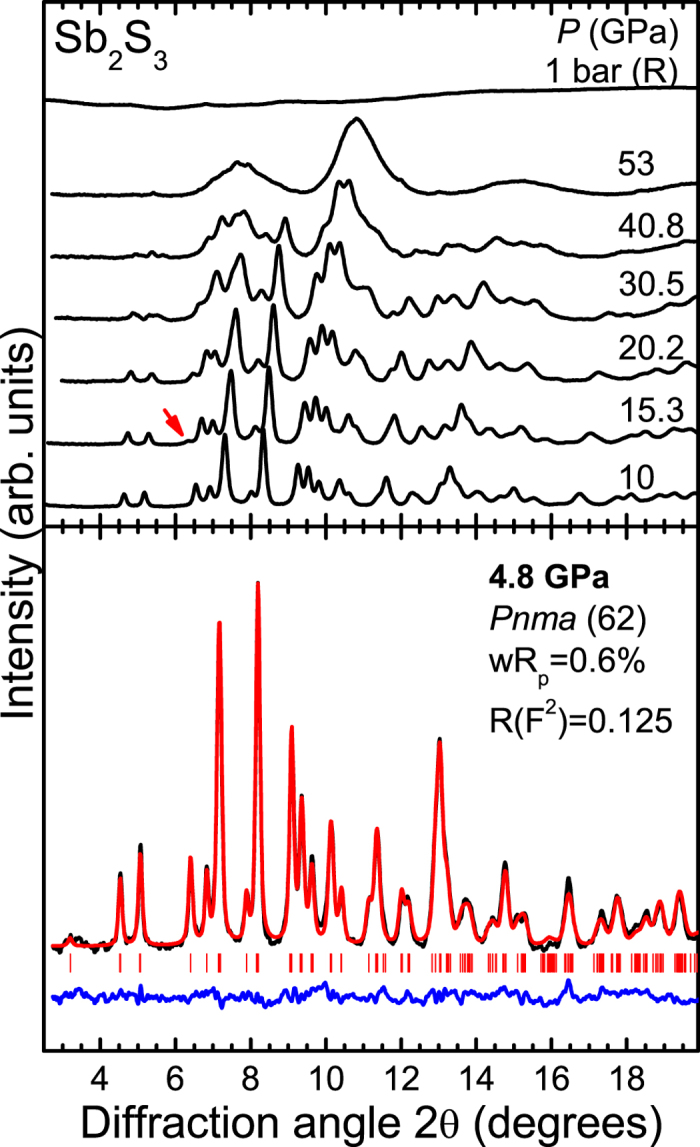
The red arrow marks the new Bragg feature. An example of a Rietveld refinement at 4.8 GPa is also provided. The black and red solid lines correspond to the measured and the fitted spectra, whereas their difference is depicted as a blue line. Vertical ticks mark the Bragg peak positions for the Pnma phase.
In addition, a new Bragg peak could be detected at 2θ ≈ 6.6° near 15 GPa (Fig. 3 and supplementary Fig. S2). This feature could not be assigned either to the Pnma or any “contaminating” phase such as rhenium (gasket material), helium, or ruby. Therefore, the appearance of this extra Bragg peak signals a structural transition of Sb2S3 at 15 GPa, in excellent agreement with our Raman study (Fig. 2). Attempts to fit the XRD patterns with any of the reported high-pressure phases of related A2B3 compounds18,19,20,28 proved unsuccessful. A possible elemental decomposition into Sb29 and S30 could also not account for this novel peak. Therefore, we speculate that the Sb2S3 XRD patterns consist of a mixture of two phases above 15 GPa, i.e. the Pnma structure and a high-pressure modification. Due to the pronounced Bragg peak broadening and the fact that this high-pressure phase is characterized by a single Bragg feature, however, its identification becomes unattainable at this point.
Given the aforementioned Bragg peak overlap and broadening upon pressure increase, the interatomic and lattice parameters of the Pnma phase could be obtained reliably up to 9 GPa and 20 GPa, respectively. All of these structural data are provided in supplementary Tables S1 and S2, whereas the extracted P-V data are shown in Fig. 4. As we can observe, there is a clear compressibility change in the volume and in the orthorhombic axial ratios near 5 GPa, in excellent agreement with the compressibility changes observed in our Raman spectra (Fig. 2). By taking into account the pressure-induced behavior of isostructural Sb2Se38,12 and Bi2S331 compounds, and in close comparison with the related Bi2Te332,33, we attribute these compressibility changes to an isostructural transition of Sb2S3 near 5 GPa. This isostructural transition is most likely the signature of the reported ETT in Sb2S316, reflecting a change in the topology of the Fermi surface8,10,11,13.
Figure 4. Plot of the unit cell volume as a function of pressure for the Pnma phase of Sb2S3.
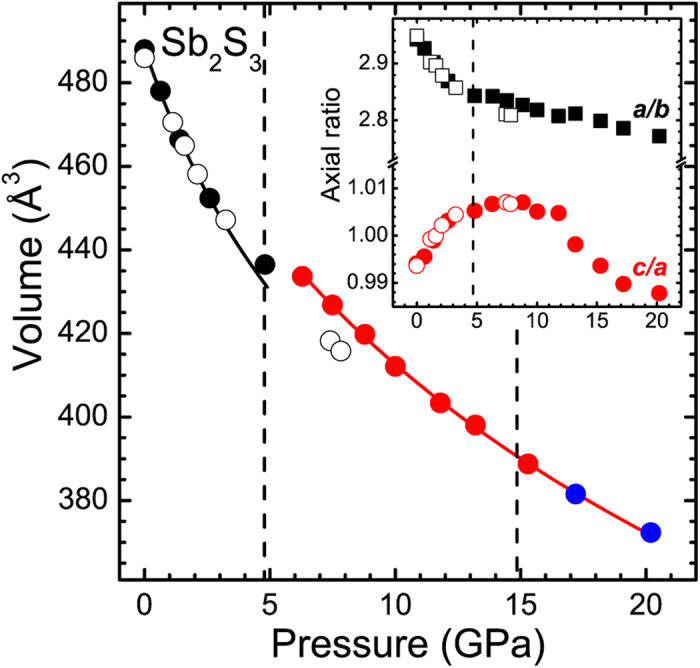
The solid lines represent the fitted Birch-Murnaghan Equation of State. The orthorhombic axial ratios are shown in the inset. The vertical dashed lines mark the onset of phase transitions (see text). The open symbols correspond to data from Lundegaard et al.17.
The fitting of the P-V data to a Birch-Murnaghan Equation of State (B-M EoS) yielded volumes and bulk moduli values of V0 = 488.2 (4) Å3 and B0 = 27.2(6) GPa, and V = 434.2(7) Å3 and B = 65(2) GPa (calculated at P = 5 GPa) before and after the isostructural transition, with fixed bulk moduli derivatives of B′0 = 6 and B’ = 4, respectively. The B0 value of Sb2S3 prior to the transition is consistent with that of Lundegaard et al.17 and in line with the B0 value of Sb2Se312,15.
Except from these compressibility changes in the lattice parameters and the bulk volume, inspection of the interatomic parameters also reveals distinct changes above 4 GPa (Fig. 5). For example, we can observe that the Sb(1)-S(3) short bond distance elongates up to 4 GPa, whereas a reduction is evidenced above that pressure. Actually, this pressure-induced trend is in excellent agreement with the behavior of the stretching Ag(4) Raman-active mode [Fig. 2(b)]. A similar trend applies for the S(3)-Sb(2)-S(3) bond angle (Fig. 5), which reflects the tiltings and distortions of the Sb(1)S7 polyhedra12. Overall, the isostructural transition can be readily witnessed from the behavior of the interatomic parameters, a common trend for these systems12,15,31.
Figure 5. Distinct interatomic Sb2S3 parameters as a function of pressure.
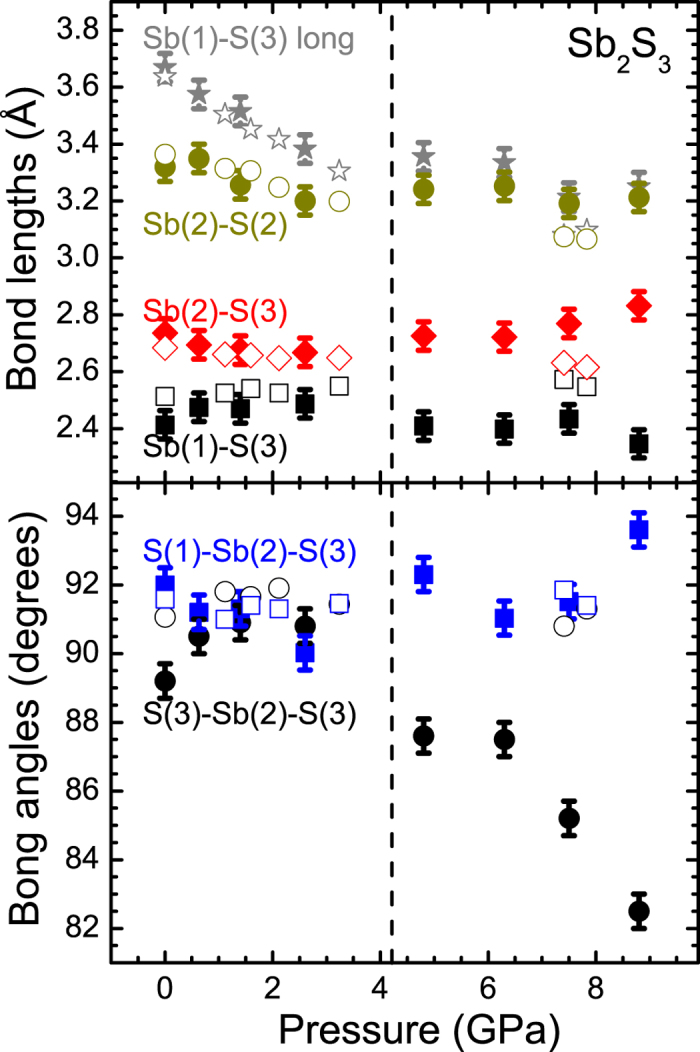
(a) Selected Sb-S bond lengths and (b) S-Sb-S bond angles up to 9 GPa. The vertical dashed line marks the onset of the isostructural transition. The nomenclature of the Sb and S ions is provided in supplementary Fig. S3. The open symbols correspond to data from Lundegaard et al.17.
Discussion
Having resolved the structural evolution of Sb2S3 under pressure, a comparison between the pressure-induced behavior of Sb2S3 and the isostructural Sb2Se3 is in order. Both of these compounds exhibit isostructural transitions at the same pressure, i.e. close to 5 GPa12,15. In both cases, an electronic topological transition was put forward in order to account for the structural and vibrational changes beyond that pressure8,12,16. Interestingly, the high-pressure resistivity studies of these compounds reveal diverse behavior12,16. In particular, the room temperature resistivity of Sb2S3 was found to increase up to 5 GPa, where it reached saturation; two anomalies were also detected at 1.4 GPa and 2.4 GPa16. For Sb2Se3 on the other hand, a reduction of resistivity was observed up to 3.5 GPa, where an insulator-metal transition takes place; further compression leads to the induction of superconductivity at 10 GPa (Tc = 2 K)12. This pressure-induced behavior of Sb2Se3 resembles the transport properties of Bi2Se3, Bi2Te3, and Sb2Te3 compounds34,35,36,37,38,39. Given the fact that Sb2S3 and Sb2Se3 exhibit almost identical electronic band structures7,40, this diverse behavior in resistivity is puzzling.
A direct comparison between the pressure-induced behavior of the Sb2S3 and Sb2Se3 structural parameters provides some hints. Generally, the compression mechanism for both compounds is practically identical up to 5 GPa15. As expected, the b-axis is the least compressible direction, since it contains the Sb4S(Se)6 molecular ribbons comprising the Pnma structure (Fig. 1). On the other hand, the a-axis and c-axis reduce much faster compared to b-axis under compression, with a-axis being more compressible than c-axis up to 5 GPa. This is easily evidenced from the increasing rate of the c/a axial ratio up to that pressure [Fig. 6(a)].
Figure 6. Structural comparison between Sb2S3 and Sb2Se3.
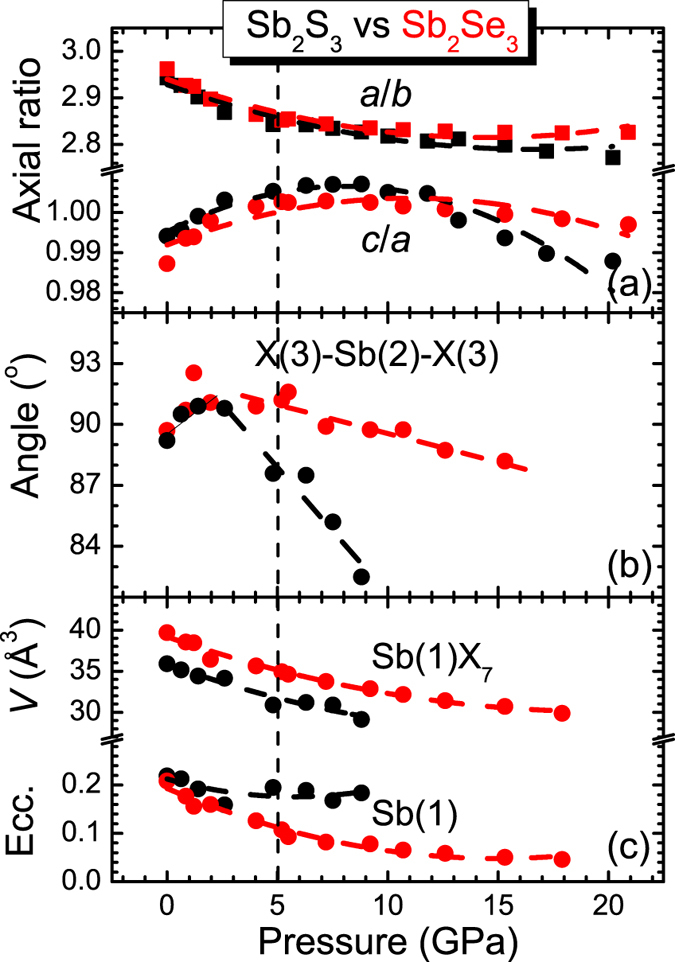
Plot of (a) orthorhombic axial ratios, (b) the X(3)-Sb(2)-X(3) bond angle, (c) Sb(1)X7 polyhedral volumes, and the Sb(1) cation eccentricity as a function of pressure for both Sb2S3 (black) and Sb2Se3 (red, data from ref. 15). Dashed lines are guides to the eye. The vertical dashed line marks the isostructural transition.
Beyond 5 GPa, however, Sb2S3 and Sb2Se3 exhibit slghtly diverse compressibility trends. In particular, the orthorhombic c-axis becomes more compressible and the b-axis less compressible in Sb2S3 than Sb2Se3 above 5 GPa; the a-axis exhibits similar compressibility for both compounds. As a result, the axial ratios of Sb2S3 behave differently than those of Sb2Se3 above 5 GPa, e.g. the Sb2S3 c/a axial ratio shows a more prominent decreasing trend beyond 5 GPa compared to the Sb2Se3 c/a axial ratio [Fig. 6(a)].
A closer look at the microscopic structural behavior reveals additional information. In Fig. 6(b,c) we plot the pressure-induced evolution of the X(3)-Sb(2)-X(3) bond angle, the volume of the Sb(1)X7 polyhedra (X = S, Se), and the Sb(1) cation eccentricity for both Sb2S3 and Sb2Se3 compounds. We note that the X(3)-Sb(2)-X(3) bond angle reflects the tiltings of the Sb(1)X7 polyhedra parallel to the ac plane12, whereas the cation eccentricity is a quantitative measure of the stereochemical activity of the Sb3+ lone electron pair (LEP); the larger the eccentricity value, the more active the LEP17,41. As we can observe, the X(3)-Sb(2)-X3 bond angles behave similarly for both Sb2S3 and Sb2Se3 up to 5 GPa, i.e. up to the isostructural transition [Fig. 6(b)]. Further compression, however, leads to the reduction of the S(3)-Sb(2)-S(3) bond angle in Sb2S3 in a more pronounced rate compared to the Se(3)-Sb(2)-Se(3) bond angle of Sb2Se3. Given that the LEPs are located at the ac plane42,43, this diverse bond angle changes mirror different Sb3+ LEP behaviors in these materials.
Indeed, in Fig. 6(c) we can observe that the Sb(1) cation eccentricities of Sb2S3 and Sb2Se3 display different behavior beyond 5 GPa. More precisely, the larger Sb(1) eccentricity value for Sb2S3 compared to Sb2Se3 indicates a larger stereochemical activity for the former after the isostructural transition. In other words, the Sb(1) LEP of Sb2S3 does not hybridize strongly with its neighboring S-p orbitals up to 10 GPa, as opposed to Sb2Se3 where the Sb(1) cation eccentricity value approaches an almost zero value after 5 GPa (almost complete orbital overlap). We speculate that this lack of LEP hybridization in Sb2S3 up to 10 GPa is the reason behind the different pressure-induced behavior in the electronic properties of Sb2S3 and Sb2Se3, i.e. the reason why an insulator-metal transition is observed for Sb2Se312 and not in Sb2S3 (at least up to 10 GPa)16. Theoretical calculations are required, however, to verify this scenario.
Finally, we would like to briefly address the structural disorder in Sb2S3 initiating beyond 20 GPa (Fig. 3). Interestingly, the onset of this structural disorder lies at much lower pressures compared to Sb2Se315 and Bi2S331, but close with that of α-Sb2O344. Such disorder can generally be accounted for by two mechanisms45: (a) the disordered phase may be a precursor of a structural transformation into another crystalline phase, which cannot be formed due to kinetic barriers, or (b) the tendency of the material to decompose into its constituents. Given the pressure-induced trends of Bi2Te319,35,46, Sb2Te318,28, Bi2Se320,37,47,48,49, and Sb2Se315 towards high-pressure disordered phases instead of elemental decomposition, however, the scenario of a kinetically-hindered structural transition in Sb2S3 appears more plausible. Actually, the appearance of the high-pressure modification above 15 GPa might be exactly that, i.e. the onset of a structural transformation of the Pnma phase towards another crystalline state, which is obstructed due to kinetic effects; a combined high-pressure and high-temperature structural study will be needed in order to resolve this matter. Considering nevertheless the structural trends of the A2B3 series under pressure, we can expect that this new structure will exhibit higher cationic coordinations.
In conclusion, our combined high-pressure Raman and XRD investigations revealed two phase transitions in Sb2S3 at 5 GPa and 15 GPa. The first transition is manifested via noticeable compressibility changes in several structural parameters. By taking into account an earlier report16, we assign these changes to a second-order isostructural transition arising from changes in the electronic structure of Sb2S3. Close comparison between the Sb2S3 and Sb2Se3 compounds up to 10 GPa reveals a slightly diverse pressure-induced behavior in the Sb3+ LEP activity after the isostructural transition, a plausible reason behind their different high-pressure electronic behavior above 5 GPa12,16. As for the second transition of Sb2S3 at 15 GPa, the new phase could not be identified due to the onset of structural disorder above 20 GPa. We speculate that the structural disorder is a transient state of this new high-pressure phase, which cannot be completed due to kinetic effects. Finally, an amorphous state is recovered upon full decompression from 53 GPa.
Materials and Methods
Sample and high-pressure technique details
Polycrystalline Sb2S3 powder was purchased commercially (Alfa-Aesar, 99.999% purity). The XRD measurements at ambient conditions did not detect any impurity phases. Pressure was generated with a gasketed symmetric diamond anvil cell, equipped with a set of diamonds with 300 μm culet diameter. The ruby luminescence method was employed for pressure calibration50.
High-pressure Raman spectroscopy
The high-pressure Raman measurements were conducted with a solid-state laser (λ = 532 nm) coupled to a single-stage spectrometer and a charge-coupled device. The spectral resolution was 2 cm−1 and the lowest resolvable frequency was ~90 cm−1. Given the photo-sensitivity of the material51, the incident laser power was kept below 2 mW outside the DAC, whereas the size of the laser spot on the sample was approximately 30 μm. Mixtures of methanol-ethanol 4:1 and methanol-ethanol-water 16:3:1 served as pressure transmitiing media (PTM) in separate experimental runs.
High-pressure angle-dispersive powder x-ray diffraction
The monochromatic angle-dispersive powder x-ray diffraction (XRD) measurements under pressure were performed at the 16BM-D beamline of the High Pressure Collaborative Access Team’s facility, at the Advanced Photon Source of Argonne National Laboratory (APS-ANL). The x-ray beam wavelength was λ = 0.4246 Å and the sample-detector distance about 320 mm. The XRD patterns were collected with a MAR345 Image Plate detector. The geometrical parameters were calibrated with a CeO2 standard from NIST. The intensity versus 2θ spectra were processed with the FIT2D software52. Refinements were performed with the GSAS + EXPGUI software packages53, whereas crystal-chemical calculations with the IVTON software54. The P-V data were fitted with a Birch-Murnaghan equation of state (B-M EoS)55. Helium was employed as PTM; the compressed gas loading took place at the gas-loading system of GeoSoilEnviroCARS56 (Sector 13, APS-ANL).
Additional Information
How to cite this article: Efthimiopoulos, I. et al. Structural properties of Sb2S3 under pressure: evidence of an electronic topological transition. Sci. Rep. 6, 24246; doi: 10.1038/srep24246 (2016).
Supplementary Material
Acknowledgments
Portion of this research was supported by the Michigan Space Grant Consortium and the Research Faculty Fellowship of Oakland University. We would like to thank Dr. D. Popov for his help with the XRD measurements, and Dr. S. Tkachev at GeoSoilEnviroCARS (Sector 13), APS-ANL for his assistance with the DAC gas loading. Portions of this work were performed at HPCAT (Sector 16), Advanced Photon Source (APS), Argonne National Laboratory. HPCAT operations are supported by DOE-NNSA under Award No. DE-NA0001974 and DOE-BES under Award No. DE-FG02-99ER45775, with partial instrumentation funding by NSF. The Advanced Photon Source is a U.S. Department of Energy (DOE) Office of Science User Facility operated for the DOE Office of Science by Argonne National Laboratory under Contract No. DE-AC02-06CH11357. Use of the COMPRES-GSECARS gas loading system was supported by COMPRES under NSF Cooperative Agreement EAR 11-57758 and by GSECARS through NSF grant EAR-1128799 and DOE grant DE-FG02-94ER14466. This research used resources of the Advanced Photon Source, a U.S. Department of Energy (DOE) Office of Science User Facility operated for the DOE Office of Science by Argonne National Laboratory under Contract No. DE-AC02-06CH11357.
Footnotes
Author Contributions I.E. and Y.W. designed the project. I.E., C.B. and Y.W. did the experiments. I.E. and Y.W. analyzed the data and wrote the manuscript. All authors reviewed the manuscript.
References
- Efstathiou A. & Levin E. R. Optical Properties of As2Se3, (AsxSb1−x)2Se3, and SbxS3. J. Opt. Soc. Amer. 58, 373 (1968). [Google Scholar]
- Savadogo O. & Mandal K. C. Studies on new chemically deposited photoconducting antimony trisulphide thin films. Sol. Energy Mater. Sol. Cells 26, 117 (1992). [Google Scholar]
- Rajpure K. Y. & Bhosale C. H. Preparation and characterization of spray deposited photoactive Sb2S3 and Sb2Se3 thin films using aqueous and non-aqueous media. Mater. Chem. Phys. 73, 6 (2002). [Google Scholar]
- Bayliss P. & Nowacki W. Refinement of the crystal structure of stibnite, Sb2S3. Z. Krist. 135, 308 (1972). [Google Scholar]
- Voutsas G. P., Papazoglou A. G., Rentzeperis P. J. & Siapkas D. The crystal structure of antimony selenide, Sb2Se3. Zeit. Krist. 171, 261 (1985). [Google Scholar]
- Anderson T. L. & Krause H. B. Refinement of the Sb2Te3 and Sb2Te2Se structures and their relationship to nonstoichiometric Sb2Te3−ySey compounds. Acta Cryst. B 30, 1307 (1974). [Google Scholar]
- Carey J. J., Allen J. P., Scanlon D. O. & Watson G. W. The electronic structure of the antimony chalcogenide series: Prospects for optolectronic applications. J. Sol. St. Chem. 213, 116 (2014). [Google Scholar]
- Bera A. et al. Sharp Raman anomalies and broken adiabaticity at a pressure induced transition from band to topological insulator in Sb2Se3. Phys. Rev. Lett. 110, 107401 (2013). [DOI] [PubMed] [Google Scholar]
- Liu W. et al. Anisotropic interactions and strain-induced topological phase transition in Sb2Se3 and Bi2Se3. Phys. Rev. B 84, 245105 (2011). [Google Scholar]
- Li W., Wei X.-Y., Zhu J.-X., Ting C. S. & Chen Y. Pressure-induced topological quantum phase transition in Sb2Se3. Phys. Rev. B 89, 035101 (2014). [Google Scholar]
- Manjon F. J. et al. High-pressure studies of topological insulators Bi2Se3, Bi2Te3, and Sb2Te3. Phys. Stat. Sol. 250, 669 (2013). [Google Scholar]
- Kong P. P. et al. Superconductivity in Strong Spin Orbital Coupling Compound Sb2Se3. Sci. Rep. 4, 6679 (2014). [DOI] [PMC free article] [PubMed] [Google Scholar]
- Larson P. Effects of uniaxial and hydrostatic pressure on the valence band maximum in Sb2Te3: An electronic structure study. Phys. Rev. B 74, 205113 (2006). [Google Scholar]
- Bleskov I. D. et al. Ab initio calculations of elastic properties of Ru1−xNixAl superalloys. Appl. Phys. Lett. 94, 161901 (2009). [Google Scholar]
- Efthimiopoulos I. et al. Sb2Se3 under pressure. Sci. Rep. 3, 2665 (2013). [DOI] [PMC free article] [PubMed] [Google Scholar]
- Sorb Y. A. et al. Pressure-induced electronic topological transition in Sb2S3. J. Phys. Cond. Matt. 28, 15602 (2016). [DOI] [PubMed] [Google Scholar]
- Lundegaard L. F., Miletich R., Balic-Zunic T. & Makovicky E. Equation of state and crystal structure of Sb2S3 between 0 and 10 GPa. Phys Chem Miner. 30, 463 (2003). [Google Scholar]
- Zhao J. et al. Pressure-Induced Disordered Substitution Alloy in Sb2Te3. Inorg. Chem. 50, 11291 (2011). [DOI] [PubMed] [Google Scholar]
- Zhu L. et al. Substitutional Alloy of Bi and Te at High Pressure. Phys. Rev. Lett. 106, 145501 (2011). [DOI] [PubMed] [Google Scholar]
- Yu Z. et al. Structural phase transitions in Bi2Se3 under high pressure. Sci. Rep. 5, 15939 (2015). [DOI] [PMC free article] [PubMed] [Google Scholar]
- Liu Y., Chua K. T. E., Sumcde T. C. & Gan C. K. First-principles study of the lattice dynamics of Sb2S3. Phys. Chem. Chem. Phys. 16, 345 (2014). [DOI] [PubMed] [Google Scholar]
- Kharbish S., Libowitzky E. & Beran A. Raman spectra of isolated and interconnected pyramidal XS3 groups (X = Sb,Bi) in stibnite, bismuthinite, kermesite, stephanite and bournonite. Eur. J. Miner. 21, 325 (2009). [Google Scholar]
- Sereni P., Musso M., Knoll P., amd K., Schwarz P. B. & Schmidt G. Polarization-Dependent Raman Characterization of Stibnite (Sb2S3). AIP Conf. Proc. 1267, 1131 (2010). [Google Scholar]
- Wang X., Kunc K., Loa I., Schwarz U. & Syassen K. Effect of pressure on the Raman modes of antimony. Phys. Rev. B 74, 134305 (2006). [Google Scholar]
- Haefner W., Olijnyk H. & Wokaun A. High pressure Raman spectra of crystalline sulfur. High Press. Res. 3, 248 (1990). [Google Scholar]
- Rossmanith P., Haefner W., Wokaun A. & Olijnyk H. Phase transitions of sulfur at high pressure: Influence of temperature and pressure environment. High Press. Res. 11, 183 (1993). [Google Scholar]
- Degtyareva O. et al. Vibrational dynamics and stability of the high-pressure chain and ring phases in S and Se. J. Chem. Phys. 126, 84503 (2007). [DOI] [PubMed] [Google Scholar]
- Ma Y. et al. Determinations of the high-pressure crystal structures of Sb2Te3. J. Phys. Cond. Matter 24, 475403 (2012). [DOI] [PubMed] [Google Scholar]
- Degtyareva O., McMahon M. I. & Nelmes R. J. Pressure-induced incommensurate-to-incommensurate phase transition in antimony. Phys. Rev. B 70, 184119 (2004). [Google Scholar]
- Luo H. & Ruoff A. L. X-ray-diffraction study of sulfur to 32 GPa: Amorphization at 25 GPa. Phys. Rev. B 48, 569 (1993). [DOI] [PubMed] [Google Scholar]
- Efthimiopoulos I. et al. High-Pressure Studies of Bi2S3. J. Phys. Chem. A 118, 1713 (2014). [DOI] [PubMed] [Google Scholar]
- Polian A. et al. Two-dimensional pressure-induced electronic topological transition in Bi2Te3. Phys. Rev. B 83, 113106 (2011). [Google Scholar]
- Nakayama A. et al. Structural phase transition in Bi2Te3 under high pressure. High Press. Res. 29, 245 (2009). [Google Scholar]
- Zhu J. et al. Superconductivity in Topological Insulator Sb2Te3 Induced by Pressure. Sci. Rep. 3, 2016 (2013). [DOI] [PMC free article] [PubMed] [Google Scholar]
- Zhang S. J. et al. The comprehensive phase evolution for Bi2Te3 topological compound as function of pressure. J. Appl. Phys. 111, 112630 (2012). [Google Scholar]
- Zhang J. L. et al. Pressure-induced superconductivity in topological parent compound Bi2Te3. PNAS 108, 24 (2011). [DOI] [PMC free article] [PubMed] [Google Scholar]
- Kirshenbaum K. et al. Pressure-Induced Unconventional Superconducting Phase in the Topological Insulator Bi2Se3. Phys. Rev. Lett. 111, 87001 (2013). [DOI] [PubMed] [Google Scholar]
- Kong P. P. et al. Superconductivity of the topological insulator Bi2Se3 at high pressure. J. Phys. Cond. Matt. 25, 362204 (2013). [DOI] [PubMed] [Google Scholar]
- Jacobsen M. K., Sinogeikin S. V., Kumar R. S. & Cornelius A. L. High pressure transport characteristics of Bi2Te3, Sb2Te3, and BiSbTe3. J. Phys. Chem. Sol. 73, 1154 (2012). [Google Scholar]
- Filip M. R., Patrick C. E. & Giustino F. GW quasiparticle band structures of stibnite, antimonselite, bismuthinite, and guanajuatite. Phys. Rev. B 87, 205125 (2013). [Google Scholar]
- Lundegaard L. F., Makovicky E., Boffa-Ballaran T. & Balic-Zunic T. Crystal structure and cation lone electron pair activity of Bi2S3 between 0 and 10 GPa. Phys Chem Miner. 32, 578 (2005). [Google Scholar]
- Kyono A., Kimata M., Matsuhisa M., Miyashita Y. & Okamoto K. Low temperature crystal structrures of stibnite implying orbital overlap of Sb 5s2 inelectronselectrons. Phys. Chem. Miner. 29, 254 (2002). [Google Scholar]
- Carey J. J., Allen J. P., Scanlon D. O. & Watson G. W. The electronic structure of the antimony chalcogenide series: Prospects for optoelectronic applications. J. Solid State Chem. 213, 116–125 (2014). [Google Scholar]
- Zhao Z. et al. Structural transition and amorphization in compressed a-Sb2O3. Phys. Rev. B 91, 184112 (2015). [Google Scholar]
- Sharma S. M. & Sikka S. K. Pressure induced amorphization of materials. Progr. Mater. Sci. 40, 1 (1996). [Google Scholar]
- Einaga M. et al. Pressure-induced phase transition of Bi2Te3 to a bcc structure. Phys. Rev. B 83, 92102 (2011). [Google Scholar]
- Vilaplana R. et al. Structural and vibrational study of Bi2Se3 under high pressure. Phys. Rev. B 84, 184110 (2011). [Google Scholar]
- Liu G. T., Zhu L., Ma Y. M., Lin C. L. & Liu J. Stabilization of 9/10-Fold Structure in Bismuth Selenide at High Pressures. J. Phys. Chem. C 117, 10045 (2013). [Google Scholar]
- Zhao J. et al. High-pressure phase transitions, amorphization, and crystallization behaviors in Bi2Se3. J. Phys. Cond. Matt. 25, 125602 (2013). [DOI] [PubMed] [Google Scholar]
- Mao H. K., Xu J. & Bell P. Calibration of the Ruby Pressure Gauge to 800 kbar Under Quasi-Hydrostatic Conditions. J. Geophys. Res. 91, 4673 (1986). [Google Scholar]
- Makreski P., Petrusevski G., Ugarkovic S. & Jovanovski G. Laser-induced transformation of stibnite (Sb2S3) and other structurally related salts. Vibrat. Spectr. 68, 177 (2013). [Google Scholar]
- Hammersley A. P., Svensson S. O., Hanfland M., Fitch A. N. & Hausermann D. Two-dimensional detector software: From real detector to idealised image or two-theta scan. High Press. Res. 14, 235 (1996). [Google Scholar]
- Toby B. H. EXPGUI, a graphical user interface for GSAS. J. Appl. Crystallogr. 34, 210 (2001). [Google Scholar]
- Zunic T. B. & Vickovic I. IVTON-a program for the calculation of geometrical aspects of crystal structures and some crystal chemical applications. J. Appl. Crystallogr. 29, 305 (1996). [Google Scholar]
- Birch F. Finite Elastic Strain of Cubic Crystals. Phys. Rev. 71, 809 (1947). [Google Scholar]
- Rivers M., Prakapenka V. B., Kubo A., Pullins C. & Jacobsen C. M. H. S. D. The COMPRES/GSECARS gas-loading system for diamond anvil cells at the Advanced Photon Source. High Press. Res. 28, 273 (2008). [Google Scholar]
Associated Data
This section collects any data citations, data availability statements, or supplementary materials included in this article.


