Summary
Previously, we presented the electrolytic inferior vena cava (IVC) model (EIM) during acute venous thrombosis (VT). Here, we present our evaluation of the EIM for chronic VT time points in order to determine whether this model allows for the study of thrombus resolution. C57BU6 mice (n=191) were utilised. In this model a copper-wire, inserted into a 25-gauge needle, is placed in the distal IVC and another subcutaneously. An electrical current (250 µAmp/15 minutes) activates the endothelial cells, inducing thrombogenesis. Ultrasound, thrombus weight (TW), vein wall leukocyte counts, vein wall thickness/fibrosis scoring, thrombus area and soluble P-selectin (sP-sel) were performed at baseline, days 1, 2, 4, 6, 9, 11 and 14, post EIM. A correlation between TW and sP-sel was also determined. A thrombus formed in each mouse undergoing EIM. Blood flow was documented by ultrasound at all time points. IVC thrombus size increased up to day 2 and then decreased over time, as shown by ultrasound, TW, and sP-sel levels. TW and sP-sel showed a strong positive correlation (r=0.48, p<0.0002). Vein wall neutrophils were the most common cell type present in acute VT (up to day 2) with monocytes becoming the most prevalent in chronic VT (from day 6 to day 14). Thrombus resolution was demonstrated by ultrasound, TW and thrombus area. In conclusion, the EIM produces a non-occlusive and consistent IVC thrombus, in the presence of constant blood flow, allowing for the study of VT at both acute and chronic time points. Thrombus resolution was demonstrated by all modalities utilised in this study.
Keywords: Animal model, electrolytic, EIM, thrombus resolution, venous thrombosis
Introduction
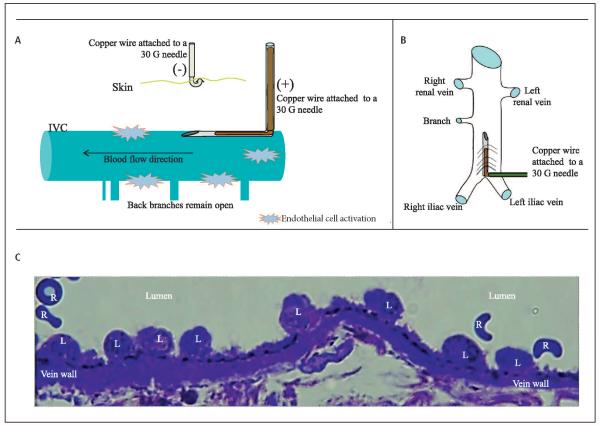
Animal models have been used in research to study thrombus formation, thrombus resolution and to test therapeutic compounds of venous thrombosis (VT) ( 1-8). The inferior vena cava (IVC) ligation, or stasis, model has been used to understand the biology of VT for several years, and is considered a good model that reproduces clinical scenarios of total occlusion (4, 9-12). However, the need for a model that forms thrombus within the IVC under flow conditions motivated investigators to create the IVC stenosis model. The stenosis model is a flow model that solved this issue and has been a great model to study early stages of thrombosis under flow conditions (1, 7, 13). However, investigators in the field expressed two main concerns regarding this model: the inconsistency in thrombus weight (TW) that makes this model difficult to use in order to study chronic VT time points or utilise for drug development and the damage to vein wall due to the micro vascular clamp. These concerns motivated other investigators to explore variations of the original model (13). Thus, we developed the electrolytic IVC model (EIM), a flow model that produces a non-occlusive and consistent IVC thrombus in the presence of preserved blood flow (14, 15). Using the EIM, we have demonstrated preserved IVC endothelium are activated, causing P-selectin expression, which in turn leads to white blood cell attachment and migration into the vein wall (▶Figure 1) with red blood cells and fibrin deposition contributing to the growing thrombus (14). The thrombus shape confirms thrombus formation in the presence of blood flow (14, 15). Initially, chronic time points were not evaluated (14, 15). Here, we present a follow-up study on the EIM in order to determine whether the IVC remains with blood flow from acute through chronic time points, allowing for the study of not only the thrombus formation but also of thrombus resolution.
Figure 1. EIM.
A) Schematic representation of the endothelial activation during EIM (lateral view). B) Schematic representation of the IVC with the needle inserted (anterior view). C) Leukocytes aligned to the endothelial surface minutes after EIM, indicating preserved and activated endothelial cells within the IVC, as we previously described (14, 15). L: leukocyte; R: red blood cell.
Material and methods
Mice and EIM surgical technique
Male (n=195) wild-type (WT) C57BL/6 mice (Charles River Laboratories, Wilmington, MA, USA), weighing 20 to 25 grams, were anesthetised with isoflurane 2%, placed in dorsal recumbency and the IVC was approached directly via a midline laparotomy utilizing aseptic technique (14, 15). Venous side branches were ligated using 7-0 Prolene suture (Ethicon, Inc, Somerville, NJ), while back branches remained patent. In the EIM, a 25-gauge stainless-steel needle, attached to a silver coated copper wire (KY-30-1-GRN, Electrospec, Dover, NJ, USA) is inserted into the exposed caudal IVC (▶Figure 1), and positioned against the anterior wall (anode). Another needle is implanted subcutaneously, completing the circuit (cathode). A current of 250 µAmps over 15 minutes (min) is applied using a Grass S48 square wave stimulator and a constant current unit (Grass Technologies, Astro-Med, Inc., West Warwick, RI, USA). The direct current results in the formation of oxidative products of electrolysis that activates the endothelial surface promoting a thrombogenic environment and subsequent thrombus formation, without heat participation, as described previously (16, 17). In addition, a VT model of IVC stasis was performed only for TW comparisons, as previously described (4, 9, 11). Mice were euthanised at specific time points, post-thrombosis, in order to analyse the TW or histology. True controls (TC), surgically naïve mice, were utilised for baseline histology and molecular assays.
Mice distribution is shown in ▶Table 1. Time points included:1) Image group: Baseline, 1, 2, 4, 6, 9, 11, and 14 days after EIM; 2)Correlation between TW and soluble P-selectin: TC, 1, 2, 4, 6, 9, 11 and 14 days after EIM; 3) Histology group: TC, 1, 2, 4, 6, 9, 11 and 14 days after EIM; 4) EIM vs Stasis model: TC, 2, 6 and 14 days after procedure.
Table 1.
Mice were distributed between four groups of experiments. Image group (ultrasound and venography), Thrombus weight/soluble P-selectin correlation group, Histology group and Stasis model vs. EIM group. US: Ultrasound; ElM: electrolytic IVC model; IVC: inferior vena cava; sPsel: Soluble P-selectin.
| Group | Image group | Correlation group | Histology group | EIM vs Stasis group | ||||
|---|---|---|---|---|---|---|---|---|
| US | Venography | |||||||
| Sample | n=5 | n=5 | IVC and thrombus | Plasma | IVC and thrombus | IVC and thrombus | ||
| Analysis | Thrombus weight | sP-sel | Cell count | Thrombus area | Thrombus weight | |||
| Time points | TC=5; 1D=10; 2D=10; 4D=10 6D=10; 9D=10; 11D=10; 14D=10 |
TC=5; 1D=5; 2D=5; 4D=5; 6D=5; 9D=5; 11D=5; 14D=5 |
TC=5; 2D=10; 6D=10; 14D=10 | |||||
| Mice numbers | n=75 | n=40 | n=35 | n=35 | ||||
| Surgery Type | EIM | EIM | EIM | EIM | Stasis model | |||
Ultrasound protocol
Mice were anesthetised via isoflurane gas inhalation (2%). Warm ultrasound gel and heating pads were used to maintain normal body temperature. IVC images were obtained from the anterior/right side of the mouse abdomen using a Vevo 2100 (Visualsonics, Toronto, ON, Canada) equipped with a linear array MicroScan™ transducer (MS 550D, frequency 22-55 MHz). Duplex ultrasonography and Tissue Doppler Imaging were performed at Baseline (TO) days 1, 2, 4, 6, 9, 11 and 14 after EIM. The ultrasound follow-up was conducted in the same animals during the 14 days, to demonstrate the presence of a blood flow channel in the same mouse population. For IVC sise, clear visualisation of both walls was obtained for accurate measurements. The width of the IVC was measured in at least 9 regions below the level of the renal veins, using three different windows or views in a left 90° angle.
Thrombus weight (TW)
In brief, the IVCs of a specific group of mice were analysed for (wet) TW. At the time of euthanasia, the IVC and the associated thrombus were removed and weighed (grams × 10−4) (4).
Mouse soluble P-selectin (sP-Sel)
Mouse plasma samples were evaluated for sP-sel levels at baseline and days 1, 2, 4, 6, 9, 11, and 14 post-thrombosis. EDTA anti-coagulated blood was processed according to the manufacturer's ELISA kit for sP-Sel (R&D Systems, Minneapolis, MN, USA). All samples were run in duplicate and the results were normalised to total protein using the standard Pierce BCA assay (Thermo Fisher Scientific Inc., Rockford, IL, USA).
Thrombus resolution assessment by ultrasound (in vivo)
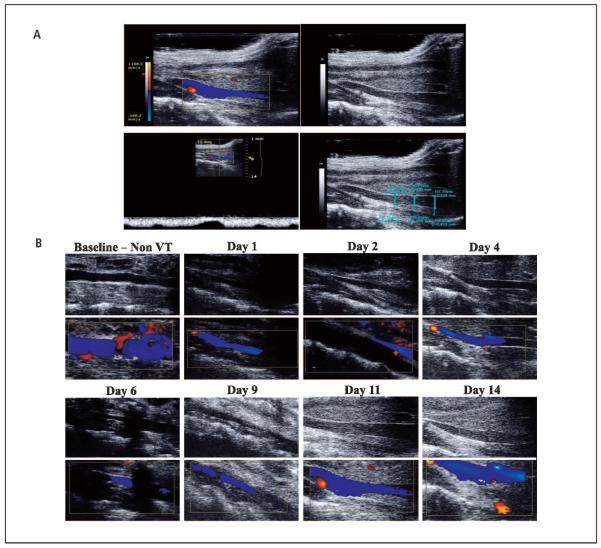
Ultrasound criteria for clinical human evaluations of partial VT were used including: presence or absence of complete mouse IVC compression, presence or absence of flow within the IVC, and the percentage of IVC patency was assessed in at least nine measurements per mouse, per time point (▶Figure 2A).
Figure 2. Ultrasound assessment and follow-up.
A) Representative pictures of the ultrasound assessment. Colour image (Top left) and grey scale image of IVC and thrombus (Top right). The presence of venous blood flow within the IVC was confirmed with the duplex scan (Bottom left). Thrombus / channel areas within the IVC were determined (Bottom right). B) Representative ultrasound sequence pictures at baseline, 1, 2, 4, 6, 9, 11, and 14 days after EIM, in grey scale (upper row) and duplex colour (bottom row), showin g IVC patency over time. VT: venous thrombosis.
Thrombus resolution assessment by area (ex vivo)
The areas of venous thrombi from H&E stained specimens taken from the largest stenosis point, were analysed (200X) using SCION IMAGE Beta 4.0.2 imaging software (Scion Corporation, Frederick, MD, USA). To eliminate variability between mice, each individual animal's aortic wall was measured and used to calculate the thrombus area (square millimeter)/aorta wall (mm) ratio.
Vein wall morphometrics
Mouse IVCs (n=5 per time point) were sectioned from samples 1, 2, 4, 6, 9, 11 and 14 days post thrombosis, stained with hematoxylin and eosin (H&E) and examined under oil immersion light microscopy. An n=5 mice per time point was previously found to be enough to ensure a statistical difference between groups (4). Using lOOX high power oil objective field, representing 0.2 microns across, five representative high-power fields (5 HPFs) were examined around the vein wall for inflammatory cell counts, intimal thickness, and intimal fibrosis. Intimal fibrosis and thickness were assessed using the scoring method displayed in ▶Table 2 (9). Inflammatory cells were identified as neutrophils (NEU) or monocyte/macrophages (MON), on the basis of standard histological criteria, in a blinded fashion by a board-certified veterinary pathologist (9).
Table 2.
Vein wall thickness and fibrosis score.
| Intimal thickness scoring criteria | |
| 0 | Intima appears as just a potential space with space occupied only by endothelial cells. |
| 1 | Very small spaces present between endothelial cells and the internal elastic lamina. Intima still appears generally as thick as the nuclei of normal spindle shaped endothelial cells, |
| 2 | Intima is at least twice as thick as an endothelial nucleus (about same as a red blood cell diameter) at its widest point in the HPF. |
| 3 | Intima is at least five times the thickness of a red blood cell diameter at its widest point in the HPF. Intimal thickness tends to be highly variable and may contain cells other than endothelial cells. |
| 4 | Intima is greatly thickened and contains fibroblasts, white blood cells, and/or hemorrhage at its widest point, |
| Intimal fibrosis scoring criteria | |
| 0 | No fibrosis evident. |
| 1 | Intima contains a small amount of dense eosinophilic or amphiphilic material. Fibroblasts may or may not be evident. |
| 2 | Intima contains fibroblasts and some small dense bundle of eosinophilic or amphiphilic collagenous connective tissue. |
| 3 | Intima contains numerous fibroblasts and is irregularly thickened by large amounts of collagenous connective tissue. This is usually accompanied by white blood cells and/or red blood cells. |
HPF: High-power field (100X).
Contrast venography
Mice were anesthetised via isoflurane inhalation and placed in supine position. Dilation of the lateral tail veins was accomplished with warm water soaked gauge placed on the tail. A 27-gauge butterfly catheter was placed into one of the lateral tail veins and secured with surgical glue. Contrast venography was performed with a BV-300 Fluoroscopy Unit (Philips, Andover, MA, USA). Images of the mice were acquired at baseline, day 2, day 6 and day 14 after EIM, in both supine and lateral positions using intravenous injections of 0.5 ml of non-diluted radiopaque iodide contrast media, Omnipaque (Amersham Health, Princeton, NJ, USA).
Statistical analysis and animal use
Statistical analysis and methods included mean ± standard error of mean. Statistical significance was calculated using Prism 5 (GraphPad Software, Inc., La Jolla, CA, USA) using an unpaired t-test with Welch’s correction. Significance was defined as p ≤0.05. Direct comparisons between groups were made for TW, plasma sP-sel, and vein wall morphometrics. A Spearman correlation co-efficient with regression was done to analyse the relationship between TW and plasma sP-sel. Animals were healthy and specific pathogen free. All work was approved by the University of Michigan, University Committee on Use and Care of Animals and was performed in compliance with the Guide for the Care and Use of Laboratory Animals published by the US National Institutes of Health (18).
Results
EIM and non-occlusive thrombus formation
The survival rate in this current study was 100%. It was possible to insert and remove the needle in the IVC of all mice undergoing EIM without any bleeding complications. No complications were observed in relation to the electrical current. A thrombus formed in all mice undergoing EIM (100%). The morphological evaluation of the venous thrombi at days 1, 2, 4, 6, 9, 11 and 14, from all EIM mice in this study, showed that at harvest each thrombus formed a head at the initiation site and a tail that extended to the left renal vein. This shape confirms laminar thrombus formation in the presence of blood flow. All IVC thrombi, harvested at all time points, were located in the area between the junction of the iliac veins and the level of the insertion of the renal veins.
Ultrasound documented non-occlusive thrombosis through day 14 in EIM
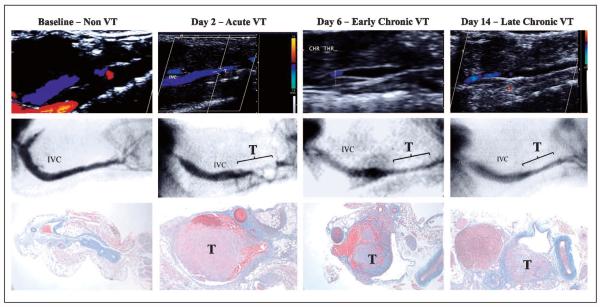
We were able to perform ultrasound at all time points in every mouse, pre- and post-EIM. No complications were observed due to ultrasound scans. The ultrasound and venography studies showed that all of the IVCs in these mice were patent before performing the EIM. On the same group of mice, EIM was performed and blood flow was demonstrated by ultrasound at all time points (▶Figure 2B).
TW, plasma sP-sel and its correlation in EIM
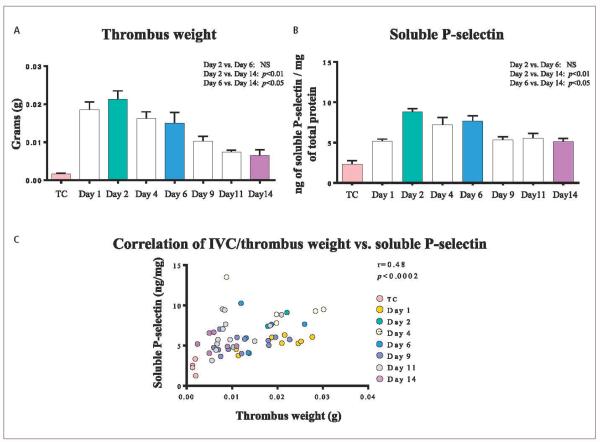
Post-EIM TW increased from day 1 (0.0185 ± 0.0020g) up through day 2, with the latter being the largest (0.0213 ± 0.0022 g). It continued to decrease through days: 4 (0.0162 ± 0.0018), 6(0.0150 ± 0.0028 g), 9 (0.0102 ± 0.0013 g), 11 (0.0074 ± 0.0005 g), with the smallest TW at day 14 (0.0064 ± 0.0015 g). From days 1, 2, 4, 6, 9, 11 and 14 analyses, the EIM consistently generated IVC thrombosis in all mice for this study, which increased up to day 2 and then decreased over time (▶Figure 3A). sP-sel paralleled TW results with the highest level occurring at day 2. Results for sP-sel were: day 1 (5.1 ± 0.27 ng/mg), and the highest at day 2 post-EIM (8.8 ± 0.4 ng/mg), day 4 (7.2 ± 0.9 ng/mg), day 6 (7.6 ± 0.7 ng/mg), day 9 (5.3 ± 0.3 ng/mg), day 11 (5.6 ± 0.5 ng/mg), and was the lowest at day 14 (5.1 ± 0.4 ng/mg). The sP-sel decreased over time (▶Figure 3B). There was a strong positive correlation between TW and plasma sP-sel, at all time points (r=0.48, p<0.0002), in this animal model (▶Figure 3C).
Figure 3. Thrombus weight, soluble P-selectin levels and its correlation.
A) Thrombus weight showing a maximum size at day 2 and a decrease over time. B) The plasma soluble P-selectin shows maximum levels at day 2 and a consistent decrease through day 14. C) Thrombus weight and soluble P-selectin correlation: A strong positive correlation between thrombus weight and soluble P-selectin was observed. TC: true control; NS: non-significant.
Thrombus resolution occurs in EIM
Thrombus resolution documented by ultrasound (in vivo)
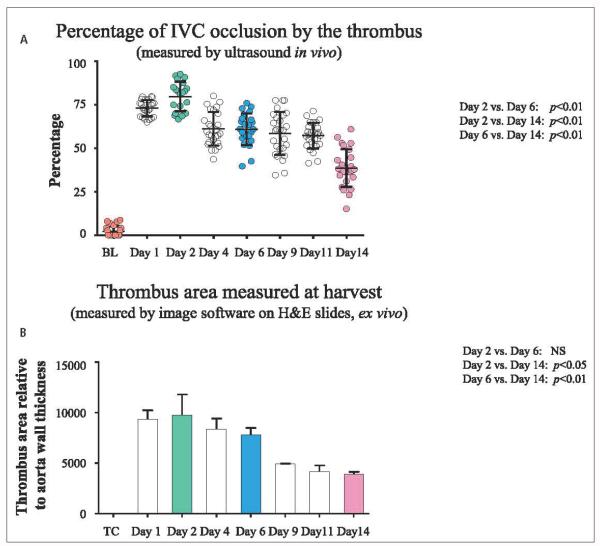
The mean thrombus percentage measured by ultrasound was 72.9 ± 0.4 % at day 1, 77.4 ± 1.3 % at day 2, 61.1 ± 1.9 % at day 4, 62.0 ± 1.3 % at day 6 (significantly decreased compared to day 2, p<0.01), 58.5 ± 2.4 % at day 9, 54.9 ± 2.0 % at day 11, and 39.8 ± 2.3 % at day 14, post-EIM (also significantly decreased compared to day 6, p<0.01) (▶Figure 4A). Overall, the IVC thrombus size gradually increased up to day 2, and then decreased over time.
Figure 4. EIM and thrombus resolution.
A) Percentage of IVC occlusion by the thrombus measured in vivo by ultrasound. B) Thrombus area measured on H&E stained slides. Of note, both measurements showed maximum thrombus size at day 2 and a progressive and consistent thrombus size reduction over time. IVC: inferior vena cava; BL: baseline; TC: true control; H&E: Hematoxylin and eosin. NS: non-significant.
Thrombus area decreased overtime (ex vivo)
The mean thrombus area, taken at the largest stenosis point, was calculated from H&E stained specimens. The mean thrombus areas (normalised to aortic wall), were: day 1 (9323 ± 895), day 2 (9722 ± 2080), day 4 (8353 ± 1065), day 6 (7814 ± 667, significantly decreased compared to day 2, p<0.01), day 9 (4909 ± 39), day 11 (4155 ± 627) and day 14 (3918 ± 233, significantly decreased compared to day 6, p<0.01) (▶Figure 4B). These thrombus area measurements demonstrate thrombus resolution over time.
Acute and chronic venous thrombosis in EIM
Vein wall inflammation
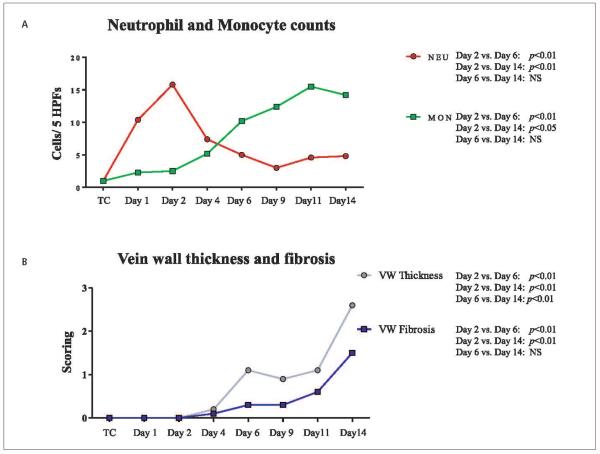
Inflammatory counts of the vein wall showed an acute inflammation characterised by an increased number of neutrophils from baseline to day 1 (1 cell/5HPFs vs 10 cells/5HPFs) and from day 1 to day 2 (10 cells/5HPFs vs 16 cells/5HPFs). The neutrophil count decreased from day 2 through day 9 post-EIM (day 4: 7 cells/5HPFs, day 6: 5 cells/5HPFs and day 9: 3 cells/5HPFs). At days 11 and 14 we found 5 cells/HPFs (▶Figure 5A). A progressive increase in monocytes (MON) was observed over time becoming the most prevalent cells at days 11 and 14, post-EIM, a characterisation of chronic inflammation. The average number of MON was: day 1 (1 cell/5HPF); day 2 (2 cells/5HPFs); day 4 (5 cells/5HPFs); day 6 (10 cells/5HPFs); day 9 (12 cells/5HPFs); day 11 (16 cells/5HPFs); day 14 (14 cells/5HPFs). In addition, a shift of vein wall leukocytes from NEU to MON was observed between days 2 and 6, a documentation demonstrating the progression from acute to chronic inflammation, and acute to chronic VT (▶Figure 5A).
Figure 5. Leukocyte counts, vein wall thickness and fibrosis score.
A) Histology: Inflammatory cell migration into vein wall showing an increase in the number of neutrophils at day 2 (acute inflammation) and a progressive increase in monocytes through day 14. Of note, we documented a shift from neutrophils to monocytes, as the predominant leukocytes, between days 2 and 6. B) Vein wall thickness and fibrosis was assessed at all time points in order to evaluate tissue remodelling. HPFs: high power fields; TC: true control; NEU: neutrophils; MON: monocytes; NS: non-significant; VW: vein wall.
Vein wall thickness and fibrosis
Vein wall thickness was increased between days 2 and 6 (p<0.01), and reached a maximum at day 14 post-EIM (day 6 vs day 14: p<0.01). In addition, vein wall fibrosis also increased between days 2 and 6 (p<0.01), and was the highest at day 14 (day 6 vs day 14: p<0.01) (▶Figure 5B).
TW comparison between ligation model and EIM
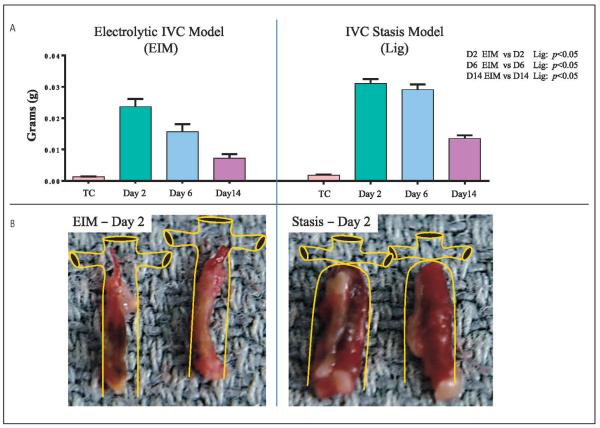
The TW s from both models is at a maximum at day 2 with gradual thrombus size decreasing through days 6 and 14 (▶Figure 6A). The TW s obtained under IVC flow conditions were statistically significantly smaller compared to those documented under nonflow conditions (EIM vs. stasis model). Comparison weights of EIM vs stasis were as follows: 2 days after procedure (0.0236 ± 0.0024 g vs 0.0310 ± 0.0014 g), 6 days after procedure (0.0156 ±0.0024 g vs 0.0291 ± 0.0016 g) and 14 days after procedure (0.0073 ± 0.0012 g vs 0.0135 ± 0.0009g). Representative images of the thrombi shape and size and a schematic of the IVC were drawn to simulate what is observed at harvest in mice for both, EIM and ligation model (▶Figure 6B).
Figure 6. Thrombus weight comparisons between EIM and Stasis model.
A) Thrombus weights from both models showing significantly smaller thrombi in the EIM. B) Representative pictures of the thrombi harvested two days after thrombus induction in both models. IVC: inferior vena cava; EIM: electrolytic IVC model; Lig: ligation.
Contrast venography
Contrast venography was able to be performed at baseline and days 2, 6 and 14 post-EIM. No complications were observed as a result of administration of the contrast agent. Venography studies showed that all of the IVCs in the mice were patent before performing the EIM on this group of mice. Blood flow was demonstrated to be the lowest at day 2, observing blood flow derivation though posterior vein branches. Progressively the main IVC channel increased in size and area, as demonstrated by the diminished collateral derivation at day 6. At day 14, the IVC channel returned to the initial IVC size, demonstrating thrombus resolution (▶Figure 7).
Figure 7. Representative sequence of pictures for ultrasound (upper row), venography (middle row) and histology (lower row) at baseline, day 2, day 6 and day 14 showing.
Of note, day 2 showed the narrowest IVC lumen and the larger thrombus. VT: venous thrombosis; IVC: inferior vena cava.
Discussion
Currently, mouse strains that spontaneously develop VT have not been identified, so novel mouse models of VT are necessary to study the prevalence of VT occurrence (13). The mouse is an extremely powerful in vivo tool for the study of VT (13). We previously reported the electrolytic IVC model in acute thrombosis (up to day 2), which produces endothelial activation, consistent thrombi in the presence of blood flow, stimulates P-sel expression and causes recruitment of vein wall inflammatory cells (14, 15). Here, we wanted to determine whether the IVC remained patent beyond day 2 after surgery, in order to validate the EIM as a model of both thrombus formation and resolution in the presence of blood flow that would allow for the study of VT at chronic time points.
Using ultrasound, we demonstrated IVC patency, in this follow-up study, during acute time points (days 1 and 2 post-EIM), the transition from acute to chronic VT (days 2 to 6 post-EIM), and through the chronic time points (days 6 to day 14 post-EIM) in the same group of mice. The image studies revealed that lumen patency increased progressively over time in the area of maximum stenosis, indirectly demonstrating thrombus resolution. Ultrasound is the most important imaging method currently used to document VT in patients, and recent advancements in ultrasound technology allowed us to study VT in mice. Technically, it is important to mention that the thrombus and IVC were visualised from three different views and a total of nine measurements per mouse were performed in order to maximise accuracy, since the thrombus position within the IVC lumen in a flow model can vary. Contrast venography was considered the gold standard before the ultrasound era, but is now only used in selective cases. We chose this well utilised diagnosis method of VT to corroborate our ultrasound studies results, strengthening this natural history study of thrombus resolution. Although not previously reported as a research tool for the study of VT in the mouse IVC, the combination of ultrasound and venography techniques provided valuable comparison information for a long-term study of thrombus resolution, as demonstrated here.
TW, an indirect measurement of thrombus size, showed a progressive increase from day 1 to day 2 post-EIM with the latter having the largest thrombi. A decreasing TW was observed from day 2 through day 14 post-EIM. In other models, this phenomenon represents normal thrombus resolution. The actual TW correlated with our observations in the ultrasound study. Of note, there were minimum variations between TWs at the same time point, confirming consistent thrombus formation and resolution in the EIM. sP-sel has been recently associated with VT as an important marker in patients diagnosed positive for a VT (19-22), and also in mouse studies using both the stasis model and the EIM at early time points (8, 23). We documented that levels of sP-sel were highest at day 2 post-EIM, with levels decreasing through day 14. Our observation of the same trends in TW and sP-sel lead to the determination of the correlation between TW and sP-sel. A strong positive correlation was observed between TW and sP-sel levels, as noted previously in other mouse models of VT (11), confirming the importance of sP-sel as a valuable biomarker of thrombogenesis and resolution.
We also documented, for the first time, thrombus resolution in mice, in vivo by ultrasound, and ex vivo by measuring the thrombi areas. Thrombi were observed to decrease significantly in size over the time in vivo using ultrasonography (p<0.01). In addition, thrombus area, as measured in the histology samples (H&E of IVC + thrombus) harvested on the same time points as the ultrasound measurements, demonstrated a sequential decrease in thrombus size over time. Thus, thrombus size was confirmed to increase up to day 2 and progressively decrease over time from day 2 through day 14 by three methods: TW, ultrasound, and thrombus area measurements from histology samples. The fact that the maximum values were detected in all three methods at day 2 post-EIM, support the concept that the maximum thrombus burden is at day 2 and constitute a hinge point of the EIM, dividing thrombus formation (up to day 2, the balance between thrombogenesis and fibrinolysis) from thrombus resolution (after day 2, involving tissue remodelling). In animal models of VT, thrombus formation and thrombus resolution are events that have been clearly demonstrated and coincide with our results in EIM. This separation in two phases, acute and chronic, is important to guide investigators interested in the use of this model at various stages of VT. We believe that a general approach to study acute and chronic VT time points should include days 2, 6 and 14 in order to incorporate the full range of information necessary to characterise both thrombogenesis and thrombus resolution.
Inflammation and VT were first linked in 1974 by Stewart et al. (24), and the acute and chronic phase of inflammation have also been demonstrated using animal models of VT in rats and mice (4, 9, 11, 25, 26). Vein wall inflammatory cell counts demonstrated that neutrophil migration into the vein wall occurs from the initiation of VT up to two days after thrombosis, which decreased over time. A progressive increase in monocytes was observed throughout the chronic time points, reaching a maximum by days 11 and 14, post-EIM. Thus, we documented the predominant vein wall inflammatory cell types during acute and chronic processes. A shifting from neutrophils to monocytes was observed between days 2 and 6, establishing in the EIM a transition from acute to chronic inflammation that parallels the transition from acute to chronic VT, a phenomenon also observed in the stasis model (4). This inflammatory component is important in VT models since the inflammatory cells contribute to vein wall and thrombus remodelling post-thrombosis, including thrombus resolution, as demonstrated in animal models of VT in various species (3, 24, 27). The characterisation of the inflammatory cell population as acute, with neutrophils peaking at day 2, and chronic where cell populations shift and monocytes become the main inflammatory cell beyond day 6, support the acute and chronic inflammatory phases. This correlates with the acute and chronic VT phases that were found in this work as determined by TW, ultrasound and thrombus area in the EIM. In addition, vein wall thickness and fibrosis showed a progressive increase over time, having the most at day 14, documenting vein wall remodeling post injury, a process also known to occur in other models of VT (9) and more importantly in patients as well. Together, these data support the fact that the EIM is a model that enables the study of not only acute and chronic VT time points, but also is a valuable tool for the study of the inflammation that accompanies this disease and causes long-term complications.
Finally, the TW natural history in the stasis model has been previously documented, establishing time points for thombogenesis and thrombus resolution in C57BL/6 mice (4). Thus, it was important to determine the TW s from a group of mice in which we characterised the EIM in the same way, in a comparison study, utilising similar acute to chronic time points. Maximum TW s were observed two days after surgery decreasing through day 14 in both models. It was also observed that the thrombi, obtained by EIM, statistically were significantly smaller at each time point, compared to stasis, which should be the case if blood flow is present. In the stasis model, a closed end vessel is created and the IVC lumen expands when the ligature is tied down, causing the vessel wall to stretch, which leads to an increase in lumen area for thrombus to form. In contrast, the EIM forms thrombus in the constant presence of blood flow, and incorporates the elements that constitute the thrombi dynamically, independent of the IVC lumen area, creating smaller thrombi.
The EIM of venous thrombosis has been shown to produce endothelial activation that initiates consistent venous thrombus formation in the presence of blood flow. This animal model also preserves endothelial cells, leading to expression of P-selectin and the recruitment of inflammatory cells immediately after EIM, except for the area of the needle entry point. It could be argued that this focal vein wall injury to the IVC by the needle is enough damage to trigger thrombosis (▶Figure 8). However, sham operations that involve needle insertion into the IVC for 15 min, without current administration, needle removal and harvest at day 2 later demonstrated no thrombus formation. Histology samples of the vein lumen area, in the sham operations harvested at day 2 post-EIM and the non-VT or TC, have no thrombi. This demonstrates that the activation of the endothelial cells by the internal oxidative electrolysis in this model is mandatory for thrombosis to be initiated. This has also been previously demonstrated in other mouse strains, such as PAI-1 null mice and hypercoagulable Delta Cytoplasmic Tail mice (14, 15).
Figure 8. Middle column shows representative pictures of the inferior vena cava from the harvest of a true control (non-VT), 2-day post sham operation and day 2 post-EIM.
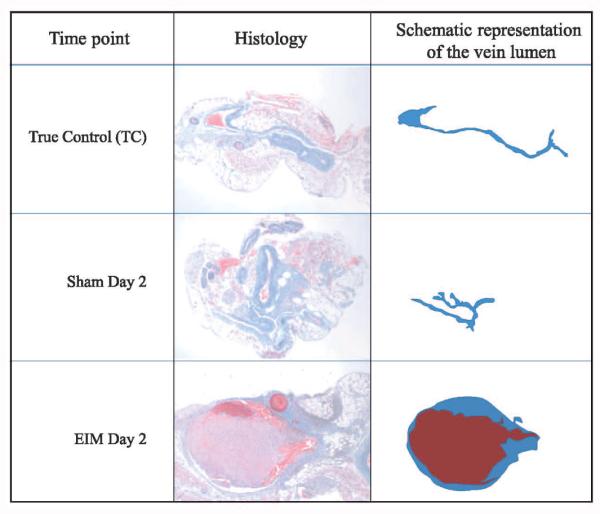
Right column shows the graphic of each vein lumen taken from the middle column. True control represents a naÏve mouse, sham operation included a needle inserted into IVC, no electric current initiated and needle removed 15 min after insertion. EIM represents the full procedure. Of note, no thrombus was formed in sham mice, documenting that the needle insertion alone does not trigger VT.
The EIM provides consistent venous thrombi size while maintaining a flow channel within the mouse IVC during acute and chronic VT, providing an accurate in vivo model to evaluate new compounds for VT treatment and prophylaxis. The physiological importance of this concept was demonstrated in our previous publication for acute thrombosis, comparing therapeutic results in the EIM vs a total occlusion thrombosis model. Mice given low-molecular-weight heparin (LMWH), and undergoing EIM, showed a 61% decrease in thrombus size, compared to a 37.1% decrease in the complete occlusion thrombosis model also given LMWH (14). This indicates that direct access of a therapeutic agent to the entire thrombus, and normal blood flow patterns, are important to promote thrombus resolution. These data supports the advantage of using the EIM in investigations evaluating agents for VT, as currently being performed in our laboratory.
We use several mouse models of VT in our laboratory, as supported by our publications. We feel that there is not one single model that provides a better pathophysiological environment to study VT and have recently written a review covering the advantages and disadvantages of all animal VT models available to investigators (13). Currently there are no written guidelines from an international committee, made up of experts in the field of VT animal models, whose commission should be to evaluate all available VT animal models in order to determine a consensus of the appropriate application of each (28). This has been addressed in a formal manner, but as of this time, nothing has yet been resolved (28). Thus, choosing the right model for our research has to be based on what scientific question needs to be addressed and a vast understanding of the models available to answer it. The EIM was developed to fulfill a need in the field of VT (14, 15) and we have documented that it fills the gap in the study of VT and treatments of this disease.
In summary, the EIM in mice is a novel model option for studying biological changes during venous thrombogenesis and thrombus resolution. The EIM primarily activates the endothelial layer of the IVC resulting in an accumulation of platelets and leukocytes on the endothelial surface creating partial blood stasis, two components of Virchow’s triad, in order to generate VT (14). The EIM simulates clinical situations of partial occlusion and is ideal to study venous endothelial cell activation, leukocyte migration, venous thrombogenesis, thrombus resolution and therapeutic applications. The EIM is technically simple, produces consistent thrombi sizes at both acute and chronic time points and allows a large sample (i.e. thrombus and vein wall) for analytical purposes. This animal model of venous thrombosis meets the criteria established by The National Research Council (NRC) (29).
What is known about this topic?
-
An ideal deep venous thrombosis (DVT) mouse model should fulfill the following criteria:
– 1) the target vein would provide a decent amount of tissue sample in order to run the assays, reducing the amount of animals per experiments;
– 2) the model would consistently generate a thrombus within the IVC in the presence of blood flow;
– 3) the investigators could have the chance to study thrombus generation and thrombus resolution.
A mouse model that produces consistent thrombus under demonstrated blood flow conditions is needed to study thrombus formation and thrombus resolution in the vein system.
What does this paper add?
In this manuscript the readers will find a DVT model which is able to be used in the study of thrombus formation and resolution in mice. This EIM model gathers the characteristics of several models in one.
This novel model would be ideal to study venous endothelial cell activation, leukocyte migration, thrombogenesis, thrombus resolution and therapeutic applications.
The El M model is technically simple, easily reproducible, produces consistent thrombus sizes under demonstrated constant blood flow and allows a large sample (i.e. thrombus and vein wall), which is required for analytical purposes.
Acknowledgements
We would like to thank Robert E. Sigler, DVM for performing the histopathology evaluation, Nichole K. Baker and Kimber Converso-Baran for the ultrasound images and Daniel A. Lawrence and Benedict R. Lucchesi for their support in this project.
Financial support:
This study was supported by grant NIH 1P01HL089407-01A1 (Lawrence, Pl), Animal Core A, NIH 1 K01 HL080962-01A2 (Myers, Pl).
Abbreviations
- EIM
electrolytic IVC model
- H&E
hematoxylin and eosin stain
- HPFs
high-power fields
- IVC
inferior vena cava
- LMWH
low-molecular-weight heparin
- MON
monocytes
- NEU
neutrophils
- sPsel
soluble P-selectin
- TO
baseline
- TC
true control
- TW
thrombus weight
- VT
venous thrombosis
- WT
wild type
Footnotes
Conflicts of interest
None declared.
References
- 1.Burnand KG, Gaffney PJ, McGuinness CL, et al. The role of the monocyte in the generation and dissolution of arterial and venous thrombi. Cardiovasc Surg. 1998;6:119–125. doi: 10.1016/s0967-2109(97)00162-2. [DOI] [PubMed] [Google Scholar]
- 2.Cooley BC, Szema L, Chen CY, et al. A murine model of deep vein thrombosis: characterisation and validation in transgenic mice. Thromb Haemost. 2005 Sep;94(3):498–503. doi: 10.1160/TH05-03-0170. [DOI] [PubMed] [Google Scholar]
- 3.Henke PK, Varga A, De S, Deatrick CB, et al. Deep vein thrombosis resolution is modulated by monocyte CXCR2-mediated activity in a mouse model. Arterioscler Thromb Vase Biol. 2004;24:1130–1137. doi: 10.1161/01.ATV.0000129537.72553.73. [DOI] [PubMed] [Google Scholar]
- 4.Myers DD, Jr., Farris D, Hawley A, et al. Selectins influence thrombosis in a mouse model of experimental deep venous thrombosis. J Surg Res. 2002;108:212–221. doi: 10.1006/jsre.2002.6552. [DOI] [PubMed] [Google Scholar]
- 5.Myers DD, Jr., Hawley AE, Farris DM, et al. P-selectin and leukocyte microparticles are associated with venous thrombogenesis. J Vase Surg. 2003;38:1075–1089. doi: 10.1016/s0741-5214(03)01033-4. [DOI] [PubMed] [Google Scholar]
- 6.Myers DD, Henke PK, Wakefield TW. Coagulation biology. In: Surgical Research. Academic Press; San Diego: 2001. pp. 989–1000. [Google Scholar]
- 7.Singh I, Smith A, Vanzieleghem B, et al. Antithrombotic effects of controlled inhibition of factor VIII with a partially inhibitory human monoclonal antibody in a murine vena cava thrombosis model. Blood. 2002;99:3235–3240. doi: 10.1182/blood.v99.9.3235. [DOI] [PubMed] [Google Scholar]
- 8.Patterson KA, Zhang X, Wrobleski SK, et al. Rosuvastatin reduced deep vein thrombosis in ApoE gene deleted mice with hyperlipidemia through non-lipid lowering effects. Thromb Res. 2012 doi: 10.1016/j.thromres.2012.12.006. epub ahead of print. [DOI] [PMC free article] [PubMed] [Google Scholar]
- 9.Wojcik BM, Wrobleski SK, Hawley AE, Wakefield TW, Myers DD, Jr., Diaz JA. Interleukin-6: a potential target for post-thrombotic syndrome. Ann Vase Surg. 2011;25:229–239. doi: 10.1016/j.avsg.2010.09.003. [DOI] [PubMed] [Google Scholar]
- 10.Day SM, Reeve JL, Myers DD, et al. Murine thrombosis models. Thromb Haemost. 2004;92:486–494. [PubMed] [Google Scholar]
- 11.Diaz JA, Ballard-Lipka NE, Farris DM, et al. Impaired fibrinolytic system in ApoE gene-deleted mice with hyperlipidemia augments deep vein thrombosis. J Vase Surg. 2012;55:815–822. doi: 10.1016/j.jvs.2011.08.038. [DOI] [PMC free article] [PubMed] [Google Scholar]
- 12.Wrobleski SK, Farris DM, Diaz JA, et al. Mouse Complete Stasis Model of Inferior Vena Cava Thrombosis. J Vis Exp. 2011 doi: 10.3791/2738. Epub ahead of print. [DOI] [PMC free article] [PubMed] [Google Scholar]
- 13.Diaz JA, Obi AT, Myers DD, Jr., et al. Critical review of mouse models of venous thrombosis. Arterioscler Thromb Vase Biol. 2012;32:556–562. doi: 10.1161/ATVBAHA.111.244608. [DOI] [PMC free article] [PubMed] [Google Scholar]
- 14.Diaz JA, Hawley AE, Alvarado CM, et al. Thrombogenesis with continuous blood flow in the inferior vena cava. A novel mouse model. Thromb Haemost. 2010;104:366–375. doi: 10.1160/TH09-09-0672. [DOI] [PMC free article] [PubMed] [Google Scholar]
- 15.Diaz JA, Wrobleski SK, Hawley AE, et al. Electrolytic inferior vena cava model (EIM) of venous thrombosis. JV is Exp. 2011 doi: 10.3791/2737. Epub ahead of print. [DOI] [PMC free article] [PubMed] [Google Scholar]
- 16.Romson JL, Haack DW, Lucchesi BR. Electrical induction of coronary artery thrombosis in the ambulatory canine: a model for in vivo evaluation of antithrombotic agents. Thromb Res. 1980;17:841–853. doi: 10.1016/0049-3848(80)90249-2. [DOI] [PubMed] [Google Scholar]
- 17.Jackson CV, Mickelson JK, Pope TK, et al. 02 free radical-mediated myocardial and vascular dysfunction. Am J Physiol. 1986;251:Hl225–1231. doi: 10.1152/ajpheart.1986.251.6.H1225. [DOI] [PubMed] [Google Scholar]
- 18.Council NR Guide for the Care and Use of Laboratory Animals. 1996:1–125. [Google Scholar]
- 19.Rectenwald JE, Myers DD, Jr., Hawley AE, et al. D-dimer, P-selectin, and microparticles: novel markers to predict deep venous thrombosis. A pilot study. Thromb Haemost. 2005;94:1312–1317. doi: 10.1160/TH05-06-0426. [DOI] [PubMed] [Google Scholar]
- 20.Ramacciotti E, Blackbum S, Hawley AE, et al. Evaluation of soluble P-selectin as a marker for the diagnosis of deep venous thrombosis. Clin Appl Thromb Hemost. 2011;17:425–431. doi: 10.1177/1076029611405032. [DOI] [PMC free article] [PubMed] [Google Scholar]
- 21.Ay C, Kaider A, Kader S, Husslein P, et al. Association of elevated soluble P-selectin levels with fetal loss in women with a history of venous thromboembolism. Thromb Res. 2012;129:725–728. doi: 10.1016/j.thromres.2011.11.032. [DOI] [PubMed] [Google Scholar]
- 22.Ay C, Simanek R, Vormittag R, et al. High plasma levels of soluble P-selectin are predictive of venous thromboembolism in cancer patients: results from the Vienna Cancer and Thrombosis Study (CATS) Blood. 2008;112:2703–2708. doi: 10.1182/blood-2008-02-142422. [DOI] [PubMed] [Google Scholar]
- 23.Culmer DL, Diaz JA, Hawley AE, et al. Circulating and vein wall P-selectin promote venous thrombogenesis during aging in a rodent model. Thromb Res. 2013;131:42–48. doi: 10.1016/j.thromres.2012.10.013. [DOI] [PubMed] [Google Scholar]
- 24.Stewart GJ, Ritchie WG, Lynch PR. Venous endothelial damage produced by massive sticking and emigration ofleukocytes. Am J Pathol. 1974;74:507–532. [PMC free article] [PubMed] [Google Scholar]
- 25.Myers DD, Jr., Rectenwald JE, Bedard PW, et al. Decreased venous thrombosis with an oral inhibitor of P selectin. J Vase Surg. 2005;42:329–336. doi: 10.1016/j.jvs.2005.04.045. [DOI] [PubMed] [Google Scholar]
- 26.Myers DD, Jr., Henke PK, Bedard PW, et al. Treatment with an oral small molecule inhibitor of P selectin (PSI-697) decreases vein wall injury in a rat stenosis model of venous thrombosis. JVasc Surg. 2006;44:625–632. doi: 10.1016/j.jvs.2006.05.021. [DOI] [PubMed] [Google Scholar]
- 27.Henke PK, Mitsuya M, Luke CE, et al. Toll-like receptor 9 signaling is critical for early experimental deep vein thrombosis resolution. Arterioscler Thromb Vase Biol. 2011;31:43–49. doi: 10.1161/ATVBAHA.110.216317. [DOI] [PMC free article] [PubMed] [Google Scholar]
- 28.Diaz JAOA, Myers DD, Jr, Wrobleski SK, et al. Re:Thoughts on murine models of deep vein thrombosis - eLetter - Original article: Critical Review of Mouse Models of Venous Thrombosis. Atheroscl Thromb Vase Biol. 2012;32:556–562. doi: 10.1161/ATVBAHA.111.244608. [DOI] [PMC free article] [PubMed] [Google Scholar]
- 29.Institute for Laboratory Animal Research (US.) Committee on New and Emerging Models in Biomedical and Behavioral Research. Biomedical models and resources : current needs and future opportunities. National Academy Press; Washington, D.C.: 1998. [Google Scholar]


