

Supplemental Digital Content is available in the text.
Keywords: brain oscillations, consciousness, electroencephalography, Magnetoencephalography, neural entrainment, visual awareness
Abstract
Human attention fluctuates across time, and even when stimuli have identical physical characteristics and the task demands are the same, relevant information is sometimes consciously perceived and at other times not. A typical example of this phenomenon is the attentional blink, where participants show a robust deficit in reporting the second of two targets (T2) in a rapid serial visual presentation (RSVP) stream. Previous electroencephalographical (EEG) studies showed that neural correlates of correct T2 report are not limited to the RSVP period, but extend before visual stimulation begins. In particular, reduced oscillatory neural activity in the alpha band (8-12 Hz) before the onset of the RSVP has been linked to lower T2 accuracy. We therefore examined whether auditory rhythmic stimuli presented at a rate of 10 Hz (within the alpha band) could increase oscillatory alpha-band activity and improve T2 performance in the attentional blink time window. Behaviourally, the auditory rhythmic stimulation worked to enhance T2 accuracy. This enhanced perception was associated with increases in the posterior T2-evoked N2 component of the event-related potentials and this effect was observed selectively at lag 3. Frontal and posterior oscillatory alpha-band activity was also enhanced during auditory stimulation in the pre-RSVP period and positively correlated with T2 accuracy. These findings suggest that ongoing fluctuations can be shaped by sensorial events to improve the allocation of attention in time.
Introduction
Human attention fluctuates across time, such that stimuli with identical physical characteristics are sometimes consciously perceived and at other times not 1–3. The attentional blink (AB) is a widely studied phenomenon that shows the limited amount of information that can be consciously accessed at a given time 4. The AB describes a failure to detect the second target (T2) in a rapid serial visual presentation (RSVP) stream, when T2 appears 200–500 ms after the first target (T1). Electroencephalography (EEG) has indicated that ∼250 ms after the presentation of T2, T2-correct trials are associated with event-related potentials (ERPs) that are absent or reduced in T2-incorrect trials. For example, the N2 component is larger for T2-correct trials, likely reflecting attentional resources deployed for T2 processing 5. Furthermore, the P3 component, which represents consolidation in working memory, is suppressed on trials where T2 is incorrect 5,6.
Increasing evidence shows that differences between T2-correct and T2-incorrect trials are evident even before the onset of the RSVP 7–9. Specifically, prestimulus alpha-band oscillatory activity (typically 8–12 Hz) plays a role in determining the conscious detection of T2 7–9. Oscillatory activity within the alpha band is strongly linked to the allocation of attentional resources 10,11. Specifically, when alpha-band activity is low in amplitude, the cortex is more active and attentional allocation is increased (and vice versa) 12–14.
MacLean and Arnell 7 studied alpha activity before the onset of the RSVP and showed that the expectation of the RSVP stream was associated with an overall alpha reduction. However, paradoxically, lower pre-RSVP alpha amplitudes characterized subsequent incorrect T2 report in the AB time window. The authors interpreted this finding in terms of attentional overinvestment, which was reflected by decreased alpha activity in the period preceding the RSVP 15,16. A recent confirmation of these findings has been reported by Petro and Keil 9. In that study, alpha-band activity before target presentation was reduced for T2-incorrect trials. Similar findings were also reported by Pincham and Szűcs 8, who found that activity in frontal areas before the onset of the RSVP predicted the subsequent T2 report.
Here, we argue that it may be possible to prevent alpha reduction before the RSVP through entrainment with auditory rhythmic stimulation. This hypothesis is based on previous studies that showed effective entrainment with rhythmic sensorial stimuli that does not reflect a simple summation of evoked response (17–19; for a review, see Thut et al. 20). We tested this hypothesis in experiment 1 of the present study, where we presented a rhythmic stream of auditory stimuli running at 10 Hz before the RSVP while dense-array EEG was recorded from the scalp. In experiment 2, we conducted an additional behavioural experiment to exclude the possibility that our results were because of a mere temporal synchronization between prestimulus sounds and RSVP items (both running at 10 Hz).
Experiment 1
Methods
Participants
Twelve healthy adult participants (four men, mean age=25.1, age range=19–32, SD=4.1) recruited at the University of Cambridge, UK, took part in the present study as paid volunteers. The study was approved by the Psychology Research Ethics Committee at the University of Cambridge, UK, and conforms to the principles elucidated in the Declaration of Helsinki of 2013.
Stimuli and procedure
Visual stimuli embedded in the RSVP were presented on a CRT monitor (100 Hz), whereas sounds were presented through EEG-compatible ER-1 Insert Earphones at a comfortable volume. All stimuli were created using Presentation software (Neurobehavioral Systems, Inc., Berkley, CA, USA). The details of the stimuli and procedure of the RSVP can be found in Supplementary Methods (Supplemental digital content 1, http://links.lww.com/WNR/A378) and are the same as those used in our previous study 21.
On each trial, a central fixation point (2°×2°) was presented for 2000 ms (Fig. 1a). Two possible pre-RSVP auditory conditions occurred during visual fixation presentation. In the rhythmic condition, a stream of 20 500 Hz sounds, each of 20 ms duration, was presented through the earphones. The first sound was presented simultaneously with fixation onset and the following sounds were presented at a constant interstimulus interval (ISI) of 80 ms, resulting in one sound every 100 ms. In an arrhythmic control condition, 20 500 Hz sounds with a duration of 20 ms were presented through the headphones, but this time with irregular ISIs ranging from 0 to 130 ms. The array of ISIs varied randomly from trial to trial in steps of 10 ms and the mean ISI in the random distribution was 80 ms. In both conditions, the end of the stream of sounds was always concurrent with the end of the fixation presentation and the beginning of the RSVP. Excluding practice, participants experienced 400 trials in total (2 conditions×2 lags×100 repetitions), randomly intermixed and divided into eight blocks.
Fig. 1.
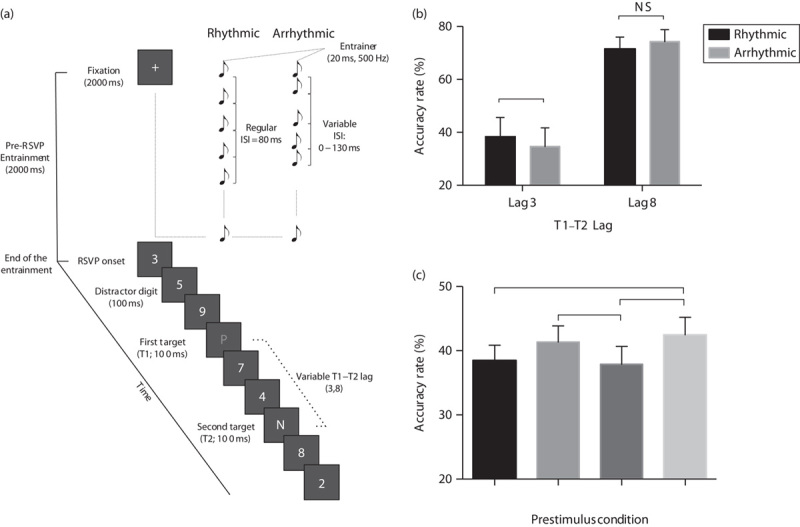
Experimental paradigm and behavioural results. (a) Schematic representation of the attentional blink task used in the EEG experiment. Participants had to report the identity of the two target letters displayed among digit distractors. (b) Behavioural results of the EEG experiment (experiment 1): mean T2|T1 accuracy rate is plotted as a function of T1–T2 lag (3 or 8) and the type of pre-RSVP condition (rhythmic vs. arrhythmic). (c) Results of the experiment 2 testing the results of rhythmic stimulation at other nonalpha frequencies. The mean T2|T1 accuracy rate for the four pre-RSVP rhythmic condition (δ=3 Hz, θ=6 Hz, α=10 Hz, β=25 Hz) averaged across lags. Bars represent SEM and *P<0.05. EEG, electroencephalography; ISI, interstimulus interval; NS, nonsignificant; RSVP, rapid serial visual presentation.
EEG recording and preprocessing
EEG was recorded using the Electrical Geodesics system and a 128-channel HCGSN cap (Electrical Geodesics Inc., Eugene, Oregon, USA). The sampling rate was 500 Hz and input data were analogue-filtered between 0.01 and 100 Hz. Offline, data were downsampled to 250 Hz, notch-filtered at 50 Hz (Parks-McClellan Notch), band-pass filtered between 0.1 and 30 Hz (infinite impute response) and recomputed to an average reference. Data analysis was carried out using EEGLAB (22) running under Matlab.
Data analysis – T2-locked ERPs
All analyses were limited to T1-correct trials. EEG epochs extracted for the analysis ranged between –500 and 1000 ms relative to the onset of T2 (baseline corrected from −500 to −300 ms, i.e. before T1 onset).
Interpolation was carried out on individual bad channels (mean=6.25%). Epochs containing eye movements were discarded. Epochs containing eye-blink artefacts occurring in the vicinity of T1 or T2 were removed. The remaining activity evoked by eye blinks was removed using the independent component analysis. Moreover, epochs containing voltage deviation that exceeded±100 μV were also removed. Overall, 81.7% of trials were retained after artefact rejection.
We examined the T2-evoked N2 and P3 components in the following time windows: 250–350 ms (N2) and 400–700 ms (P3). These time windows were defined on the basis of previous studies 5,9 and by visually examining the ERPs.
We used a robust data-driven approach that enabled us to detect reliable differences between the different experimental conditions by means of nonparametric cluster-corrected permutation tests 23. See Supplementary Method for further details (Supplemental digital content 1, http://links.lww.com/WNR/A378).
Data analysis – pre-RSVP and T2-locked alpha activity
Time–frequency decompositions were performed for all 128 channels in two different time periods: pre-RSVP and T2-locked. Data were first segmented from −2000 to 500 ms relative to RSVP onset and from −500 to 1000 ms relative to T2 onset, and screened for artefacts with the same parameters described above. A complex Morlet wavelet analysis was then carried out on the artefact-free epochs. We used three cycles at the lowest frequency to 15 cycles at the highest frequency. These parameters provide estimates of event-related spectrum perturbation (ERSP) in 100 log-spaced frequencies from 5 up to 30 Hz in a time period ranging from −1666 to 162 ms (baseline=0–162 ms) for the pre-RSVP period and from −168 to 664 ms (baseline=−168 to 0 ms). This enabled us to test the variations of ERSP in the alpha band (8–12 Hz) from −1000 to 0 ms relative to RSVP onset and from 0 to 664 ms relative to T2 onset. Statistical significance of ERSP variations between the rhythmic and the arrhythmic conditions was tested by means of cluster-corrected permutation tests (see above).
Results
Behavioural performance
A condition (rhythmic vs. arrhythmic)×lag (3 vs. 8) analysis of variance on T2|T1 accuracy rate (i.e. T2 accuracy rate for T1-correct trials) indicated a main effect of lag [F(1,11)=52.97, P<0.001], and, importantly, a condition×lag interaction [F(1,11)=7.18, P=0.021; Fig. 1b]. Specifically, rhythmic auditory stimulation improved T2 accuracy at lag 3 [t(11)=2.21, P=0.049]. No significant differences between the rhythmic and arrhythmic conditions emerged at lag 8 [t(11)=−1.68; P=0.121].
T2-locked ERPs (N2 and P3)
N2 (lag 3): Figure 2a shows averaged waveforms and scalp topographies relative to the results of the N2 component. The mean amplitude of the N2 was significantly different in eight right occipitoparietal channels for the rhythmic versus arrhythmic pre-RSVP comparison (more negative mean N2 amplitude for rhythmic trials), but only when T2 was reported correctly. Moreover, we found the same pattern of results in five right occipitoparietal channels for the T2-correct versus T2-incorrect comparison (more negative mean N2 amplitude for T2-correct trials). No other comparisons were statistically significant.
Fig. 2.
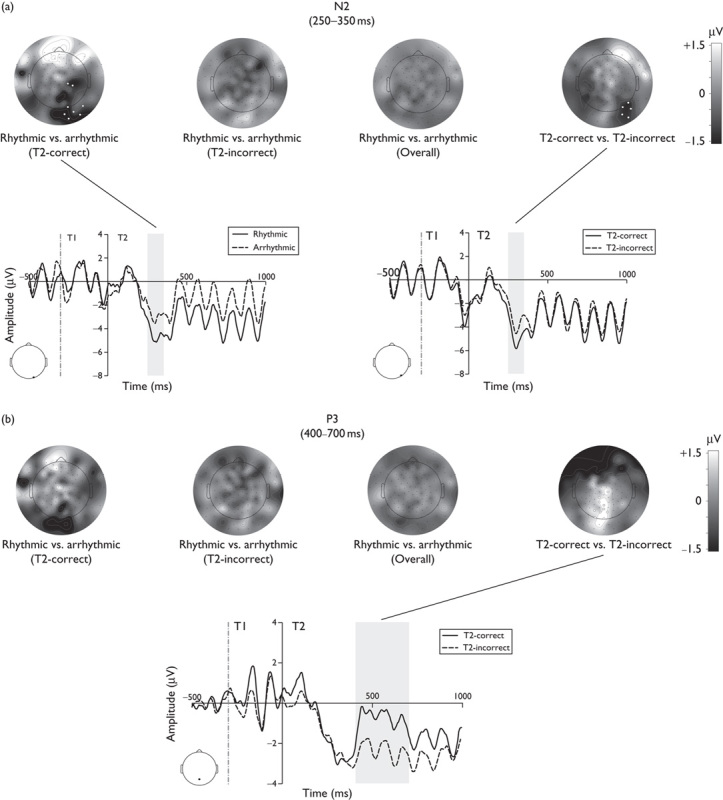
ERP results from experiment 1: N2 and P3 ERP components time-locked to the onset of T2. Scalp topographies for the difference in N2 (a) and P3 (b) between rhythmic and arrhythmic pre-RSVP conditions (divided for T2-correct, T2-incorrect and overall) and for the difference between T2-correct and T2-incorrect trials. Comparisons that were statistically significant (cluster-corrected permutation tests) are plotted with white-marked channels in their topographies and with ERPs waveforms of one representative channel underneath. Data are related to lag 3 trials. The same analyses for lag 8 can be found in Supplementary Fig. 1, Supplemental digital content 1, http://links.lww.com/WNR/A378. ERPs, event-related potentials; RSVP, rapid serial visual presentation.
P3 (lag 3): Figure 2b shows the averaged waveforms and scalp topographies relative to the results of the P3 component. The mean amplitude of the P3 component was significantly different in 10 central occipitoparietal channels for the T2-correct versus the T2-incorrect comparison (more positive mean P3 amplitude for T2-correct trials). No other comparisons were statistically significant.
N2 and P3 ERP results of lag 8 can be found in Supplementary Fig. 1 (Supplemental digital content 1, http://links.lww.com/WNR/A378).
Pre-RSVP and T2-locked alpha activity
Pre-RSVP alpha activity: Figure 3 shows the topographical scalp maps of alpha activity in the pre-RSVP time period. Figure 3a shows variations in alpha power as a function of the pre-RSVP condition in the entire period ranging from −1000 to 0 ms relative to RSVP onset for T2-correct trials. Figure 3b shows alpha activity in the same time period divided into 200 ms temporal bins. As can be seen from the P-value topographical scalp map, differences in alpha activity between the rhythmic and the arrhythmic conditions were observed in frontal as well as posterior electrodes. Specifically, the power of alpha oscillations was relatively higher in the rhythmic condition relative to the arrhythmic condition.
Fig. 3.
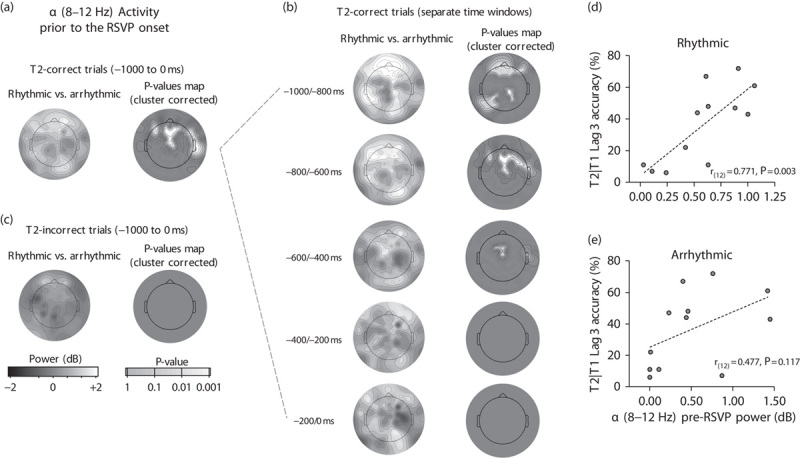
Pre-RSVP alpha activity modulations induced by the rhythmic stimulation and relationship with behavioural performance. (a) Alpha activity variations in power averaged from −1000 to 0 ms relative to the RSVP onset after a rhythmic or an arrhythmic stream for T2-correct trials. (b) Alpha activity for T2-correct trials in the same pre-RSVP time period divided into 200 ms temporal bins. (c) Alpha activity variations in power averaged from −1000 to 0 ms relative to the RSVP onset after rhythmic or arrhythmic stream for T2-incorrect trials. Rhythmic–arrhythmic difference and P-values scalp maps are also plotted. (d, e) Scatterplot showing the positive correlation between T2|T1 accuracy and alpha activity in the 600 ms time period of rhythmic (d) and arrhythmic control stimulation (e) before the RSVP onset (from −1000 to −400 ms; Fig. 3). Individual linear scale values (averaged across all electrodes) of alpha variation relative to the baseline are plotted with a linear regression fitting line. Data are related to lag 3 trials. RSVP, rapid serial visual presentation.
Figure 3c shows the topographical scalp maps of alpha activity for T2-incorrect trials in the period from −1000 to 0 ms relative to RSVP onset. In this case, no significant cluster-corrected difference emerged.
T2-locked: No significant difference held following the correction for multiple comparisons. See Supplementary Results (Supplemental digital content 1, http://links.lww.com/WNR/A378).
Relationship between pre-RSVP alpha activity and behavioural performance
For each participant, alpha activity on T2-correct trials was extracted in the 600 ms time period before the onset of the RSVP stream (from −1000 to −400 ms relative to the RSVP onset, averaged across all channels). In this time window, the rhythmic and arrhythmic conditions differed significantly. Pre-RSVP alpha activity positively correlated with the T2|T1 accuracy rate at lag 3 for trials preceded by the rhythmic pre-RSVP condition [r(12)=0.771, P=0.003; Fig. 3d], but not for trials preceded by the arrhythmic condition [r(12)=0.477, P=0.117; Fig. 3e]. Pre-RSVP alpha activity did not correlate with T2|T1 accuracy at lag 8 trials (both Ps>0.06).
Experiment 2
In experiment 1, we presented auditory and visual stimuli at the same temporal rate. Thus, it is possible that our observed effects were the result of synchronization between rhythmic auditory stimuli in the pre-RSVP period and the subsequent presentation of visual stimuli (rather than the presentation of the auditory stimuli at 10 Hz per se). For this reason, we conducted an additional behavioural experiment by varying the pre-RSVP frequency of the rhythmic stream (3, 6, 10 and 25 Hz).
Two possible scenarios can emerge from this second experiment. If alpha is the only rhythm that alleviates the AB, then our EEG results (experiment 1) must be because of the temporal synchronization between prestimulus sounds and the RSVP items (both running at 10 Hz). However, if rhythmic stimulation at other frequencies also alleviates the AB, this would mean that there are different and nonmutually exclusive ways to influence the allocation of visual attention over time. This would occur by leveraging different properties of brain rhythms, which is in line with evidence showing that neural oscillations in various frequency bands (not only alpha) play a significant role in determining attention 24,25.
Methods
Participants
Twenty-seven healthy adult participants (12 men, mean age=23.2, age range=19–29, SD=3.8) recruited at the University of Padua, Italy, took part in the present study and provided informed consent. The study was approved by the Department of General Psychology of the University of Padua, Italy, and conforms to the principles elucidated in the Declaration of Helsinki of 2013.
Stimuli and procedure
Stimuli and procedure were identical to experiment 1, except for the following details: (a) we additionally measured performance at lag 1; (b) we presented 15 repetitions per condition (180 total trials+five practice trials); (c) only rhythmic auditory stimuli were presented in the pre-RSVP period, with a regular ISI at the following frequencies: (i) δ (six stimuli separated by an ISI of 313 ms, resulting in a frequency of 3 Hz); (ii) θ (12 stimuli separated by an ISI of 146 ms, resulting in a frequency of 6 Hz); (iii) α (same parameters as in the experiment 1, see above); and (iv) β (80 stimuli separated by an ISI of 20 ms, resulting in a frequency of 25 Hz). These frequencies were chosen because they are not subharmonics or harmonics of alpha rhythmic stimuli used here.
Results
A two-way repeated-measures analysis of variance with condition (δ, θ, α and β) and lag (1, 3 and 8) as within-participant factors was performed on T2|T1 accuracy. This indicated the main effects of lag [F(2,52)=17.15, P<0.001, mean±SEM: lag 1=44.6±3.3%, lag 3=30.5±2.9%, lag 8=44.8±2.4%] and condition [F(3,78)=3.45, P=0.021; Fig. 1c]. This last result shows that performance across the lags varied as a function of prestimulus auditory frequency (mean±SEM: δ=38.4±2.4%, θ=41.3±2.5%, α=37.8±2.8%, β=42.4±2.7%). Post-hoc comparisons showed that the mean accuracy was higher for θ compared with α [t(26)=−2.24, P=0.034] and for β compared with both α [t(26)=−2.56, P=0.017] and δ [t(26)=−2.09, P=0.046]. No other comparisons were significant (all Ps>0.11).
Discussion
We examined whether sensorial auditory stimulation leading to changes in prestimulus oscillatory neural activity could induce short-term changes in visual temporal attention.
Our results indicate that during rhythmic auditory stimulation, the typical alpha suppression that usually appears before the onset of the RSVP 7,9 did not emerge. By contrast, alpha activity was enhanced relative to the baseline period and relative to the control (arrhythmic) condition. As enhanced alpha activity is a well-established index of lower cortical activation and reduced readiness for stimulus processing 10–14, our findings suggest that rhythmic stimulation reduces attentional overinvestment by enhancing alpha power.
We suggest that these results are the effect of true entrainment for the following reasons. First, several previous studies showed that stimulation with rhythmic sensorial stimuli reflects true entrainment and not simple steady-state evoked response 17–19. Second, the pre-RSVP alpha difference was specific to T2-correct trials (Fig. 3), and no difference was observed between rhythmic and arrhythmic trials for T2-incorrect trials. This refutes the idea that our alpha modulation simply reflected an auditory-evoked response as a simple evoked response should be evident in both T2-correct and T2-incorrect trials. Finally, differences in alpha activity were not limited to the central-frontal electrodes pool, where an evoked auditory response is expected to emerge, but also extended to posterior electrodes (Fig. 3b).
After the rhythmic stimulation in the pre-RSVP period, T2 accuracy at lag 3 was significantly improved. These results replicate our previous behavioural study, where we found improved T2 detection specific to the AB time window (lag 3) when an auditory, but not a visual, stream of rhythmic stimuli acted to boost performance in the upcoming RSVP 21. In that previous study 21, we also used a pre-RSVP control condition without any auditory stimulation and no differences in the AB window were found between the arrhythmic and the no-sound control conditions, thereby suggesting that the observed reduction in the AB was specific to rhythmic trials 21.
Behavioural improvement in T2 accuracy was associated with a larger T2-evoked N2 component at parieto-occipital electrodes, suggesting that T2 was processed with an increased allocation of attentional resources on rhythmic trials. Moreover, an increased T2-evoked N2 was observed for T2-correct relative to T2-incorrect trials in agreement with previous studies 5. By contrast, the P3 was not modulated by the pre-RSVP condition and only varied as a function of T2 accuracy. These P3 data are therefore consistent with the notion that the P3 reflects updating of the target identity in working memory 5,6. We also found a positive correlation between alpha activity in the pre-RSVP period and behavioural accuracy in reporting T2. This correlation was specific for lag 3 trials preceded by the rhythmic stream of sounds showing relatively increased pre-RSVP alpha activity for T2-correct trials in the AB time window. However, the precise neural mechanisms underlying these findings will require further investigation. One possible hypothesis is that neural oscillations were entrained by auditory rhythmic stimuli and entrainment of auditory regions may have spread to the cortical regions involved in the AB 5.
The design of experiment 1 did not allow us to fully disentangle whether our findings are the consequence of auditory stimulation in the alpha rhythm per se or whether they are because of the fact that both the auditory stimuli and RSVP stream ran at the same frequency. Thus, we conducted an additional behavioural experiment (experiment 2) that tested the effect of prestimulus rhythmic stimulation using auditory stimuli in the pre-RSVP period at alpha and other nonalpha (i.e. δ, θ and β) frequencies. We found that T2 performance could be better enhanced by auditory stimulation at other rhythms (i.e. θ and β). This result confirms that the effect found in experiment 1 was not caused by the mere temporal synchronization between prestimulus auditory and RSVP rhythms. This is consistent with evidence that temporal attention is reliant on multiple neural frequencies (other than alpha) as well as cross-frequency coupling 24,25. Therefore, it appears that there can be different and nonmutually exclusive ways to improve the detection of a relevant target by modifying neural activity through sensorial stimulation in the prestimulus period.
Conclusion
The present study suggests that prestimulus oscillatory fluctuations in the brain may be shaped by sensorial events to improve the precision of temporal attention. These findings are highly novel because they go beyond previous correlative studies of brain oscillations and human attention, and show that rhythmic events may shape intrinsic neural activity in a functionally relevant manner. Future research should continue to explore the functional significance of rhythmic sensorial stimulation, its precise neural mechanisms, as well as the potential training applications for psychiatric and neurodevelopmental disorders, such as schizophrenia, developmental dyslexia, specific language impairment and attention-deficit/hyperactivity disorder, where deficits in neural entrainment have been consistently reported 24.
Supplementary Material
Acknowledgements
This work was supported by a UK Medical Research Council grant G90951 (D.S.).
Conflicts of interest
There are no conflicts of interest.
Footnotes
Supplemental digital content is available for this article. Direct URL citations appear in the printed text and are provided in the HTML and PDF versions of this article on the journal's website (www.neuroreport.com).
References
- 1.Busch NA, VanRullen R. Spontaneous EEG oscillations reveal periodic sampling of visual attention. Proc Natl Acad Sci USA 2010; 107:16048–16053. [DOI] [PMC free article] [PubMed] [Google Scholar]
- 2.Fiebelkorn IC, Saalmann YB, Kastner S. Rhythmic sampling within and between objects despite sustained attention at a cued location. Curr Biol 2013; 23:2553–2558. [DOI] [PMC free article] [PubMed] [Google Scholar]
- 3.Landau AN, Fries P. Attention samples stimuli rhythmically. Curr Biol 2012; 22:1000–1004. [DOI] [PubMed] [Google Scholar]
- 4.Raymond JE, Shapiro KL, Arnell KM. Temporary suppression of visual processing in an RSVP task: an attentional blink. J Exp Psychol Hum Percept Perform 1992; 18:849–860. [DOI] [PubMed] [Google Scholar]
- 5.Sergent C, Baillet S, Dehaene S. Timing of the brain events underlying access to consciousness during the attentional blink. Nat Neurosci 2005; 8:1391–1400. [DOI] [PubMed] [Google Scholar]
- 6.Vogel EK, Luck SJ, Shapiro KL. Electrophysiological evidence for a postperceptual locus of suppression during the attentional blink. J Exp Psychol Hum Percept Perform 1998; 24:1656–1674. [DOI] [PubMed] [Google Scholar]
- 7.MacLean MH, Arnell KM. Greater attentional blink magnitude is associated with higher levels of anticipatory attention as measured by alpha event-related desynchronization (ERD). Brain Res 2011; 1387:99–107. [DOI] [PubMed] [Google Scholar]
- 8.Pincham HL, Szűcs D. Conscious access is linked to ongoing brain state: electrophysiological evidence from the attentional blink. Cereb Cortex 2012; 22:2346–2353. [DOI] [PubMed] [Google Scholar]
- 9.Petro NM, Keil A. Pre-target oscillatory brain activity and the attentional blink. Exp Brain Res 2015; 233:3583–3595. [DOI] [PMC free article] [PubMed] [Google Scholar]
- 10.Klimesch W. Alpha-band oscillations, attention, and controlled access to stored information. Trends Cogn Sci 2012; 16:606–617. [DOI] [PMC free article] [PubMed] [Google Scholar]
- 11.Pfurtscheller G. Functional brain imaging based on ERD/ERS. Vision Res 2001; 41:1257–1260. [DOI] [PubMed] [Google Scholar]
- 12.Foxe JJ, Simpson GV, Ahlfors SP. Parieto-occipital ∼10 Hz activity reflects anticipatory state of visual attention mechanisms. Neuroreport 1998; 9:3929–3933. [DOI] [PubMed] [Google Scholar]
- 13.Handel BF, Haarmeier T, Jensen O. Alpha oscillations correlate with the successful inhibition of unattended stimuli. J Cogn Neurosci 2011; 23:2494–2502. [DOI] [PubMed] [Google Scholar]
- 14.Sauseng P, Klimesch W, Schabus M, Doppelmayr M. Fronto-parietal EEG coherence in theta and upper alpha reflect central executive functions of working memory. Int J Psychophysiol 2005; 57:97–103. [DOI] [PubMed] [Google Scholar]
- 15.Olivers CN, Nieuwenhuis S. The beneficial effect of concurrent task-irrelevant mental activity on temporal attention. Psychol Sci 2005; 16:265–269. [DOI] [PubMed] [Google Scholar]
- 16.Shapiro K, Schmitz F, Martens S, Hommel B, Schnitzler A. Resource sharing in the attentional blink. Neuroreport 2006; 17:163–166. [DOI] [PubMed] [Google Scholar]
- 17.Mathewson KE, Prudhomme C, Fabiani M, Beck DM, Lleras A, Gratton G. Making waves in the stream of consciousness: entraining oscillations in EEG alpha and fluctuations in visual awareness with rhythmic visual stimulation. J Cogn Neurosci 2012; 24:2321–2333. [DOI] [PubMed] [Google Scholar]
- 18.Zhang L, Peng W, Zhang Z, Hu L. Distinct features of auditory steady-state responses as compared to transient event-related potentials. PLoS One 2013; 8:e69164. [DOI] [PMC free article] [PubMed] [Google Scholar]
- 19.Spaak E, de Lange FP, Jensen O. Local entrainment of alpha oscillations by visual stimuli causes cyclic modulation of perception. J Neurosci 2014; 34:3536–3544. [DOI] [PMC free article] [PubMed] [Google Scholar]
- 20.Thut G, Schyns PG, Gross J. Entrainment of perceptually relevant brain oscillations by non-invasive rhythmic stimulation of the human brain. Front Psychol 2011; 2:170. [DOI] [PMC free article] [PubMed] [Google Scholar]
- 21.Ronconi L, Pincham HL, Szűcs D, Facoetti A. Inducing attention not to blink: auditory entrainment improves conscious visual processing. Psychol Res 2015. [Epub ahead of print]. [DOI] [PubMed] [Google Scholar]
- 22.Delorme A, Makeig S. EEGLAB: an open source toolbox for analysis of single-trial EEG dynamics including independent component analysis. J Neurosci Methods 2004; 134:9–21. [DOI] [PubMed] [Google Scholar]
- 23.Maris E, Oostenveld R. Nonparametric statistical testing of EEG- and MEG-data. J Neurosci Methods 2007; 164:177–190. [DOI] [PubMed] [Google Scholar]
- 24.Calderone DJ, Lakatos P, Butler PD, Castellanos FX. Entrainment of neural oscillations as a modifiable substrate of attention. Trends Cogn Sci 2014; 18:300–309. [DOI] [PMC free article] [PubMed] [Google Scholar]
- 25.Clayton MS, Yeung N, Kadosh RC. The roles of cortical oscillations in sustained attention. Trends Cogn Sci 2015; 19:188–195. [DOI] [PubMed] [Google Scholar]
Associated Data
This section collects any data citations, data availability statements, or supplementary materials included in this article.