Abstract
Background:
Tuberculosis (TB) spread pattern is influenced by geographic and social factors. Nowadays Geographic Information System (GIS) is one of the most important epidemiological instrumentation identifying high-risk population groups and geographic areas of TB. The aim of this study was to determine the correlation between climate and geographic distribution of TB in Khuzestan Province using GIS during 2005–2012.
Methods:
Through an ecological study, all 6363 patients with definite diagnosis of TB from 2005 until the end of September 2012 in Khuzestan Province, southern Iran were diagnosed. Data were recorded using TB- Register software. Tuberculosis incidence based on the climate and the average of annual rain was evaluated using GIS. Data were analyzed through SPSS software. Independent t-test, ANOVA, Linear regression, Pearson and Eta correlation coefficient with a significance level of less than 5% were used for the statistical analysis.
Results:
The TB incidence was different in various geographic conditions. The highest mean of TB cumulative incidence rate was observed in extra dry areas (P= 0.017). There was a significant inverse correlation between annual rain rate and TB incidence rate (R= −0.45, P= 0.001). The lowest TB incidence rate (0–100 cases per 100,000) was in areas with the average of annual rain more than 1000 mm (P= 0.003).
Conclusion:
The risk of TB has a strong relationship with climate and the average of annual rain, so that the risk of TB in areas with low annual rainfall and extra dry climate is more than other regions. Services and special cares to high-risk regions of TB are recommended.
Keywords: Annual rain, Climatic processes, Geographic information systems, Tuberculosis
Introduction
Tuberculosis (TB) is the most common cause of death derived from single agent infectious diseases in the world. The global burden of disease in terms of disability adjusted life years (DALY) is in the 10th rank. It is expected that TB remains in this position until 2020 or clime up to 7th rank. More than 90% of TB occurs in developing countries. Approximately 75% of TB in mentioned countries belongs to economically active age group (15–54 yr old) (1).
TB incidence varies in different parts of the world, so that TB incidence in Africa is 365 per 100,000 (2), in London 5 per 100,000 (3), about 21 per 100,000 in Spain, 4.5 per 100,000 in America and the average in the world is 13 cases per 100,000 (4). TB incidence is 23 per 100,000 in Iran (5). According to WHO reports, 9.6 million people are estimated to have fallen ill with TB in 2014: 5.4 million men, 3.2 million women and 1.0 million children. An estimated 1.2 million people live with HIV developed TB in 2014 (6). Most of TB new cases was in Asia (55%) and in Africa (30%) and the lowest TB cases was related to the East Mediterranean region (7%), Europe (4%) and in America (3%) in 2010 (7).
TB based on effective geographic and social factors has a particular pattern. Understanding this pattern is effective to plan TB control and can be useful for health managers (8).
One of the main applications of epidemiology is facilitate the identification of geographic regions and vulnerable groups that are at greater risk of morbidity and mortality of TB. Identification of geographic areas and high-risk groups contribute to selection proper social and health measures in other to reduce risk factors (9). Geographic epidemiology is one part of descriptive epidemiology that evaluates geographic distribution of morbidity and mortality rates (10). One of the most important applications of geographic epidemiology is achievement clues to determine the causes of diseases, injuries and mortality (11). Today Geographical Information System (GIS) emerged and developed to collection, storage, retrieval, optimization, analysis and display geographic information (place) (12). GIS software provide spatial distribution of some diseases such as TB by map, thus it assess causes of disease and can display the quantitative and qualitative spatial distribution of disease. Since not all diseases have genetic and infectious origin and environmental factors can be cause of some diseases, this software could check relationship of some diseases with environmental factors (13).
One of the GIS applications widely used in the world is inform and help to make decision for health care management, incidence and prevalence prevention and to control different diseases such as TB, Malaria and HIV infection (14–16).
Using GIS in management and TB control, we can prevent TB and its prevalence in different geographic regions according to environmental conditions. No study has been conducted using GIS to investigate the spread of TB in Iran so far. This study was performed using GIS for TB distribution assessment in Khuzestan Province with objectives that help health management to make optimal decision and identifying the risk population groups and determination of relationship between environmental conditions and risk factors.
Materials and Methods
Location of study
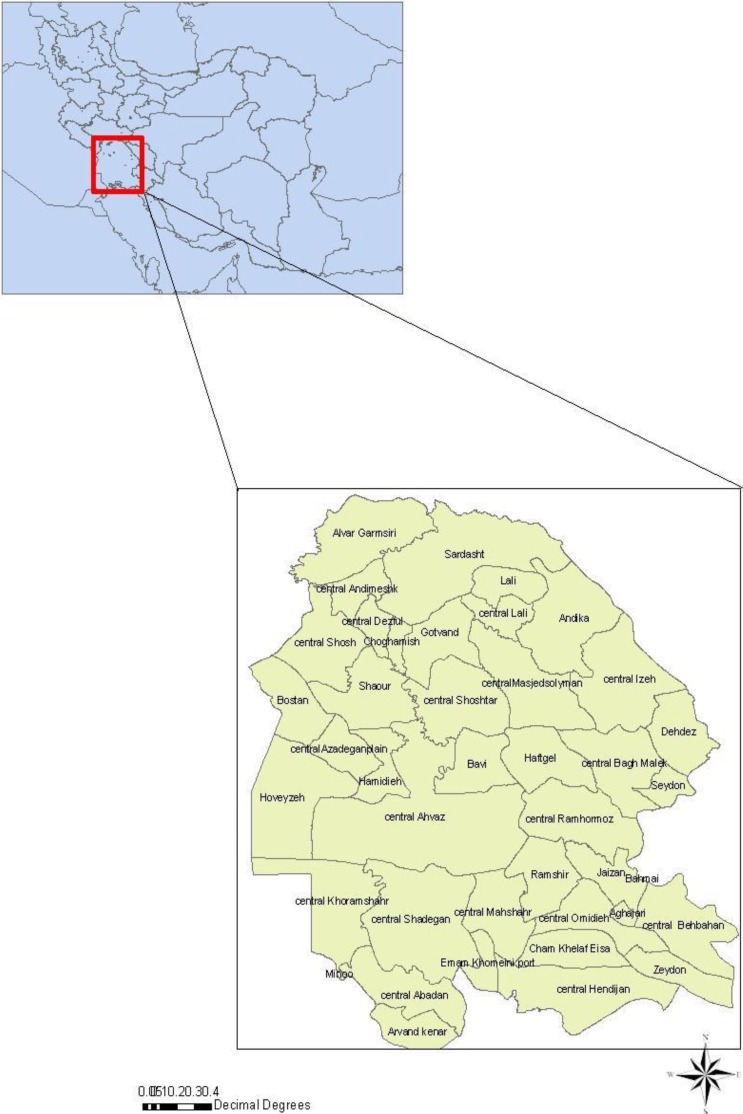
This ecological study in the field of environmental epidemiology was conducted in Khuzestan Province that includes 3.9% of the Iran country total area (64057 km2). The is between 29 ° and 57 min till 33 ° and 0 min latitude north of the equator and 47 ° and 38 min till 50 ° and 32 Mideast of the Greenwich meridian in the South West of Iran country (Fig. 1). According to population and housing census in 2006, the population of Khuzestan Province was 4274979. The province has 20 townships, 47 towns, 41 counties, 126 rural districts, 6199 settlements (17).
Fig. 1:
The location of Khuzestan Province in southwest of Iran
TB information
Statistics and required data (address of resident, year of incidence and age of patients) were gathered from the TB care system of Khuzestan Province. Since the beginning of 2005 until the end of September 2012, the number of 6,363 new patients has been diagnosed with TB in this province. The data were gathered from TB Register software, ver.7 (the software made by Ministry of Health in Iran to record and analysis TB patients’ information).
GIS maps
The GIS maps of Khuzestan Province with scale of 1:1000000 include: political boundaries map (township, county), climate conditions map, The map of 8 years rainfall average and 8 years temperature average, was elicited from Forest and Rangeland and Watershed Management Organization of Iran.
Construction maps of the TB distribution
The number of TB patients was determined based on their lodging. Moreover, resident population of each part of the province was defined according to census of 2006. The 8 yr period cumulative incidence rate according to population in 2006 was calculated for each part. These data were added to descriptive tables of GIS map and distribution map of TB incidence was drawn. Each of the climate and the average of annual rainfall maps were added to the distribution map of TB incidence as a new layer by Arc GIS ver. 9.3, ESRI (Environmental Systems Research Institute, Inc), Dublin, Ireland. The obtained cumulative incidence rates based on environmental parameters were depicted by Arc GIS 9.3 software. To better display the relationship between TB incidence rate and environmental parameters, TB cumulative incidence rate were divided to 4 sub-groups. The first group named low (0–100 cases per 100,000), medium (101–200 cases per 100,000), high (201–300 cases per 100,000) and very high (301–400 per 100,000); the climate conditions were divided to 4 subgroups: Humid and Mediterranean regions, extra dry regions, and Dry and Semiarid regions. The average of annual rain rate was divided into 5 groups: 0–250 mm, 251–500 mm, 501–750 mm, 751–1000 mm, more than 1000 mm.
Data analysis
To data analysis, SPSS ver. 16 (Chicago, IL, USA) was used. Relationship between TB incidence rate in different parts and environmental parameters including climate conditions and the average of annual rain rate was determined by Means plot, Scatter plot, Independent t-test, and one way ANOVA, Pearson and Eta correlation coefficient. The linear regression in significant level 0.2 was used to determine the relationship between quantities variables, which had normal distribution, and normal error distribution such as average annual rain and Tb incidence rate. The TB cumulative incidence rate was calculated with use of the population in 2006.
Results
Totally, 6363 TB patients with the mean age of 39.3 ±18 yr and median age of 35 ±6.5 yr were evaluated. 56.6% (3603) were male with mean age of 38.4±16.6 years and 43.4% (2760) were female with mean age of 40.6±20.3 yr. The mean age of female was 2.1 yr older than male and this difference was statistically significant (P= 0.001).
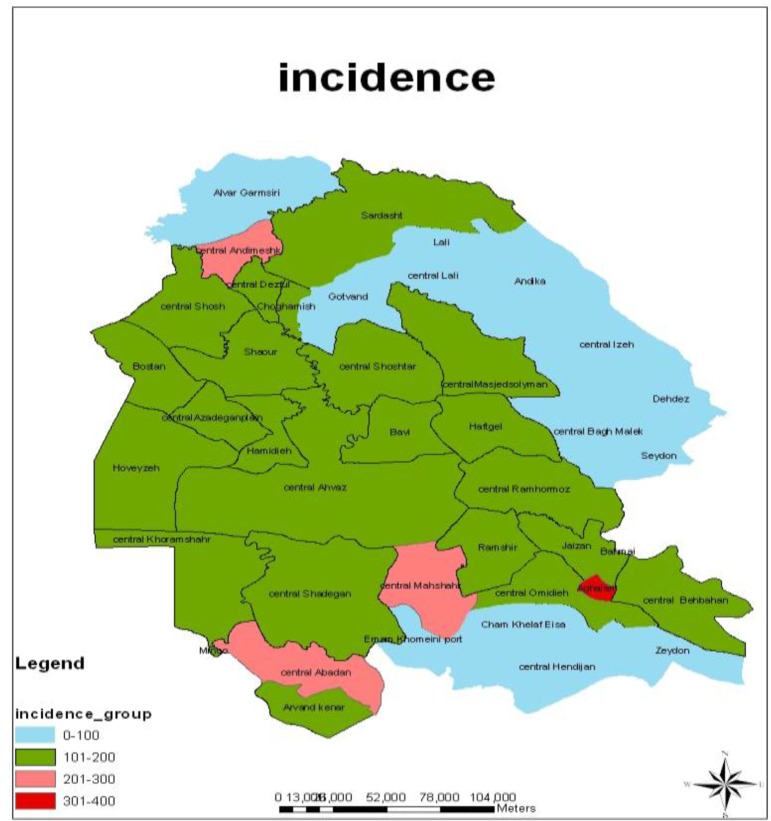
Based on our findings, there was an area with very high TB incidence rate (301–400 cases per 100,000), there were 3 areas with high TB incidence rate (201–300 cases per 100,000) and TB incidence rate in other areas was medium and low (101–200 cases per 100,000 & 0–100 cases per 100,000 people) (Fig. 2).
Fig. 2:
The incidence rate of TB in various regions of Khuzestan Province between 2005–2012 using GIS
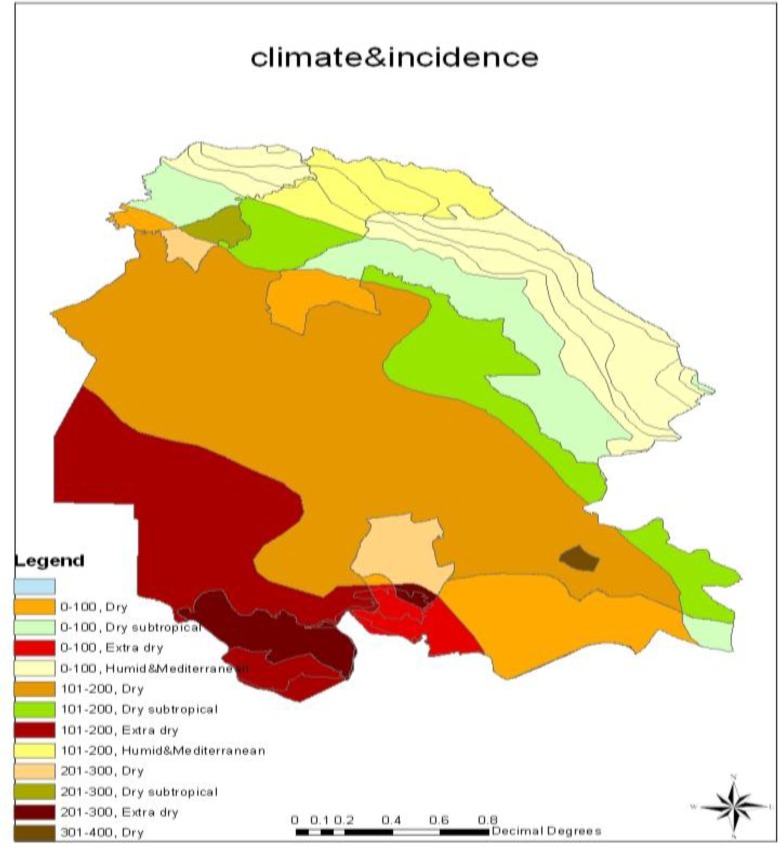
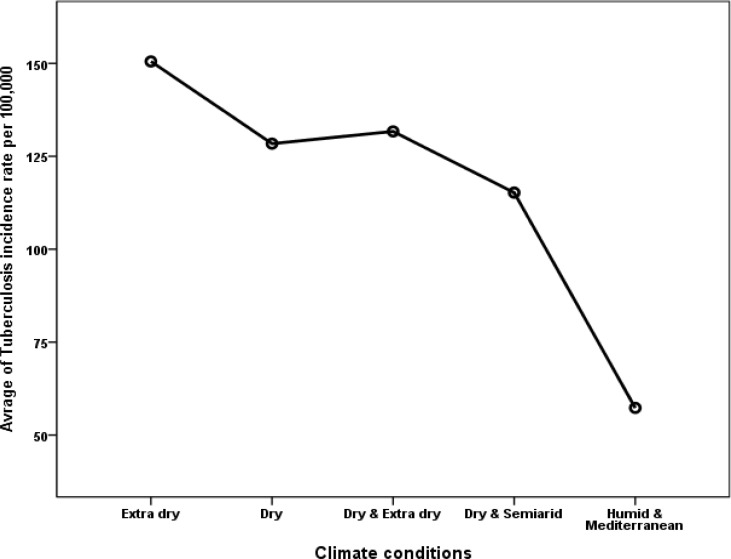
The highest TB incidence rate (301–400 cases per 100,000) was in dry climate conditions and the lowest rate was related to Humid and Mediterranean areas (0–100 cases per 100,000) (Fig. 3). The greatest amount of cumulative incidence during period of study was in extra dry climate conditions (150.51 cases per 100,000) and the least was found in humid and Mediterranean regions (57.3 cases per 100,000). The results revealed a statistically significant relationship between the cumulative incidence rate and the climate conditions (P= 0.017) (Table 1&2) (Fig. 4).
Fig. 3:
TB incidence rate display in various climates between 2005–2012 in Khuzestan Province using GIS
Table 1:
Central measures frequency of TB incidence rate according to the climate conditions in Khuzestan Province between 2005–2012
| Climate conditions | Number of regions | Mean | Standard deviation | 95% CI | Minimum | Maximum | |
|---|---|---|---|---|---|---|---|
| Lower | Higher | ||||||
| Extra Day | 6 | 150.51 | 59.71 | 122.57 | 188.45 | 43.12 | 206.21 |
| Dry | 15 | 128.4 | 94.36 | 93.17 | 163.64 | 0 | 394.6 |
| Dry & extra Dry | 6 | 131.69 | 96.02 | 70.68 | 192.7 | 13.75 | 286.82 |
| Dry & Semiarid | 6 | 115.22 | 65.7 | 73.47 | 156.97 | 39.96 | 231.14 |
| Humid & Mediterranean | 8 | 57.3 | 30.4 | 41.1 | 73.5 | 11.56 | 87.47 |
| Total* | 41 | 116.32 | 81.44 | 98.42 | 134.21 | 0 | 394.6 |
Table 2:
Multiple comparison between the average rates of TB in different climate conditions in Khuzestan Province between 2005–2012
| Climate conditions(I) | Climate conditions(J) | Mean Differences (I-J) | 95% CI | P-value* | |
|---|---|---|---|---|---|
| Lower | Higher | ||||
| Extra Day | Dry | 22.1 | −51.66 | 95.87 | 0.918 |
| Dry &extra Dry | 18.82 | −69.35 | 106.99 | 0.975 | |
| Dry & Semiarid | 35.29 | −52.88 | 123.46 | 0.797 | |
| Humid & Mediterranean | 93.21 | 10. 73 | 175.69 | 0.019 | |
| Dry | extra Day | −22.1 | −95.87 | 51.66 | 0.918 |
| Dry &extra Dry | −3.28 | −77.05 | 70.48 | 1 | |
| Dry & Semiarid | 13.18 | −60.58 | 86.95 | 0.987 | |
| Humid & Mediterranean | 71.1 | 4.24 | 137.96 | 0.031 | |
| Dry &extra Dry | extra Day | −18.82 | −106.99 | 69.35 | 0.975 |
| Dry | 3.28 | −70.48 | 77.05 | 1 | |
| Dry & Semiarid | 16.46 | −71.7 | 104.64 | 0.985 | |
| Humid & Mediterranean | 74.39 | −8.08 | 156.86 | 0.097 | |
| Dry & Semiarid | extra Day | −35.29 | −123.46 | 52.88 | 0.797 |
| Dry | −13.18 | −86.95 | 60.58 | 0.987 | |
| Dry &extra Dry | −16.46 | −104.64 | 71.7 | 0.985 | |
| Humid & Mediterranean | 57.92 | −24.55 | 140.39 | 0.294 | |
| Humid & Mediterranean | extra Day | −93.21 | −175.69 | −10.73 | 0.019 |
| Dry | −71.1 | −137.96 | −4.24 | 0.031 | |
| Dry &extra Dry | −74.39 | −156.86 | 8.08 | 0.097 | |
| Dry & Semiarid | −57.92 | −140.39 | 24.55 | 0.294 | |
ANOVA- Tukey HSD (TB incidence rate & climate conditions)
Fig. 4:
Relationship between average of TB incidence rate and climate conditions in Khuzestan Province between 2005–2012
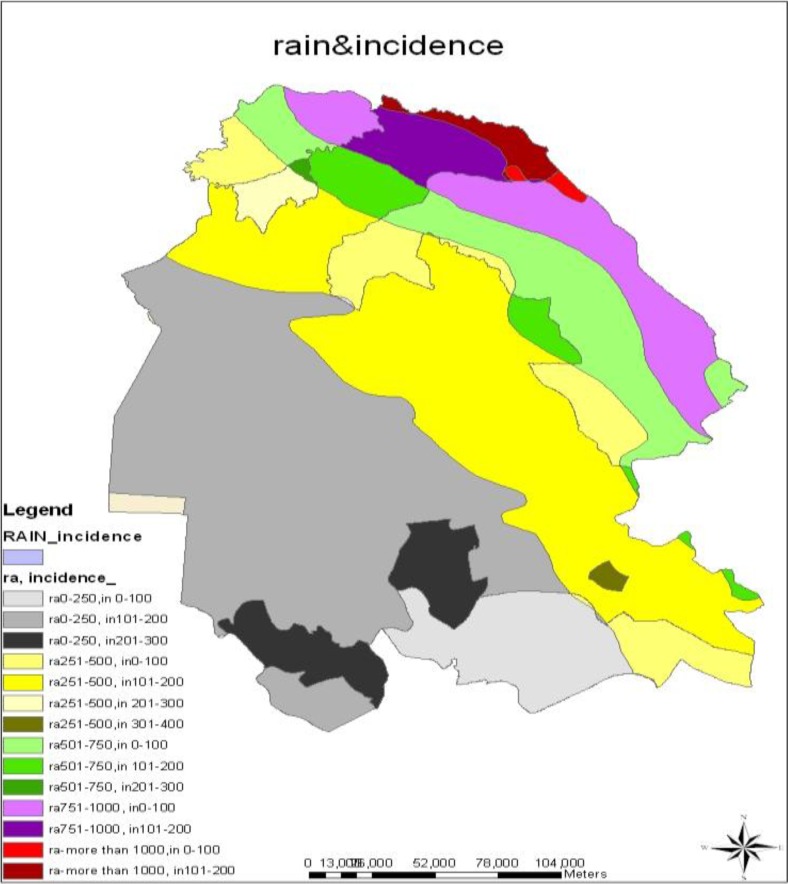
The Eta correlation coefficient was 0.379.The highest TB incidence rate (301–400 cases per 100,000) was found in regions with the annual rain average of 251–500 mm and the lowest TB incidence rate (0–100 cases per 100,000) was related to regions with the annual rain average of more than 1000 mm (Fig. 5).
Fig. 5:
TB incidence rate display according to various rainfall rates in Khuzestan Province between 2005–2012
There was a versus relationship between the annual rain average and the TB cumulative incidence rate by display of Scatter plot, so that when the average of annual rain rate increases the TB cumulative incidence rate decreases (R2=0.209), the correlation coefficient between these two variable was – 0.457 and this result was statistically significant (P= 0.001). The analysis shows that there is a statistically significant relationship between incidence rate of TB and the average of annual rain (P= 0.0001) (Table 3).
Table 3:
Relationship between the average of annual rain and TB incidence rate in Khuzestan Province between 2005–2012
| Variables | Un standardized Coefficients | Standardized Coefficient | 95% CI | P-value* | |
|---|---|---|---|---|---|
| Lower bound | Upper bound | ||||
| TB incidence rate (Dependent variable) | 181.118 | 134.11 | 228.12 | 0.0001 | |
| Average of annual rain (independent variable) | −0.184 | −0.457 | −0.299 | −0.068 | 0.003 |
Linear Regression
Discussion
Based on census of 2011, Khuzestan province is the 5th populated province of Iran (18). Due to various ports existence and high transactions, Arvand Free Zone, numerous oil fields and refineries and the border with Iraq, the province has become to an area with high rate of immigration. It can transmit diseases such as TB infection more effectively. Khuzestan Province is one of the few provinces with diverse climate and environmental conditions. Therefore, we can investigate all environmental parameters affecting the transmission and prevalence of a disease.
No study has been conducted with the aim of TB assessment using GIS in Iran so far, current study is the first study in Iran with mentioned objective. In most studies in other countries, topic of modeling and calculating expected TB cases and comparing with observed cases is considered. A study (19) evaluated the effect of geographic and environmental parameters on TB incidence and speared of it. This study will be the basis for accomplishment of more precise and widespread studies in this field.
In some vector-borne diseases such as malaria, environmental portion is one of the most important determinants for disease transmission. Environmental impact is weak in noncommunicable diseases. Whereas some communicable diseases like TB and HIV, have very strong relation with environmental factors (3). In Chaharmahal and Bakhtiari Province with the aim of locative distribution of Multiple Sclerosis (MS), the range of sectors in province was considered for disease mapping and incidence rate of MS was calculated after adding the number of disease and population of various parts to tables of the map (20) that was in accordance with our study.
The TB incidence rate was different in various regions of the study. The TB cumulative incidence rate was 301–400 per 100,000 people in Aqhajari county in Behbahan township and the central part of Mahshahr, Andimeshk towns and the central part of Abadan had the TB cumulative incidence rate of 201–300 per 100,000. The cumulative incidence rate in central and western parts of the province was medium (101–200 cases per 100,000) and northern & eastern parts of the province had the least rate of cumulative incidence (less than 100 cases per 100,000). In Mexico (6) and Texas State (21), TB incidence rate in urban regions was more than rural areas that is consistent with our results. Since TB is a communicable disease, it seems that respiratory transmission is one of the causes of high incidence in urban region than rural region with high population.
The greatest TB incidence rate was in extra dry regions (150.51 cases per 100,000) and the lowest rate observed in Humid and Mediterranean climates (57.3 cases per 100,000). The cumulative incidence rate in dry, dry & extra dry and semiarid was 128.4, 139.69 and 115.22 cases per 100,000, respectively. This difference was statistically significant (P= 0.017). As mentioned, the incidence rate in dry and extra dry areas with intense sunshine was greater than other Humid and moderate areas and it was statistically significant. The Eta was 0.379 between climate conditions and TB incidence rate. In Birmingham, a significant relation between sunny daytime and the intensity of sunlight and incidence of TB was reported (22), Our results are consist with other studies, likely long-term exposure to sun light and dry air reduce production of mucous fluid and predispose respiratory system to growth Mycobacterium. However, since acid-fast bacilli is sensitive to UV light, it seems that high TB incidence in dry regions with low rainfall is related to other variables specially demographic variables that were not evaluated in this study, thus other studies is required to assess it in different population with different climate.
In concordance with our results, in previous studies, (6, 21), TB spread based on specific spatial patterns and transmission and spread probability of TB in some regions was more than other areas.
Study limitations
Since, it was an ecological study so we cannot generalize foundlings on individuals. The effects of some demographic variables such as age, gender, occupation and socio-economy status on TB incidence are proved; thus conducting wide and other studies with simultaneous considering of environmental parameters and demographic variables in different areas to lighten correlation of environmental parameters and TB incidence precisely is necessary.
Conclusion
TB incidence in Khuzestan has close relationship with environmental conditions specially climate and annual rainfall. Extra dry climate and the annual rainfall less than 250 mm was the most important risk factor of TB. Thus to control of TB in regions with high risk of disease and to identify other risk factors, conducting cohort studies is recommended.
Ethical considerations
Ethical issues (Including plagiarism, informed consent, misconduct, data fabrication and/or falsification, double publication and/or submission, redundancy, etc.) have been completely observed by the authors.
Acknowledgement
The authors declare that there is no conflict of interest.
References
- 1. Beiranvand R, Ghalavandi SH, Delpisheh A, Sayemiri K, Karimi A. (2014). Epidemiological investigation of Tuberculosis in Ilam province during 2005–2012. Sci J Ilam Uni Med Sci, 21( 7): 1–8. [Google Scholar]
- 2. Dye C, Scheele S, Dolin P, Pathania V, Raviglione MC. (1999). Global burden of tuberculosis: estimated incidence, prevalence, and mortality by country: WHO Global Surveillance and Monitoring Project. JAMA, 282: 677–86. [DOI] [PubMed] [Google Scholar]
- 3. Global and regional incidence, Tuberculosis Fact sheet N°104, WHO, March 2006, Retrieved on 6 October 2006. Available from: http://www.who.int/mediacentre/factsheets/fs104/en/index.html.
- 4. Health Protection Agency Epidemiology – Tuberculosis. URL. Available from: http://www.hpa.org.uk/infections/topics_az/tb/epidemiology/table8.htm.
- 5. Jabari Sh. (2007). Statistic department of Markazi health center. Sci J Arak Uni Med Sci: 4– 14. [Google Scholar]
- 6. World Health Organization Global Health Observatory (GHO)DATA. URL. Available form: http://www.who.int/gho/tb/en/.
- 7. Zaragoza Bastida A, Hernández Tellez M, Bustamante Montes LP, Medina Torres I, Jaramillo Paniagua JN, Mendoza Martínez GD, et al. (2012). Spatial and temporal distribution of tuberculosis in the State of Mexico, Mexico. Sci World J: 570278. [DOI] [PMC free article] [PubMed] [Google Scholar]
- 8. Amani F, Boshiri J, Sabzevari A, Garosi B, Nahan moghadam N. (2007). Investigate the epidemiology of tuberculosis in the ardabil city in years 2002–2005. J Ardabil Uni Med Sci, 7( 3): 236–41. [Google Scholar]
- 9. The PanAmerican Health Organization (1996). Use of GIS in epidemiology. Epidemiol Bulletin, 17 ( 1): 1– 7. [Google Scholar]
- 10. Elliott P, Cuzik J, English D, Stern R. (1996). Geographical & environmental epidemiology. first edition England: Oxford Uni Press. [Google Scholar]
- 11. Rezaeian M. (2007). Geographical epidemiology, spatial analysis & geographical information system: a multidisciplinary glossary. J Epidemiol Community Health, 61 ( 2): 98–102. [DOI] [PMC free article] [PubMed] [Google Scholar]
- 12. Arnof A. (1996). Geographical Information Systems Management. First Edition Translate by National Cartographic Center National Cartographic Center printer, pp: 1– 17. [Google Scholar]
- 13. Safe A, Rashidi M, Rouzbahani R, Dehdashti N S, Poursafa P. (2012). Application of GIS in Strategic Medical Research for Disease Prevention. J Isfahan Med School, 29( 164): 1–7. [Google Scholar]
- 14. Hassan AN, Kenawy MA, Kamal H, et al. (2003). GIS-based prediction of malaria risk in Egypt. East Mediterr Health J, 9( 4): 549–58. [PubMed] [Google Scholar]
- 15. Sharma VP, Srivastava A. (1997). Role of geographic information system in malaria control. Indian J Med Res, 106: 198–204. [PubMed] [Google Scholar]
- 16. Tanser FC, Le Sueur D. (2002). The application of geographical information systems to important public health problems in Africa. Int J Health Geogr, 1: 4. [DOI] [PMC free article] [PubMed] [Google Scholar]
- 17. Excerpt of General Population and Housing census results. Statistical Center of Iran; 2006. URL. Available form: http://www.amar.org.ir. [Google Scholar]
- 18. Excerpt of General Population and Housing census results. Statistical Center of Iran; 2011. URL. Available form: http://www.amar.org.ir. [Google Scholar]
- 19. Beiranvand R, Delpisheh A, Solymani S, Sayehmiri K, Weysi K, Ghalavandi SH. (2014). Assessment of Tuberculosis distribution by geographical information system in Khuzestan province: a brief report. Tehran Uni Med J, 72( 6): 417–22. [Google Scholar]
- 20. Raiesi R, Baiati A, Karami J, Sarkaregar-Ardakani A, Katorani Sh, Ramezannezhad P, et al. (2013). Spatial distribution of multiple sclerosis disease in Chaharmahalva Bakhtiari province in 20-year period. J Shahrekord Uni Med Sci, 15( 4): 73–82. [Google Scholar]
- 21. Moonan P K, Bayona M, Quitugua T N, Oppong J, Dunbar D, Kenneth C, et al. (2004). Using GIS technology to identify areas of tuberculosis transmission and incidence. Int J Health Geographics, 3( 23): 27–35. [DOI] [PMC free article] [PubMed] [Google Scholar]
- 22. Gavin K, Hawthorne G, Turner AM, Kunst H, Dedicoat M. (2013). Tuberculosis Incidence Correlates with Sunshine: An Ecological 28-Year Time Series Study. Plos One J, 8( 3): 1–5. [DOI] [PMC free article] [PubMed] [Google Scholar]


