

Abstract
Although the role of ERα in regulating bone metabolism has been extensively studied, ERβ has been largely dismissed as a relevant modulator of bone mass. Previous studies examining ERβ utilized a germline knockout mouse expressing transcript variants of ERβ and displaying systemic hormonal changes that confounded interpretation of the skeletal phenotype. Thus, we used a conditional ERβ mouse model to achieve deletion of ERβ specifically in early osteoprogenitor cells using the Prx1-Cre driver. We observed marked increases in the trabecular bone volume fraction (of 58% [p <0.003] and 93% [p <0.0003] in 6- and 12-week-old female ERβPrx1–CKO mice, respectively) but no changes in cortical bone. Serum estradiol and IGF-I levels were unaltered in ERβPrx1–CKO mice. Bone formation and resorption indices by histomorphometry and serum assays were unchanged in these mice, suggesting that alterations in bone turnover may have occurred early in development. However, the ratio of colony-forming unit-osteoblasts (CFU-OBs) to CFU-fibroblasts (CFU-Fs) was increased in bone marrow cultures from ERβPrx1–CKO compared with control mice, indicating increased differentiation of osteoblast precursor cells into osteoblasts in ERβPrx1–CKO mice. Detailed quantitative polymerase chain reaction analyses of 128 genes in 16 prespecified pathways revealed significant downregulation of 11 pathways in ERβPrx1–CKO mice. Thus, deletion of ERβ specifically in osteoblast lineage cells, in the absence of all splice variants, increases trabecular bone mass and modulates multiple pathways related to bone metabolism. These findings suggest that pharmacological inhibition of ERβ in bone may provide a novel approach to treat osteoporosis.
Keywords: ESTROGEN RECEPTOR, BONE, MICROSTRUCTURE
Introduction
Despite the importance of estrogen in regulating bone metabolism and age-related bone loss, there remain fundamental unanswered questions regarding estrogen action on bone. A more complete understanding of estrogen regulation of bone turnover is important because even though estrogen treatment of postmenopausal women is declining because of well-publicized nonskeletal risks,(1) understanding the underlying mechanisms by which estrogen regulates bone metabolism is likely to identify novel therapeutic targets to prevent or reverse bone loss.
The effects of estrogen on bone and other tissues are mediated by two related but distinct estrogen receptors (ERs), ERα and ERβ. ERα is expressed in both trabecular and cortical bone, whereas ERβ appears to be more highly expressed in trabecular compared with cortical bone.(2,3) Although there has been extensive study of the role of ERα in bone metabolism,(4) the role of ERβ has been largely dismissed as a potential regulator of bone mass. To date, the studies attempting to elucidate the effects of ERβ action in bone have utilized global ERβ knockout (KO) mice.(5–7) However, global deletion of ERβ leads to systemic hormonal changes (eg, increases in serum IGF-I levels)(8) that make it difficult to understand the cell-autonomous effects of ERβ on bone metabolism. In addition, all previous studies of the effects of ERβ deletion on bone used mice that also expressed biologically active ERβ splice variants, which could confound interpretation of the skeletal findings.(9) For example, the previously used ERβKO mice used in studies on bone metabolism(5–7) displayed hypofertility in females and normal fertility in males,(10) whereas both the female and male complete ERβ KO mice are sterile.(9) In addition, these complete ERβ KO mice do not display abnormalities in multiple other tissues (eg, prostate and brain) that were described in the original ERβ KO mice expressing ERβ splice variants.(11–13) Thus, the overall aim of this study was to use recently developed floxed ERβ mice lacking all splice variants upon Cre exposure(9) to specifically delete ERβ in osteoprogenitor cells in order to better understand the role of ERβ in regulating bone metabolism.
Materials and Methods
Key experimental methods and statistical analyses are described below. The Supplemental Methods contains detailed information regarding methods for peripheral quantitative CT analysis, ovariectomy, RNA/DNA isolation and cDNA synthesis, bone histomorphometry, serum assays, ex vivo bone marrow cultures, and transient transfection and luciferase assays.
Generation of mice
Male Prx1-cre mice were crossed with female ERβflox/+ mice. Then male Prx1-Cre//ERβflox/+ mice were crossed with female ERβflox/+ mice to generate the Prx1-Cre//ERβflox/flox (ERβPrx1–CKO) experimental mice. All mice were in the C57BL/6 background for at least seven generations. All mice were housed in ventilated cages with automatic water on a normal 12-hour light/dark cycle and fed Purina Lab Rodent Diet 5001 according to Mayo Institutional Animal Care and Use Committee (IACUC) standards. For these studies, only female mice were used because ERβ demonstrated no regulatory role in males.(5,7) Age-matched, littermate female Prx1-Cre//ERβ+/+ mice were used as control mice in all experiments. Mice were randomized as they became available. At the time of death, the femurs and tibias were removed for further phenotyping and terminal blood draws were obtained, with serum stored at −80°C. Femurs were stored for histomorphometric analysis, while tibias were used for other processing. Marrow from the tibia was flushed for cell culture with the remaining bone, then homogenized in QIAzol (Qiagen, Valencia, CA, USA) using a Tissue Tearor (BioSpec Products, Bartlesville, OK, USA) and frozen at −80°C before RNA and genomic DNA preparation. Other tissues removed included ovary, uterus, liver, and spleen. These tissues were processed similarly to the bone for RNA and genomic DNA preparation. All studies performed were approved by the Mayo Clinic IACUC.
QPCR gene expression analysis
cDNA made from RNAs isolated from tibial metaphyses was used to perform QPCR analyses as previously described.(14–16) All primers used were designed using the Primer Express program (Applied Biosystems, Carlsbad, CA, USA). Primer sequences for any of the genes analyzed in this report are available upon request. Reactions were run on the ABI Prism 7900HT real-time system (Applied Biosystems) using SYBR Green (Qiagen) as the detection method. Input RNA was normalized to account for any variations by using a panel of 10 reference genes (rn18s, b2m, gapdh, hprt, rpl13a, polr2a, tbp, tuba1a, actb, gusb) with the geNorm algorithm (http://medgen.ugent.be/jvdesomp/genorm/) to select the three most stable reference genes.(17,18) In this study, the b2m, actb, and gusb reference genes were used because they exhibited the lowest variability across all the samples. The PCR Miner algorithm was used to correct for variations in amplification efficiencies.(19) For the analyses of the ERβ exon expression in the ERβflox/flox model,(9) we designed primers specific for each exon (1–10) of the mouse ERβ gene and analyzed the expression pattern of each individual exon in a representative ERβPrx1–CKO mouse using identical QPCR methods as described above.
Statistical methods
All data are presented as the mean ± SD, and a value of p ≤ 0.05 was considered statistically significant when comparing ERβPrx1–CKO and control mice. Non-paired, two-tailed t tests were used. To assess if changes in gene expression occurred along a priori defined pathways involved in bone metabolism based on knowledge of cellular signaling, we used the Fisher’s Method,(20) which allows for an analyses of changes in clusters of genes rather than in individual genes. This provides a more robust means to analyze gene expression data and increases the power of detecting changes in genes occurring in prespecified clusters, rather than in isolation.
Results
Bone mass increases with ERβ deletion in osteoprogenitor cells
We generated mice where ERβ was deleted specifically in osteoprogenitor cells using the Prx1-cre model system,(21) whereby ERβ would be removed in early mesenchymal precursor cells in the appendicular skeleton. As shown in Fig. 1, ERβ was efficiently deleted (by >90%) in genomic DNA isolated from ex vivo bone marrow stromal cells (BMSCs) isolated from long bones from ERβPrx1–CKO mice cultured under osteoblast differentiation conditions, but no deletions were observed in other estrogen-responsive tissues, such as the ovary or uterus. Consistent with this, the ERβPrx1–CKO mice did not differ from control mice in terms of body weight, uterine weight, or spleen weight (Supplemental Table S1). In addition, femur length was similar in the two groups (Supplemental Table S1) and no growth plate abnormalities were observed (Supplemental Fig. S1). However, visually there appeared to be an increase in unresorbed/calcified cartilage spicules below the growth plate in the ERβPrx1–CKO mice. This was formally quantified (see Supplementary Methods) and, as shown in Supplemental Table S1, the calcified cartilage spicule/tissue volume was increased in the ERβPrx1–CKO versus control mice, although the difference did not achieve statistical significance. As expected in this osteoblast lineage-specific deletion, serum estradiol and IGF-I levels were unchanged in the ERβPrx1–CKO mice (Supplemental Table S1).
Fig. 1.
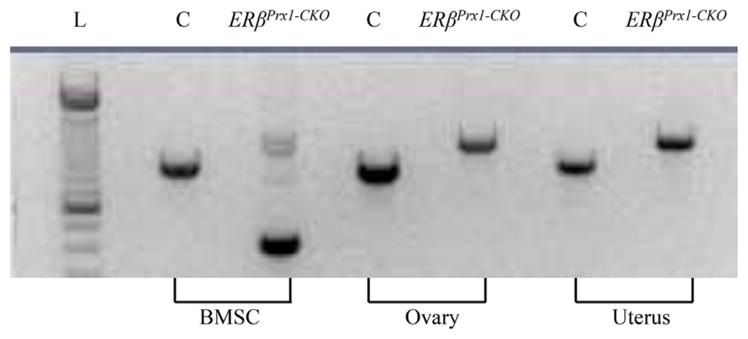
ERβ deletion in osteoprogenitor cells. Genomic DNA was isolated from either ex vivo bone marrow stromal cells (BMSCs) of the long bones of 12-week-old control and ERβPrx1–CKO mice cultured under osteogenic conditions or estrogen-responsive tissues harvested at the time of bone marrow isolation. DNA rearrangement of ERβ exon 3 was determined using primers that span exon 3. L = DNA ladder; C = control.
As shown in Supplemental Fig. S2, ERβ mRNA levels were markedly decreased in RNA isolated from whole tibias (after flushing of bone marrow; Supplemental Fig. S2A) and even more so in ex vivo BMSCs (Supplemental Fig. S2C) from ERβPrx1–CKO mice cultured under osteoblast differentiation conditions compared with control mice. Because Prx1 is not expressed in the axial skeleton, there was no change in ERβ expression in the spine (Supplemental Fig. S2B), as expected. Additionally, there were no significant changes in ERα mRNA levels in either the tibias (Supplemental Fig. S2D), spine (Supplemental Fig. S2E), or ex vivo BMSCs (Supplemental Fig. S2F) from the ERβPrx1–CKO mice.
A recent report by Maneix and colleagues(22) concluded that in an independent ERβ model where exon 3 was deleted, made in a similar manner to the model by Antal and colleagues,(9) an exon 2–4 splicing event can occur that results in a truncated ERβ protein. This would suggest that the ERβ exon 3-deleted model may not represent a complete knockout. This notion is not supported by the data of Antal, which demonstrated that no mRNA species past exon 2 are expressed in their model. To clarify this issue, we examined the expression of each ERβ exon in tibial metaphyses from our ERβPrx1–CKO model to verify the ERβ deletion across the entire gene. As is shown in Supplemental Fig. S3, we observed similarly low levels of expression of each ERβ exon to that of exon 3, in accordance with the Antal data. This demonstrates that this model, which is the model used in this report, represents a complete ERβ gene deletion model, without the presence of any ERβ splice variants.
Micro–computed tomography (μCT) analyses of trabecular bone at the distal femur revealed a 93% increase in trabecular bone volume per tissue volume (BV/TV) in the ERβPrx1–CKO compared with control mice (Fig. 2A, B). This was principally owing to an increase in trabecular number (Tb.N) rather than trabecular thickness (Tb.Th) (Fig. 2C, D). Trabecular spacing (Tb.Sp) was also reduced in the ERβPrx1–CKO compared with control mice (Fig. 2E). By contrast, μCT analyses of the femur diaphysis showed no differences in cortical volumetric bone mineral density (vBMD) or cortical thickness between the ERβPrx1–CKO and control mice (Fig. 3A–C). Thus, deletion of ERβ in female mice resulted in an increase in trabecular, but not cortical, bone mass.
Fig. 2.

Trabecular parameters by μCT analyses in 12-week-old ERβPrx1–CKO mice. (A) Representative reconstructed images of distal femur trabecular bone in 12-week-old control or ERβPrx1–CKO mice. Changes in (B) bone volume to tissue volume (BV/TV), (C) trabecular number (Tb.N), (D) trabecular thickness (Tb.Th), and (E) trabecular separation (Tb.Sp) (n = 16 per group).
Fig. 3.

Cortical parameters by μCT analyses in 12-week-old ERβPrx1–CKO mice. (A) Representative reconstructed image of femur cortical bone (diaphysis) in 12-week-old control or ERβPrx1–CKO mice. Changes in (B) cortical volumetric bone mineral density (Ct.vBMD) and (C) cortical thickness (Ct.Th) (n = 16 per group).
Because Prx1 is only expressed in tissues arising from the limb bud mesenchyme,(21) we also generated mice with specific deletion of ERβ using the rat Col2.3-Cre driver, which is active in early osteoblastic cells(23) and is also active in the axial skeleton (ie, the spine). Similar to the findings in the appendicular skeleton with the ERβPrx1–CKO mice, ERβCol2.3–CKO mice exhibited a significant increase in BV/TV and Tb.Th (Supplemental Fig. S4), in agreement with the data observed in the ERβPrx1–CKO model, indicating that specific loss of ERβ in the axial skeleton also leads in marked increases in bone mass.
Bone histomorphometry
To identify potential cellular mechanisms for the increased trabecular bone mass, we initially analyzed bone histomorphometric variables in the 12-week-old mice (Table 1). Despite the marked increase in trabecular BV/TV at this age, there were no significant differences between ERβPrx1–CKO and control mice for parameters reflecting bone resorption (osteoclast number/bone perimeter [N.Oc/B.Pm], eroded surface [ES]) or bone formation (N.Ob/B.Pm, mineral apposition rate [MAR], bone formation rate, surface referent [BFR/BS], or bone formation rate, volume referent [BFR/BV]). To further evaluate bone turnover, we also measured serum bone formation (PINP) and resorption (CTX) markers in the ERβPrx1–CKO and control mice, but again found no differences in these markers between groups (Supplemental Table S2).
Table 1.
Bone Histomorphometric Variables in the Control and ERβPrx1–CKO Mice at 12 and 6 Weeks of Age
| 12 weeks
|
6 weeks
|
|||||
|---|---|---|---|---|---|---|
| Control | ERβPrx1–CKO | p Value | Control | ERβPrx1–CKO | p Value | |
| N.Ob | 51.0 ± 36.0 | 54.9 ± 30.3 | 0.742 | 84.2 ± 48.3 | 79.9 ± 22.3 | 0.813 |
| N.Ob./B.Pm | 9.3 ± 5.7 | 9.4 ± 4.9 | 0.975 | 16.1 ± 5.1 | 14.4 ± 2.9 | 0.395 |
| Ob.S/BS (%) | 6.2 ± 3.7 | 6.5 ± 3.2 | 0.820 | 9.7 ± 3.1 | 8.7 ± 2.0 | 0.445 |
| O.Th (μm) | 4.5 ± 0.1.1 | 4.3 ± 0.6 | 0.410 | 2.8 ± 0.47 | 2.8 ± 0.66 | 0.961 |
| dLS/BS (%) | 6.6 ± 6.2 | 3.4 ± 3.1 | 0.086 | 14.3 ± 4.1 | 10.1 ± 6.6 | 0.160 |
| MAR (μm/d) | 1.9 ± 1.8 | 1.4 ± 0.6 | 0.330 | 1.8 ± 0.3 | 1.8 ± 0.4 | 0.900 |
| BFR/BS (μm3/μm2/yr) | 0.42 ± 0.34 | 0.31 ± 0.14 | 0.243 | 0.74 ± 0.17 | 0.65 ± 0.16 | 0.326 |
| BFR/BV (%/yr) | 2.9 ± 2.6 | 1.9 ± 0.8 | 0.160 | 5.1 ± 0.7 | 4.7 ± 1.1 | 0.337 |
| N.Oc | 14.0 ± 3.3 | 15.2 ± 5.2 | 0.465 | 101.3 ± 46.6 | 110.9 ± 20.7 | 0.585 |
| N.Oc./B.Pm | 2.7 ± 0.8 | 2.6 ± 0.7 | 0.642 | 20.0 ± 3.5 | 20.3 ± 3.4 | 0.867 |
| ES/BS (%) | 8.1 ± 3.1 | 8.4 ± 1.7 | 0.693 | 41.6 ± 9.0 | 47.7 ± 7.3 | 0.147 |
| N.AD | 54.8 ± 33.4 | 66.5 ± 44.2 | 0.407 | 28.3 ± 13.0 | 27.9 ± 19.7 | 0.965 |
N.Ob. = osteoblast numbers; N.Ob/B.Pm = osteoblast number/bone perimeter; Ob.S/BS = osteoblast surface; O.Th = osteoid thickness; dLS/ BS = double label surface; MAR = mineral apposition rate; BFR/BS = bone formation rate, surface referent; BFR/BV = bone formation rate, volume referent; N.Oc = osteoclast numbers; N.Oc/B.Pm = osteoclast number/bone perimeter; ES = eroded surface; N.Ad = adipocyte numbers.
To address the possibility that changes in bone turnover may have occurred in younger mice, we evaluated these parameters in 6-week-old mice. Importantly, even at 6 weeks of age, ERβPrx1–CKO mice had marked increases in trabecular BV/TV at the distal femur (by 58%, Supplemental Fig. S5A, B), with similar trends for increased Tb.N and Tb.Th (Supplemental Fig. S5C, D) and decreased Tb.Sp (Supplemental Fig. S5E), as was observed in 12-week-old mice. Despite this increase in trabecular BV/TV, cellular and dynamic parameters reflecting bone formation or bone resorption in 6-week-old ERβPrx1–CKO mice were also no different from control mice (Table 1). Thus, at a cellular level, possible alterations in osteoblastic or osteoclastic activity in the ERβPrx1–CKO mice may be occurring even earlier in development than 6 weeks of age. Of note, similar to the 12-week-old mice, femur length was not altered in the 6-week-old ERβPrx1–CKO (13.6 ± 1.0 mm) versus control (13.9 ± 0.5 mm, p = 0.428) mice.
Changes in osteoblast maturation with ERβ deletion in osteoprogenitor cells
We next analyzed possible changes in osteoblast differentiation after ERβ deletion in osteoprogenitor cells in the ERβPrx1–CKO and control mice using assays for CFU-Fs and CFU-OBs. As shown in Fig. 4, CFU-Fs tended to be lower (Fig. 4A) and CFU-OBs tended to be higher (Fig. 4B) in the bone marrow stromal cells from the ERβPrx1–CKO compared with the control mice, but these differences did not reach statistical significance. However, the ratio of CFU-OB/CFU-F, reflecting the proportion of undifferentiated progenitors differentiating into osteoblastic cells, was significantly higher in the ERβPrx1–CKO versus the control mice (Fig. 4C).
Fig. 4.

Changes in CFU-Fs and CFU-OBs with ERβ deletion in osteoprogenitor cells. CFU-Fs and CFU-OBs were assessed in ex vivo bone marrow stromal cell cultures of cells isolated from long bones of 12-week-old control or ERβPrx1–CKO mice. Changes in (A) total colonies (CFU-F), (B) mineralized bone nodules (CFU-OB), and (C) ratio of mineralized bone nodules to total colonies formed (CFU-OB/CFU-F) (n = 4 wells per animal/16 animals per group).
Effect of ovariectomy (Ovx) with ERβ deletion in osteoprogenitor cells
To determine whether loss of ERβ in osteoprogenitor cells alters the skeletal response to ovariectomy, we either ovariectomized or sham-operated a cohort of control or ERβPrx1–CKO mice at 12 weeks of age and examined the phenotype 4 weeks later (16 weeks of age). Ovariectomy resulted in significant loss of total and trabecular density (Supplemental Fig. S6A, B), but not cortical density (Supplemental Fig. S6C), in both control and ERβPrx1–CKO groups to similar extents. This demonstrates that loss of ERβ in osteoprogenitor cells does not alter the skeletal response to ovariectomy.
Changes in gene expression with ERβ deletion in osteoprogenitor cells
To determine the molecular mechanisms associated with the increase in bone mass in the ERβPrx1–CKO mice, detailed gene expression analyses was performed on RNA isolated from tibial metaphyses, as the effect of ERβ deletion was primarily on trabecular bone. For this analysis, we prespecified clusters of genes in selected pathways and tested whether these genes were altered as a group (see Statistical Methods). Table 2 lists the 128 genes evaluated in the 16 prespecified pathways. These genes and pathways were chosen a priori because of their known involvement in bone metabolism. Of these, 11 pathways were significantly downregulated in ERβPrx1–CKO versus control mice (Table 2). These findings demonstrated that deletion of ERβ resulted in modulation of pathways related to bone formation, including autophagy, proliferation, apoptosis, inflammation, adhesion, β-adrenergic targets, oxidative stress, senescence, circadian rhythm, adipogenesis, and Wnt signaling.
Table 2.
Alterations in Prespecified Gene Pathways in the ERβPrx1–CKO Versus Control Micea
| Pathway | Direction of regulation | Genes | p Value |
|---|---|---|---|
| Autophagy | ↓ | atg5 (0.69*), atg7 (0.99), map1lc3a (0.66*), nbr1 (0.87*), | 0.001 |
| Proliferation | ↓ | ccna2 (0.88), ccnb1 (0.76*), ccnb2 (0.91), ccnc (0.81*), ccnd1 (0.66*), ccnd2 (0.92), ccne1 (0.92), e2f1 (0.67*), mki67 (0.77*) | 0.001 |
| Adipogenesis | ↓ | adipoq (0.67*), cebpa (0.75*), cebpb (0.82), cebpd (0.94), cfd (0.50*), lep (0.34*), lpl (0.69*), plin1 (0.48*), pparg (0.83) | 0.004 |
| Senescence | ↓ | bax (0.81), cdkn1a (0.99), cdkn2a (1.15), cdkn2d (0.53*), foxo3 (0.89), igfbp2 (0.97), pten (0.89), rb1 (0.94), sirt1 (0.94), tp53 (0.60*) | 0.009 |
| Circadian rhythm | ↓ | arntl (0.94), clock (0.75*), cry1 (0.89), cry2 (0.70*), csnk1e (0.88), per1 (0.82), per2 (0.94), per3 (0.86) | 0.014 |
| Wnt targets | ↓ | axin2 (1.08), birc5 (0.67*), ccnd1 (0.66), cyr61 (0.83), ephb4 (0.97), fosl1 (1.01), gja1 (0.94), lef1 (1.06), postn (0.70), tcf7 (0.92), tnfrsf11b (0.78), vcan (0.82) | 0.019 |
| β-Adrenergic targets | ↓ | ccnd1 (0.66), ccnd2 (0.92), ccne1 (0.92), cry1 (0.89), cry2 (0.70), myc (0.72*), per1 (0.82) | 0.002 |
| Oxidative stress | ↓ | cat (0.81*), foxo1 (1.00), foxo3 (0.89), foxo4 (0.86), gadd45a (0.72*), sod1 (0.79*), sod2 (0.90), sod3 (0.77) | 0.002 |
| Apoptosis | ↓ | bad (0.88), bax (0.81*), bcl2 (0.82*), bcl2l1 (0.79*), casp3 (0.92), casp8 (0.91), fas (0.85), faslg (0.98) | 0.002 |
| Adhesion | ↓ | alcam (0.80*), cdh2 (0.76*), icam1 (0.74*), vcam1(1.25) | 0.003 |
| Inflammation | ↓ | csf1 (0.87), ifng (0.73), il1a (1.02), il1b (1.30), il6 (0.84), nfkb1 (0.85*), nfkb2 (0.98), nfkbia (1.15), relb (0.95), tnf (0.72*) | 0.043 |
| Osteoblast differentiation | alpl, bgalp, col1a1, col1a2, ibsp, runx2, runx2p1, runx2p2, sp7, sparc, spp1 | 0.060 | |
| Notch | hes1, hey1, heyl, jag1, jag2, notch1, notch 2 | 0.139 | |
| BMP targets | hes1, id1, id2, junb, klf10, lox, smad6, smad7, sox4, zeb1 | 0.188 | |
| Osteocyte | dmp1, fgf23, mepe, pdpn, phex, sost | 0.216 | |
| Stem cell markers | nanog, nes, pou5f1, sox2, tert | 0.426 |
Shown is the list of genes examined in each of the pathways analyzed along with the results of the cluster analyses testing for changes in the genes in each pathway as a group, using the Fisher’s test (see Statistical Analyses). The p values and pathways differing between the 2 groups are highlighted in bold and the numbers in parentheses for the genes in the significant pathways indicate fold changes in the ERβPrx1–CKO relative to the control mice. Asterisks represent p <0.05 for that gene.
Because previous studies have indicated that estrogen may alter expression of several key mediators of bone metabolism, including tnfrsf11b (OPG),(24) tnfsf11 (RANKL),(25) sost,(15) and sclerostin domain-containing 1 (sostdc1),(26) we specifically examined possible changes in these genes in the ERβPrx1–CKO versus control mice. Tnfrsf11b and sost were part of the 128 genes analyzed in Table 2, and neither was significantly altered in the ERβPrx1–CKO mice. Expression of tnfsf11 and sostdc1 was also no different in the ERβPrx1–CKO versus control mice.
Effect of ERβ ablation on ERα-specific activity in MC3T3-E1 osteoblastic cells
Because our data clearly demonstrate that loss of ERβ in osteoprogenitor cells using the Prx1-Cre driver leads to increases in bone mass, one attractive hypothesis to explain the mechanism is that ERα activity may be enhanced after the loss of ERβ. This is consistent with reports in the literature, from our laboratory and others, that ERβ acts as a natural antagonist to ERα through heterodimerization.(27–29) To further address this hypothesis, we used siRNAs to suppress ERβ in MC3T3-E1 osteoblastic cells, which express both ERα and ERβ (data not shown), and examined ERα-specific activation of an estrogen response element (ERE)-luciferase construct using the ERα-selective agonist PPT.(30) The ERβ siRNA resulted in a 52% decrease in ERβ transcripts compared with the negative control siRNA (Fig. 5A). Interestingly, whereas PPT treatment only resulted in a 1.3-fold activation of the ERE reporter with the negative control siRNA, a 2.5-fold increase in ERE activation was observed when ERβ was suppressed with the ERβ-specific siRNA (Fig. 5B). This clearly demonstrates that suppression of ERβ in osteoblastic cells enhances ERα-specific transcriptional activation and is entirely consistent with the known literature.(27–29)
Fig. 5.

ERβ knockdown enhances ERα-specific transcriptional activity. MC3T3-E1 cells were cotransfected with either a negative control or ERβ-specific siRNA and an ERE-luciferase reporter construct. (A) QPCR analyses of ERβ expression in both the negative control and ERβ-specific siRNA-transfected cells to account for knockdown efficiency (n = 3). The asterisk represents p <0.01 compared with the negative control siRNA. (B) A parallel set of identically transfected cells were treated with either vehicle control or the ERα-specific agonist PPT (10 nM). Twenty-four hours later, the cells were harvested and luciferase and protein assays were performed. The data are expressed as luciferase activity/μg protein, graphed relative to the vehicle control condition for each siRNA and represent mean ± SD (n = 6). A single asterisk (*) represents p <0.01 compared with the vehicle control for each siRNA condition. A double asterisk (**) represents p <0.01 comparing the PPT-treated cells between the negative control and ERβ-specific siRNA conditions.
Discussion
Our studies reveal that ERβ deletion in osteoblast lineage cells, in the absence of all splice variants,(9) leads to an increase in trabecular bone mass with no significant changes in cortical bone. This is demonstrated by the marked increases in trabecular BV/TV at both 6 and 12 weeks of age in ERβPrx1–CKO compared with control mice, which is associated with increases in Tb.N but no change in cortical vBMD or cortical thickness (Ct.Th). Despite these significant changes in trabecular bone, there were no alterations in osteoblast or osteoclast numbers or activity in ERβPrx1–CKO versus control mice at 6 or 12 weeks of age (during growth and at adult peak bone mass), suggesting that the dynamic changes in bone formation and/or resorption may be occurring even earlier in development; consistent with this interpretation, trabecular bone mass was already increased in 6-week-old mice. Alternatively, because estrogen is known to have pleiotropic effects on bone metabolism,(31) it is possible that loss of ERβ leads to subtle changes in bone formation and/or resorption that are not evident either using bone histomorphometry or serum bone turnover markers.
Although ours is the first study to use cell-specific ERβ deletion, several previous studies have characterized the skeletal phenotype of global ERβ knockout mice at various ages.(5–7) Thus, in contrast to our findings of increased trabecular bone in the ERβPrx1–CKO mice, Windahl and colleagues(5) reported that 11-week-old female global ERβ knockout mice did not have increased trabecular BMD, but rather an increased cross-sectional cortical bone area. By contrast, male ERβ knockout mice lacked any skeletal changes, findings that were subsequently confirmed by Sims and colleagues.(7) In a follow-up study and consistent with our data, Windahl and colleagues(6) did find attenuated trabecular bone loss in female (but not male) ERβ knockout mice at 1 year of age, and these authors suggested that loss of ERβ may be partially protective against age-related bone loss in mice. It is important to keep in mind, however, that these previous studies used the mice generated by Krege and colleagues,(10) which were subsequently shown to express several transcript variants where exon 3 of the gene was consistently spliced out. In contrast, we used the floxed ERβ mice generated by Antal and colleague,(9) which lack all splice variants, and consequently have significant phenotypic differences from the original mice of Krege and colleagues.(10)
Another important difference between our study and the previous studies utilizing global ERβ knockout mice is that the latter also had systemic hormonal changes as a consequence of the ERβ deletion. Specifically, global ERβ knockout mice have increased circulating IGF-I levels,(8) which could explain the increase in cortical bone area in these mice. By contrast, osteoblast-lineage specific deletion of ERβ in the mice we studied did not affect serum IGF-I (or estradiol) levels (Supplemental Table S1).
Despite extensive efforts, we could not identify whether the increase in trabecular bone mass in the ERβPrx1–CKO mice was because of increased bone formation or reduced bone resorption. However, the CFU and gene analyses did provide possible clues regarding the underlying mechanisms for the increase in trabecular bone in these mice. These data are perhaps best examined in the context of previous work by Hall and colleagues, who demonstrated that ERα and ERβ form heterodimers within target cells and that ERβ functions as a transdominant inhibitor of ERα transcriptional activity.(27) Similarly, we have also shown that coexpression of both ERα and ERβ in hFOB and MG63 osteoblastic cells attenuates estrogen-dependent activity relative to each receptor alone.(28) We have extended these findings in this report by demonstrating that suppression of ERβ in MC3T3-E1 osteoblastic cells enhances ERα-specific transcriptional activity using the ERα-selective agonist PPT. Taken together, these data suggest that the effects of osteoblast-lineage-specific deletion of ERβ may be the result of enhanced ERα action in these cells. The finding that this occurs predominantly, and perhaps exclusively, in trabecular bone may be related to the observation that although ERα is expressed in both trabecular and cortical bone,(2,3) both mouse(2) and human(3) bone express ERβ principally in trabecular bone with little or no expression in cortical bone. Further support for the hypothesis that ERβPrx1–CKO mice have increased osteoblast sensitivity to estrogen effects mediated by ERα comes from studies by Lindberg and colleagues,(32) demonstrating that estrogen treatment of ovariectomized ERβ knockout mice resulted (on average) in an 85% greater stimulation of the observed estrogen-regulated genes compared with similarly treated wild-type mice.
In this context, our finding that the ratio of CFU-OBs to CFU-Fs was increased in the bone marrow cultures from ERβPrx1–CKO mice would be consistent with enhanced estrogen action in vivo in these mice, resulting in increased differentiation of osteoblast precursor cells into osteoblasts, as has been observed after estrogen treatment in several in vitro systems.(33) In addition, the pathways that were altered in the ERβPrx1–CKO mice in Table 2 may reflect, in large part, the genes regulated because of enhanced ERα action, as suggested by the previous work of Lindberg and colleagues(32) noted above. For example, previous studies in mice(34) and humans(35) found that estrogen inhibits the proliferation of osteoblastic cells, and a number of proliferation-associated genes were downregulated in the bones from the ERβPrx1–CKO mice (Table 2). Similarly, previous studies demonstrated that estrogen reduces markers of oxidative stress(36) and adipogenesis,(37) and both of these pathways were also downregulated in the bones from the ERβPrx1–CKO mice. We note that not all of the effects of ERβ deletion are because of enhanced ERα action, as there may be effects of the loss of ERβ itself in osteoblastic cells that are unrelated to ERα. Another possible explanation for the down-regulation of these pathways in the ERβPrx1–CKO mice may be because of reduction in bone remodeling, which may occur very early in development or in embryogenesis. Consistent with this, we did observe a trend for an increase in unresorbed/calcified cartilage spicules below the growth plates in the ERβPrx1–CKO mice, which would be indicative of a previous reduction in bone remodeling and in cartilage/bone resorption in these mice.
It is also important to note that although the collective evidence from the previous(27,32) and our studies indicates that ERβ serves as a natural antagonist to ERα in trabecular bone, there is also evidence that in the complete absence of ERα, ERβ can compensate for ERα and mediate some skeletal effects of estrogen. Thus, Sims and colleagues(7) found that global deletion of ERα resulted in an increase in trabecular bone mass in female mice because of high circulating estrogen levels activating ERβ. Similarly, Lindberg and colleagues(32) observed that estrogen treatment of ERα knockout mice resulted in an average stimulatory effect of estrogen on estrogen-regulated bone genes that was intermediate between those found in wild-type and ERα β double-inactivated mice, demonstrating that in the absence of ERα, ERβ can partially replace ERα in bone. Our data, as well as the previous observations of Windahl and colleagues(6) that trabecular bone loss is attenuated in global ERβ knockout mice, suggest that ERβ action may explain, at least in part, the observation from human studies that trabecular bone loss at multiple sites begins in women (and in men) in young adult life, at a time of estrogen-sufficiency, whereas the onset of cortical bone loss coincides with the menopause.(38) Indeed, similar trabecular bone loss in young adult life is present in mice.(39) Thus, the greater expression of ERβ in trabecular versus cortical bone(2,3) would lead to relative estrogen resistance in trabecular bone, resulting in slow bone loss throughout life. By contrast, complete estrogen deficiency would be needed to trigger bone loss in cortical bone. Although this is an attractive hypothesis stemming from the mouse data, clearly further studies are needed to more rigorously test this concept. In addition, from a therapeutic perspective, the potential development of compounds that activate ERα and simultaneously inhibit ERβ (or the use of combinations of such compounds) may result in more dramatic effects on bone than those observed with estrogen or with current selective estrogen receptor modulators, and this possibility also warrants further study.
We recognize that our studies have several limitations. First, the Prx1-Cre driver used in this study to specifically delete ERβ is only active in the mesenchymal progenitor cells in the appendicular and not the axial skeleton.(21) Therefore, it is not possible to assess the effects of ERβ deletion on the spine. To address this concern, we crossed mice harboring the ERβ conditional allele with the Col2.3-Cre mouse driver,(23) which is active in the axial skeleton, and found a similar increase in bone mass at the spine. Therefore, findings from two independent Cre models confirm the increase in trabecular bone mass after osteoblast lineage deletion of ERβ. A second limitation is the inability (despite extensive efforts) to determine whether the increase in trabecular bone mass is owing to a formation or resorption defect. As mentioned earlier, it is possible that loss of ERβ leads to changes in bone formation and/or resorption even earlier in development; alternatively, loss of ERβ could be leading to subtle changes in bone formation/resorption that are not evident using bone histomorphometry or serum bone turnover markers. Future studies to uncover the mechanism would include examination of the ERβPrx1–CKO and control mice during development. Finally, because the source of our RNA for the QPCR analyses is derived from tibial metaphyses and therefore represents a heterogeneous mixture of cells, it is not possible to determine in which cell type (eg, osteoblasts, osteocytes, chondrocytes, or lining cells) the gene expression changes are occurring. Furthermore, it is possible that deletion of ERβ may alter the tissue composition in favor of one cell type over another. Further studies are necessary to isolate each of these populations and individually determine the gene expression patterns between the ERβPrx1–CKO and control mice.
In conclusion, using osteoblast-lineage-specific deletion of ERβ in a mouse model that lacks all splice variants of ERβ or systemic hormonal changes, we demonstrate that ERβ predominantly regulates trabecular bone mass in mice. Our data, combined with previous studies,(27,32) are consistent with enhanced ERα action in bone in the ERβPrx1–CKO mice. The effects of ERβ in antagonizing ERα action in bone may also explain, at least in part, the observation that trabecular bone loss in mice and humans begins in young adult life, at a time of sex-steroid sufficiency, although further studies are clearly needed to test this intriguing hypothesis.
Supplementary Material
Supplementary Table 1. Relevant measures in the control and ERβPrx1-CKO mice at 12 weeks of age.
Supplementary Table 2. Serum PINP and CTX in the control and ERβΔOB mice at 12 weeks of age.
Acknowledgments
Grant support was provided by NIH (AG004875). We acknowledge the gift of the ERβflox/+ mice from Dr Pierre Chambon.
Footnotes
Disclosures
All authors state that they have no conflicts of interest.
Authors’ roles: All authors accept responsibility for the integrity of the data presented in this manuscript. KMN contributed to the experimental design, the acquisition, analysis, and interpretation of data, all drafts, and final approval of the manuscript. KF, DF, MML, and JW contributed to data acquisition and final approval of the manuscript. UM and MTD contributed to the experimental design and final approval of the manuscript. DGM and SK contributed to the experimental design, data interpretation, all drafts, and final approval of the manuscript.
Additional Supporting Information may be found in the online version of this article.
References
- 1.Rossouw JE, Prentice RL, Manson JE, et al. Postmenopausal hormone therapy and risk of cardiovascular disease by age and years since menopause. JAMA. 2007;297:1465–77. doi: 10.1001/jama.297.13.1465. [DOI] [PubMed] [Google Scholar]
- 2.Modder UIL, Sanyal A, Kearns, et al. Effects of loss of steroid receptor coactivator-1 on the skeletal response to estrogen in mice. Endocrinology. 2004;145:913–21. doi: 10.1210/en.2003-1089. [DOI] [PubMed] [Google Scholar]
- 3.Bord S, Horner A, Beavan S, Compston J. Estrogen receptors alpha and beta are differentially expressed in developing human bone. J Clin Endocrinol Metab. 2001;86:2309–14. doi: 10.1210/jcem.86.5.7513. [DOI] [PubMed] [Google Scholar]
- 4.Imai Y, Youn MY, Inoue K, Takada I, Kouzmenko A, Kato S. Nuclear receptors in bone physiology and diseases. Physiol Rev. 2013;93:481–523. doi: 10.1152/physrev.00008.2012. [DOI] [PMC free article] [PubMed] [Google Scholar]
- 5.Windahl SH, Vidal O, Andersson G, Gustafsson JA, Ohlsson C. Increased cortical bone mineral content but unchanged trabecular bone mineral density in female ER beta −/− mice. J Clin Invest. 1999;104:895–901. doi: 10.1172/JCI6730. [DOI] [PMC free article] [PubMed] [Google Scholar]
- 6.Windahl SH, Hollberg K, Vidal O, Gustafsson JA, Ohlsson C, Andersson G. Female estrogen receptor B−/− mice are partially protected against age-related trabecular bone loss. J Bone Miner Res. 2001;16:1388–98. doi: 10.1359/jbmr.2001.16.8.1388. [DOI] [PubMed] [Google Scholar]
- 7.Sims NA, Dupont S, Krust A, et al. Deletion of estrogen receptors reveals a regulatory role for estrogen receptors beta in bone remodeling in females but not in males. Bone. 2002;30:18–25. doi: 10.1016/s8756-3282(01)00643-3. [DOI] [PubMed] [Google Scholar]
- 8.Lindberg MK, Alatalo SL, Halleen JM, Mohan S, Gustafsson JA, Ohlsson C. Estrogen receptor specificity in the regulation of the skeleton in female mice. J Endocrinol. 2001;171:229–36. doi: 10.1677/joe.0.1710229. [DOI] [PubMed] [Google Scholar]
- 9.Antal MC, Krust A, Chambon P, Mark M. Sterility and absence of histopathological defects in nonreproductive organs of a mouse ERbeta-null mutant. Proc Natl Acad Sci USA. 2008;105:2433–8. doi: 10.1073/pnas.0712029105. [DOI] [PMC free article] [PubMed] [Google Scholar]
- 10.Krege JH, Hodgin JB, Couse JF, et al. Generation and reproductive phenotypes of mice lacking estrogen receptor beta. Proc Natl Acad Sci USA. 1998;95:15677–82. doi: 10.1073/pnas.95.26.15677. [DOI] [PMC free article] [PubMed] [Google Scholar]
- 11.Wang L, Andersson S, Warner M, Gustafsson JA. Morphological abnormalities in the brains of estrogen receptor beta knockout mice. Proc Natl Acad Sci USA. 2001;98:2792–6. doi: 10.1073/pnas.041617498. [DOI] [PMC free article] [PubMed] [Google Scholar]
- 12.Wang L, Andersson S, Warner M, Gustafsson JA. Estrogen receptor (ER)beta knockout mice reveal a role for ERbeta in migration of cortical neurons in the developing brain. Proc Natl Acad Sci USA. 2003;100:703–8. doi: 10.1073/pnas.242735799. [DOI] [PMC free article] [PubMed] [Google Scholar]
- 13.Weihua Z, Makela S, Andersson LC, et al. A role for estrogen receptor beta in the regulation of growth of the ventral prostate. Proc Natl Acad Sci USA. 2001;98:6330–5. doi: 10.1073/pnas.111150898. [DOI] [PMC free article] [PubMed] [Google Scholar]
- 14.Roforth MM, Fujita K, McGregor UI, et al. Efftects of age on bone mRNA levels of sclerostin and other genes relevant to bone metabolism in humans. Bone. 2014;59:1–6. doi: 10.1016/j.bone.2013.10.019. [DOI] [PMC free article] [PubMed] [Google Scholar]
- 15.Fujita K, Roforth MM, Demaray S, et al. Effects of estrogen on bone mRNA levels of sclerostin and other genes relevant to bone metabolism in postmenopausal women. J Clin Endocrinol Metab. 2014;99:E81–8. doi: 10.1210/jc.2013-3249. [DOI] [PMC free article] [PubMed] [Google Scholar]
- 16.Chokalingam J, Roforth MM, Nicks KM, et al. Examination of ERa signaling pathways in bone of mutant mouse models reveals the importance of ERE-dependent signaling. Endocrinology. 2012;153:5325–33. doi: 10.1210/en.2012-1721. [DOI] [PMC free article] [PubMed] [Google Scholar]
- 17.Radonic A, Thulke S, Mackay IM, Landt O, Siegert W, Nitsche A. Guideline to reference gene selection for quantitative real-time PCR. Biochem Biophys Res Commun. 2004;313:856–62. doi: 10.1016/j.bbrc.2003.11.177. [DOI] [PubMed] [Google Scholar]
- 18.Vandesompele J, De Preter K, Pattyn F, et al. Accurate normalization of real-time quantitative RT-PCR data by geometeric averaging of multiple internal control genes. Genome Biol. 2002;3(7):research0034. doi: 10.1186/gb-2002-3-7-research0034. [DOI] [PMC free article] [PubMed] [Google Scholar]
- 19.Zhao S, Fernald RD. Comprehensive algorithm for quantitative real-time polymerase chain reaction. J Comput Biol. 2005;12:1047–64. doi: 10.1089/cmb.2005.12.1047. [DOI] [PMC free article] [PubMed] [Google Scholar]
- 20.Fridley BL, Jenkins GD, Biernacka JM. Self-contained gene-set analysis of expression data: an evaluation of existing and novel methods. PLoS One. 2010 Sep 17;5(9) doi: 10.1371/journal.pone.0012693. pii: e12693. [DOI] [PMC free article] [PubMed] [Google Scholar]
- 21.Logan M, Martin JF, Nagy A, Lobe C, Olson EN, Tabin CJ. Expression of Cre recombinase in the developing mouse limb bud driven by a Prxl enhancer. Genesis. 2002;33:77–80. doi: 10.1002/gene.10092. [DOI] [PubMed] [Google Scholar]
- 22.Maneix L, Antonson P, Humire P, et al. Estrogen receptor beta exon 3-deleted mouse: the importance of non-ERE pathways in ERbeta signaling. Proc Natl Acad Sci USA. 2015;112:5135–40. doi: 10.1073/pnas.1504944112. [DOI] [PMC free article] [PubMed] [Google Scholar]
- 23.Bogdanovic Z, Bedalov A, Krebsbach PH, et al. Upstream regulatory elements necessary for expression of the rat COL1A1 promoter in transgenic mice. J Bone Miner Res. 1994;9:285–92. doi: 10.1002/jbmr.5650090218. [DOI] [PubMed] [Google Scholar]
- 24.Hofbauer LC, Khosla S, Dunstan CR, Lacey DL, Spelsberg TC, Riggs BL. Estrogen stimulates gene expression and protein production of osteoprotegerin in human osteoblastic cells. Endocrinology. 1999;140:4367–70. doi: 10.1210/endo.140.9.7131. [DOI] [PubMed] [Google Scholar]
- 25.Eghbali-Fatourechi G, Khosla S, Sanyal A, Boyle WJ, Lacey DL, Riggs BL. Role of RANK ligand in mediating increased bone resorption in early postmenopausal women. J Clin Invest. 2003;111:1221–30. doi: 10.1172/JCI17215. [DOI] [PMC free article] [PubMed] [Google Scholar]
- 26.Kondoh S, Inoue K, Igarashi K, et al. Estrogen receptor a in osteocytes regulates trabecular bone formation in female mice. Bone. 2014;60:68–77. doi: 10.1016/j.bone.2013.12.005. [DOI] [PMC free article] [PubMed] [Google Scholar]
- 27.Hall JM, McDonnell DP. The estrogen receptor beta-isoform (ER beta) of the human estrogen receptor modulates ER alpha transcriptional activity and is a key regulator of the cellular response to estrogens and antiestrogens. Endocrinology. 1999;140:5566–78. doi: 10.1210/endo.140.12.7179. [DOI] [PubMed] [Google Scholar]
- 28.Monroe DG, Johnsen SA, Subramaniam M, et al. Mutual antagonism of estrogen receptors alpha and beta and their preferred interactions with steroid receptor coactivators in human osteoblastic cell lines. J Endocrinol. 2003;176:349–57. doi: 10.1677/joe.0.1760349. [DOI] [PubMed] [Google Scholar]
- 29.Monroe DG, Secreto FJ, Subramaniam M, Getz BJ, Khosla S, Spelsberg TC. Estrogen receptor alpha and beta heterodimers exert unique effects on estrogen- and tamoxifen-dependent gene expression in human U2OS osteosarcoma cells. Mol Endocrinol. 2005;19:1555–68. doi: 10.1210/me.2004-0381. [DOI] [PubMed] [Google Scholar]
- 30.Kraichely DM, Sun J, Katzenellenbogen JA, Katzenellenbogen BS. Conformational changes and coactivator recruitment by novel ligands for estrogen receptor-alpha and estrogen receptor-beta: correlations with biological character and distinct differences among SRC coactivator family members. Endocrinology. 2000;141:3534–45. doi: 10.1210/endo.141.10.7698. [DOI] [PubMed] [Google Scholar]
- 31.Khosla S, Oursler MJ, Monroe DG. Estrogen and the skeleton. Trends Endocrinol Metabl. 2012;23:576–81. doi: 10.1016/j.tem.2012.03.008. [DOI] [PMC free article] [PubMed] [Google Scholar]
- 32.Lindberg MK, Moverare S, Skrtic S, et al. Estrogen receptor (ER)-beta reduces ER-alpha-regulated gene transcription, supporting a “ying yang” relationship between ERalpha and ERbeta in mice. Mol Endocrinol. 2003;17:203–8. doi: 10.1210/me.2002-0206. [DOI] [PubMed] [Google Scholar]
- 33.Syed F, Khosla S. Mechanisms of sex steroid effects on bone. Biochem Biophys Res Commun. 2005;328:688–96. doi: 10.1016/j.bbrc.2004.11.097. [DOI] [PubMed] [Google Scholar]
- 34.Gregorio GB, Yamamoto M, Ali AA, et al. Attenuation of the self-renewal of transit-amplifying osteoblast progenitors in the murine bone marrow by 17beta-estradiol. J Clin Invest. 2001;107:803–12. doi: 10.1172/JCI11653. [DOI] [PMC free article] [PubMed] [Google Scholar]
- 35.Modder UI, Roforth MM, Hoey K, et al. Effects of estrogen on osteoprogenitor cells and cytokines/bone regulatory factors in postmenopausal women. Bone. 2011;49:202–7. doi: 10.1016/j.bone.2011.04.015. [DOI] [PMC free article] [PubMed] [Google Scholar]
- 36.Almeida M, Martin-Millan M, Plotkin LI, et al. Skeletal involution by age-associated oxidative stress and its acceleration by loss of sex steroids. J Biol Chem. 2007;282:27285–97. doi: 10.1074/jbc.M702810200. [DOI] [PMC free article] [PubMed] [Google Scholar]
- 37.Syed FA, Oursler MJ, Hefferanm TE, Peterson JM, Riggs BL, Khosla S. Effects of estrogen therapy on bone marrow adipocytes in postmenopausal osteoporotic women. Osteoporos Int. 2008;19:1323–30. doi: 10.1007/s00198-008-0574-6. [DOI] [PMC free article] [PubMed] [Google Scholar]
- 38.Khosla S, Melton LJ, 3rd, Riggs BL. The unitary model for estrogen deficiency and the pathogenesis of osteoporosis: is a revision needed? J Bone Miner Res. 2011;26:441–51. doi: 10.1002/jbmr.262. [DOI] [PMC free article] [PubMed] [Google Scholar]
- 39.Glatt V, Canalis E, Stadmeyer L, Bouxsein ML. Age-related changes in trabecular architecture differ in female and male C57BL/6J mice. J Bone Miner Res. 2007;22:1197–207. doi: 10.1359/jbmr.070507. [DOI] [PubMed] [Google Scholar]
Associated Data
This section collects any data citations, data availability statements, or supplementary materials included in this article.
Supplementary Materials
Supplementary Table 1. Relevant measures in the control and ERβPrx1-CKO mice at 12 weeks of age.
Supplementary Table 2. Serum PINP and CTX in the control and ERβΔOB mice at 12 weeks of age.