

Abstract
The autonomic nervous system (ANS) dysfunction has been well described in schizophrenia (SZ), a severe mental disorder. Nevertheless, the coupling between the ANS and central brain activity has been not addressed until now in SZ. The interactions between the central nervous system (CNS) and ANS need to be considered as a feedback–feed-forward system that supports flexible and adaptive responses to specific demands. For the first time, to the best of our knowledge, this study investigates central–autonomic couplings (CAC) studying heart rate, blood pressure and electroencephalogram in paranoid schizophrenic patients, comparing them with age–gender-matched healthy subjects (CO). The emphasis is to determine how these couplings are composed by the different regulatory aspects of the CNS–ANS. We found that CAC were bidirectional, and that the causal influence of central activity towards systolic blood pressure was more strongly pronounced than such causal influence towards heart rate in paranoid schizophrenic patients when compared with CO. In paranoid schizophrenic patients, the central activity was a much stronger variable, being more random and having fewer rhythmic oscillatory components. This study provides a more in-depth understanding of the interplay of neuronal and autonomic regulatory processes in SZ and most likely greater insights into the complex relationship between psychotic stages and autonomic activity.
Keywords: heart–brain interactions, causal coupling analyses, joint symbolic dynamics, partial-directed coherence, autonomous nervous system, schizophrenia
1. Introduction
Schizophrenia is considered to be one of the most severe mental disorders in the world. It is associated with higher cardiac mortality rates, an approximately 15–20 year shorter life expectancy, and up to triple the risk of attaining cardiovascular disease (CVD) compared with the general population, independent of age groups [1–3]. A particular cause for concern is that the mortality gap between the general population and schizophrenia patients seems to have increased during recent decades [4]. Suicide and accidents account for only a part of excess mortality, whereas a substantial proportion is due to physical illness [5]. The largest single cause of death in schizophrenia patients leading to an increased mortality rate is due to CVD, with CVD mortality ranging from 40% to 50% [6]. Causal factors for patients with this condition are still being discussed, and have not been fully clarified until now. However, possible complicating factors are related to lifestyle, the lack of physical activity, smoking, obesity, poor diet, substance abuse, diabetes, hypertension, the cardiac side effects of antipsychotics and the imbalanced autonomic nervous system (ANS) during acute psychosis [1,6,7]. Two important differences from other patient populations suffering from primary cardiac conditions (e.g. myocardial infarction, cardiomyopathy) and which present signs of cardiac autonomic dysfunction (CAD) need to be taken into account. The first difference is the fact that severe CAD is not initially caused by major structural or functional alterations of the heart in schizophrenia patients. Moreover, it seems to be associated with an altered brain–heart interaction influenced by a lack of cortical inhibitory control over sympathoexcitatory subcortical regions [8,9]. The second difference from patient populations suffering from primary cardiac conditions is caused by the relative ‘longevity’ of patients with schizophrenia when compared with more frequent shorter survival rates of cardiac patients.
Previous studies have indicated that people with lower heart rate variability (HRV), as seen in the case of schizophrenia, exhibit effective behavioural responses (e.g. faster response times and higher accuracy rates) on executive cognitive tasks as well as exhibited flexible and adaptive emotional [10,11]. Thayer & Lane [12] proposed the neurovisceral integration model, which suggests that neural networks implicated in emotional and cognitive self-regulation are also involved in the control of cardiac autonomic activity. Frontal, cingulate and subcortical brain regions have been hypothesized to play a critical role in such self-regulatory functions through top-down control from the frontal cortex over subcortical regions involved in reward and emotion, such as the amygdala [13]. A recent meta-analysis [14] revealed that resting HRV is tied to the functioning of frontal–subcortical circuits. Higher resting HRV is associated with the effective functioning of frontal-top-down control over subcortical brain regions that support flexible and adaptive responses to environmental demands [12]. It is noteworthy that a disruption of frontal–subcortical circuits has been associated with a wide range of psychopathologies, including schizophrenia [15]. Cognitive impairment is thus known to be a universal and core symptom of schizophrenia. This impairment critically influences treatment response, a patient's insight into the illness and the patient's employment status, ability to communicate, social relationships and living status [16]. Cardiovascular adjustments owing to a shift in central–autonomic control and remodelling of the heart are most prominent features of exercising [17,18]. It has been suggested that a reduced sympathetic modulation and an increased parasympathetic dominance may be caused by adaptations of peripheral and central regulatory systems [19]. Cardiovascular centres in the brainstem work through various cardiovascular reflex mechanisms such as the baroreflex, the chemoreflex and the cardiopulmonary reflex [20]. The efferent sympathetic reflex component is determined by neurons in the caudal and rostral ventrolateral medulla. These neurons contribute to the maintenance of blood pressure and heart rate by signalling to the intermediolateral column of the spinal cord. Two further medullary areas contain preganglionic parasympathetic neurons: these are the nucleus ambiguous and the dorsal motor nucleus of the vagus nerve. Both mediate the efferent parasympathetic components of the above-described reflexes [21,22]. These preganglionic parasympathetic neurons might show either cardiac- or respiration-related activity. Brain stem nuclei and pathways receive modulatory inputs from supramedullary centres such as the insula, thalamus, hypothalamus, amygdala, parietal and cingulate regions, or from the medial prefrontal region [23]. Studies have shown the involvement of these brain areas in the autonomic regulation at rest and during cognitive or emotional strains by means of functional brain imaging [24,25]. In the recent meta-analysis performed by Beissner et al. [26], it was found that largely divergent brain networks were associated with sympathetic and parasympathetic activity. It was revealed that autonomic regulation involves mainly the ventromedial prefrontal cortex, the perigenual anterior, the dorsal anterior cingulate, the posterior cingulate cortex and the insular cortices, in addition to the amygdala. It has been assumed that various autonomic function processes are generated by a network of interactions showing specificity for task and autonomic division. Psychopathological states such as anxiety, depression, post-traumatic stress disorder and schizophrenia are associated with prefrontal hypoactivity, and a lack of inhibitory neural processes reflected by a poor habituation to novel neutral stimuli, a pre-attentive bias for threat information, deficits in working memory and executive function, and poor affective information processing and regulation [27]. For healthy adults, Beissner et al. suggested that asymmetric frontal electroencephalogram (EEG) responses to emotional arousal in the form of positive and negative emotions may elicit different patterns of cardiovascular reactivity [28]. In summary, different studies using both pharmacological and neuroimaging approaches provided evidence that activity of the prefrontal cortex is associated with vagally mediated HRV [29].
Owing to this assumption that cardiovascular regulation mainly involves the prefrontal lobe, our investigation will focus on differences within this brain region with respect to heart rate and blood pressure. Thus, the aim of this study was to investigate the short-term instantaneous central–autonomic coupling (CAC) by determining the strength and direction, as well as the underlying structural patterns of this particular coupling in patients suffering from paranoid schizophrenia when compared with healthy subjects. To this end, we applied the coupling approaches high-resolution joint symbolic dynamics(HRJSD) and the normalized short-time partial-directed coherence (NSTPDC). In particular, we strived to determine whether significantly different correlations existed between changes in EEG activity at the frontal lobe and changes in heart rate, as well as in these subjects' systolic blood pressure. In this regard, it must be considered that the interactions between the central nervous system (CNS) and ANS can be assumed to be a feedback–feed-forward system that supports flexible and adaptive responses to environmental demands. This study may improve the understanding of pathophysiological processes of the central–autonomic network found in paranoid schizophrenia patients.
2. Material and methods
(a). Patients
In this study, 17 patients with paranoid schizophrenia (SZ; two females, 37.5±10.4 years) and 17 healthy subjects (CO; four females, 37.7±13.1 years), who were matched according to age and gender, were enrolled.
The diagnosis of paranoid schizophrenia was established when patients fulfilled DSM-IV criteria (Diagnostic and Statistical Manual of Mental Disorders, fourth edition). Psychotic symptoms were quantified using the positive and negative syndrome scale. Patients had been treated with depot antipsychotic medication (77% being atypical neuroleptics and 23% being a mixture of antidepressant and atypical neuroleptics). Thoroughly performed interview and clinical investigations were performed for CO to exclude any potential psychiatric or other diseases, as well as to double-check for any interfering medication. The structured clinical interview and a personality inventory (Freiburger Persönlichkeitsinventar) were also applied to CO to detect personality traits and any disorders that might influence autonomic function. Furthermore, all subjects were asked to relax and to breathe normally to avoid hyperventilation. No further breathing instructions were given. Subjects were explicitly asked not to talk during the recording. All participants (SZ and CO) provided their written informed consent to a protocol approved by the local ethics committee of the Jena University Hospital. This study complies with the Declaration of Helsinki.
(b). Data recordings and pre-processing
From all schizophrenic patients and healthy subjects, a three-channel short-term electrocardiogram (500 Hz), non-invasive continuous blood pressure (200 Hz) and a 64-channel EEG were recorded for 15 min under resting conditions. Participants remained seated and their eyes were closed during this recording. The EEG was acquired using 64 active Ag/AgCl electrodes, and transmitted using a BrainAmp Amplifier (Brain Products, Germany, sampling rate 500 Hz, AFZ: ground, FCZ: reference). The electrodes were positioned according to the extended 10–20 system using an electrode cap. The impedance levels (less than 25 kΩ) for all electrodes were checked following attachment of the electrode cap to each participant's scalp. The arterial blood pressure was recorded using the volume-clamp photoplethysmographical blood pressure device Portapres model-2 (TNO Biomedical Instrumentation, The Netherlands). Investigations were performed between 14.00 and 18.00 in a quiet room that was kept comfortably warm (22–24°C) and began after subjects had rested in a supine position for 10 min. Subjects were asked to close their eyes, relax and breathe normally to avoid hyperventilation.
The following time series with respect to autonomous regulation was automatically extracted from the raw data records (figure 1) using in-house software (programming environment Delphi v. 3 and Matlab R2011b):
— time series of heart rate (lead I) consisting of successive beat-to-beat intervals (BBI, tachogram, (ms)),
— time series consisting of the maximum successive systolic blood pressure amplitude values over time in relation to the previous R-peak (the given RR-interval) (SYS, systogram, (mmHg)) (figure 2), and
— time series consisting of the maximum successive diastolic blood pressure amplitude values over time in relation to the previous R-peak (the given RR-interval) (DIA, diastogram, (mmHg)).
Figure 1.
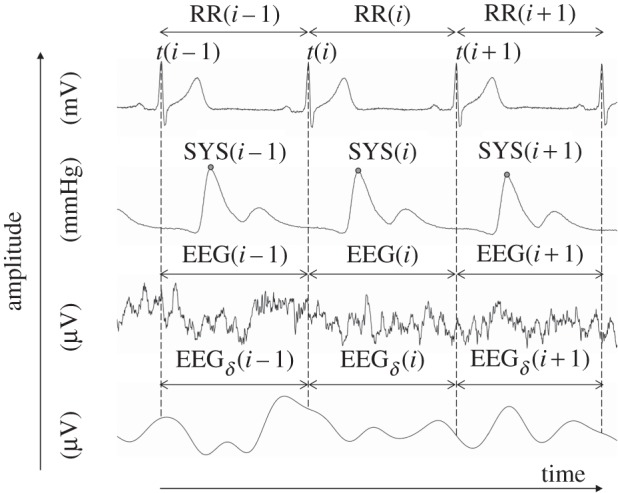
A visualization example of analysed raw data records and their extracted time series. Raw data are, from top to bottom: electrocardiogram, non-invasive continuous blood pressure, electroencephalogram (EEG) and EEG spectral band component (delta). RR(i) represents the beat-to-beat intervals; SYS(i) represents the maximum systolic blood pressure amplitude values over time in relation to the previous R-peak; EEG(i) and EEGδ(i) specified to time intervals of the EEG raw data (electrode: F4); and the EEG delta band time intervals (electrode: F4) in relation to RR(i).
Figure 2.

Examples of extracted time series. Time series from top to bottom are: tachograms (BBI); systograms (SYS); the mean power PEEG(i) of the BBI-related EEG intervals EEG(i); and the mean power PEEGδ(i) of the BBI-related EEG-delta band intervals EEGδ(i) from a control subject (a), and a patient with paranoid schizophrenia (b). Note the typical lower variability in BBI sequences and the lower mean power PEEG and PEEGδ in the patient suffering from paranoid schizophrenia. The plot scaling of the PEEGδ(i) time series was different to guarantee for a higher degree of visual clarity.
EEG recordings were band-pass filtered (0.05–60 Hz, Butterworth filter, order=3) in order to remove slow drifts resulting from slow body movements or sweating, and to prevent higher-frequency content from additional components. For EEG analyses, artefact-free time series were used, being determined by visual inspection and via automatic classification using the Brain Products software Analyzer v. 2.0. Based on the EEG raw data recordings, new time series consisting of the EEG spectral band components as delta (0.5–3.5 Hz), theta (3.5–7.5 Hz), alpha (7.5–12.5 Hz), alpha1 (7.5–9.5 Hz), alpha2 (9.5–12.5 Hz), beta (12.5–25 Hz), beta1 (12.5–17.5 Hz), beta2 (17.5–25 Hz) and gamma (greater than 25–60 Hz) activity were derived (Butterworth filter, order=3) for each electrode (figure 1). These recordings (EEG raw data and the nine associated EEG spectral bands) were used for further analyses. For example, for the EEG channel Fp1, we obtained the 10 time series EEGFp1, EEGFp1δ, EEGFp1θ, EEGFp1α, EEGFp1α1, EEGFp1α2, EEGFp1β, EEGFp1β1, EEGFp1β2 and PFp1γ. In relation to the extracted RR-intervals (figure 1) from the EEG raw data and the EEG spectral band recordings, the corresponding time intervals were extracted as EEG(i) (ms) and EEGband(i) (ms) (figure 1). Within each RR-interval RR(i), with i (i=1: R−1) as the successive number of R-peaks (R), the mean power PEEG(i) of EEG(i) and the mean power PEEGband(i) of EEGband(i) were calculated to obtain new time series for signal analyses (figure 2):
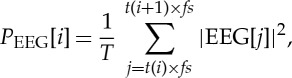 |
2.1 |
where T represents the number of samples within RR(i) or EEG(i), respectively, t(i) represents the current point in time of RR(i) and fs represents the sampling frequency. New types of time series were thus derived as PEEG, PEEGδ, PEEGθ, PEEGα, PEEGα1, PEEGα2, PEEGβ, PEEGβ1, PEEGβ2 and PEEGγ (μV2). All extracted time series (autonomous, central) were filtered by applying an adaptive variance estimation algorithm [30] to remove and interpolate seldom occurring ventricular premature beats and artefacts (e.g. movement, electrode noise and extraordinary peaks) to obtain normal-to-normal beat time series (NN). To obtain synchronized time series, BBI, SYS, PEEG and PEEGband were resampled using a linear interpolation method (2 Hz). For all EEG analyses and CAC analyses, three brain regions with the corresponding EEG channels were analysed, namely
— the frontal area (Fp1, Fp2, AF3, AF4, AF7, AF8, Fz, F1, F2, F3, F4, F5, F6, F7, F8, FC1, FC2, FC3, FC4, FC5, FC6, FT7, FT8, FT9, FT10),
— the left frontal area (Fp1, AF3, AF7, F1, F3, F5, F7, FC1, FC3, FC5, FT7, FT9), and
— the right frontal area (Fp2, AF4, AF8, F2, F4, F6, F8, FC2, FC4, FC6, FT8, FT10).
For the conducting of CAC analyses, the autonomic time series (BBI and SYS) from each subject were coupled/combined with all possible EEG channels, and subsequently averaged. For example, when coupling heart rate (BBI) with the raw EEG (right frontal area), we obtained 12 different coupling combinations of BBI-PEEG(Fp2),BBI-PEEG(AF4),BBI-PEEG(AF8),BBI-PEEG(F2),…,BBI-PEEG(FT10). These 12 combinations were analysed using different coupling approaches (see NSTPDC, HRJSD). Furthermore, for each combination, the methods-related indices were derived and averaged for each subject.
(c). Standard indices taken from electroencephalogram in the frequency domain
For the quantification of the EEG, the power within the delta (Pδ: 0.5–3.5 Hz), theta (Pθ: 3.5–7.5 Hz), alpha (Pα: 7.5–12.5 Hz), alpha1 (Pα1: 7.5–9.5 Hz), alpha2 (Pα2: 9.5–12.5 Hz), beta (Pβ: 12.5–25 Hz), beta1 (Pβ1: 12.5–17.5 Hz), beta2 (Pβ2: 17.5–25 Hz) and gamma (Pγ: 25–60 Hz) bands and the whole power P within the entire frequency band (0.5–60 Hz) were calculated from the EEG raw data recordings applying the Welch method [31] to estimate the power spectral density function (window length = 5 s, overlap = 50%).
(d). Standard indices from heart rate variability, blood pressure variability and baroreflex sensitivity
HRV and blood pressure variability (BPV) were quantified by calculating standard parameters from the time domain [32,33] as
— the mean value of the NN intervals (meanNN) of BBI (ms), systolic (_sys) and diastolic (_dia) blood pressure (mmHg) values and
— the standard deviation (sdNN) of the NN intervals of BBI (ms), systolic (_sys) and diastolic (_dia) blood pressure (mmHg) values.
In this study, we used the dual sequence method [34] to estimate the spontaneous baroreflex sensitivity (BRS) which is based on the sequence technique. To this end, both a minimum change of a 1 mmHg increase/decrease in SYS, and 5 ms in BBI were defined as inclusion criteria for a spontaneous baroreflex-related cardiovascular oscillation. The slopes of the regression lines between SYS and BBI sequences were taken as an index for local BRS (ms mmHg−1). We analysed two kinds of BBI responses: (i) bradycardic (an increase in SYS being associated with an increase in BBI) and (ii) tachycardic fluctuations (a decrease in SYS being associated with a decrease in BBI). As a result, two indices were derived:
— the slope of the regression line between all bradycardic (bslope) baroreflex fluctuations (ms mmHg−1) and
— the slope of the regression line between all tachycardic (tslope) baroreflex fluctuations (ms mmHg−1).
(e). Central–autonomic coupling: high-resolution joint symbolic dynamics
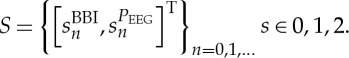
The tool of HRJSD was originally introduced [35,36] to quantify the effects of antipsychotics and their anticholinergic effects on nonlinear cardiovascular couplings in acute schizophrenia via the use of symbols. The idea of HRJSD is to classify frequent deterministic patterns lasting three beats (represented by symbols). The HRJSD approach enables the classification and characterization of short-term regulatory bivariate coupling patterns that are dominating the interaction generated by the ANS. In this study, we applied HRJSD as a promising tool to analyse CAC. HRJSD was applied to determine short-term bivariate coupling patterns between EEG and ANS-related (heart rate, systolic blood pressure) time series. HRJSD based on symbolization permits a coarse-grain quantitative assessment of short-term dynamics of time series/biosignals. Therefore, the direct analysis of successive signal amplitudes is based on discrete states (represented by symbols). In short, HRJSD works by transforming the two investigated time series (BBI and or SYS and PEEG) into symbol sequences based on their signal amplitudes using a given alphabet A={0,1,2}. The bivariate sample vector X of the two time series (e.g. BBI and PEEG) with xBBI and xPEEG is transformed into a bivariate symbol vector S, where n are the nth beat-to-beat values of BBI and PEEG, respectively.
| 2.2 |
and
 |
2.3 |
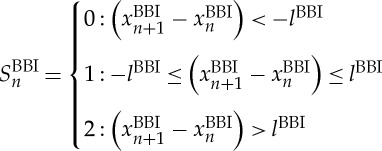
The bivariate symbol vector S is defined using the following definitions:
 |
2.4 |
and
 |
2.5 |
Increasing values were coded as ‘2’, decreasing values were coded as ‘0’ and unchanging (with no or little variability) values were coded as ‘1’. Afterwards, S was subdivided into short words (sequences of symbols) wk of length k=3. In this study, an adapted threshold l to the individual physiological dynamic variability lBBI and lSYS and lPEEG equal to 25% of the s.d. of the BBI and PEEG time series was applied. The derived different word types from the BBI (wBBI) and PEEG (wPEEG) time series (word types ranging from: 000,001,…,221,222) were sorted into a normalized 27×27 vector matrix Wn ranging from word type (000,000)T to (222,222)T. These single-word types wBBI,wPEEG (where the total number of all word type combinations is 27×27=729) were subsequently grouped into eight pattern families wf, whereby the sum of probabilities of all single-word family occurrences p(wf) was normalized to 1. The eight pattern families (E0, E1, E2, LU1, LD1, LA1, P, V) describe different aspects of autonomic modulation (strong and weak increase or decrease, no variability or alternations) of the BBI and PEEG time series. These families were then sorted into an 8×8 pattern family density matrix Wf, resulting in 64 CAC patterns. These pattern families were defined as follows (figure 3):
— E0, E1 and E2: words consisting of three equal symbols (no variation of symbols) of type ‘0’, ‘1’ and ‘2’, respectively.
— LU1 and LD1: words consisting of two different symbols with low increasing behaviour (LU1) and low decreasing behaviour (LD1).
— LA1: words consisting of two different alternating symbols of type ‘0’ and ‘2’ with an increasing–decreasing behaviour.
— P and V: words consisting of three different symbols with peak-like behaviour (P) and with valley-like behaviour (V).
Figure 3.

Definition of eight HRJSD pattern families (BBI, beat-to-beat intervals; HR, heart rate; SYS, systolic blood pressure; PEEG, mean power of BBI-related EEG intervals).
Using the word distribution density matrix Wf, the normalized joint probability of each word occurrence was calculated and analysed.
Furthermore, from the matrix Wf, the sum of each (n=8) column cfPEEG (cfE0, cfE1, cfE2, cfLU1, cfLD1, cfLA1, cfP, cfV) and the sum of each (n=8) row rfBBI (rfE0, rfE1, rfE2, rfLU1, rfLD1, rfLA1, rfP, rfV) were calculated. This corresponds to the univariate analysis of the symbolic dynamics of the first and second signals used for the HRJSD matrix construction. To quantify the complexity of the CAC, the Shannon entropy (HRJSDShannon) within Wfwas estimated using the following equation:
 |
2.6 |
In this study, the causal CAC between BBI and SYS with PEEG were investigated with respect to a bivariate dynamic system.
(f). Central–autonomic coupling: normalized short-time partial-directed coherence
To quantify the causal coupling direction and strength between the central and autonomic time series, the NSTPDC [37,38] approach was applied, based on an m-dimensional MAR process with model order p to determine Granger causality in the frequency domain. To this end, the NSTPDC is based on the time-variant partial-directed coherence approach (tvPDC, πxy( f,n)), providing information about the partial correlative short-time interaction properties of non-stationary signals, with f as the frequency and n the number of windows [39]. To quantify the coupling direction between two time series x and y (e.g. BBI and PEEG: with xBBI and yPEEG) a coupling factor (CF) was introduced. CF was obtained by dividing the mean value πxBBIyPEEG( f,n) by the mean value of πyPEEGxBBI( f,n):
 |
2.7 |
These results were normalized to become a specific set of values leading to the normalized factor (NF). max ( )
)
 |
2.8 |
NF allows for the determination of the direction of the causal connections between the investigated time series (xBBI and yPEEG) as a function of frequency f. NF takes the following values: NF={−2,−1,0,1,2}. Strong unidirectional coupling is indicated if NF is −2 or 2 (where −2 denotes yPEEG as the driver), bidirectional coupling if NF=−1 or 1 (−1 denotes yPEEG as the driver) and an equal influence in both directions and/or no coupling if NF=0.
For determining the coupling strength between two time series xBBI and yPEEG the areas (ABBI→PEEG, APEEG→BBI (arb. units)) generated in space by CF were estimated for each window using a trapezoidal numerical integration function for approximation. ABBI→PEEG and APEEG→BBI range between 0 and 1 [0,1]. Hereby, 1 indicates that all causal influences originating from one time series x are directed towards (arrows: →) the second one y (Ax→y=1).
In this study, NSTPDC indices were calculated by applying a window (Hamming) of lengths l, where l=80 samples, and shifting the window by 20 samples per each iteration step (60 samples overlap between each window).
In order to take advantage of the aspect of stationarity and scale-invariance for NSTPDC analyses, a normalization (zero mean and unit variance) of the time series BBI, SYS and PEEG/PEEGband was performed [37]. Therefore, each sample i of the BBI and PEEG time series x={xi,i=1,…N} and y={yi,i=1,…N} with N as the maximal number of samples i (temporal index) was first normalized by subtracting the mean of  and then dividing by the s.d. of x or y, respectively. The normalized time series xnorm and ynorm with zero mean and unit variance were thus obtained:
 |
2.9 |
In this study, the causal CAC between BBI, SYS and PEEG, as well as BBI, SYS and PEEGband were investigated with respect to a multivariate dynamic system.
(g). Statistics
The non-parametric exact two-tailed Mann–Whitney U-test (SPSS 21.0) was performed to evaluate differences in central and autonomic standard indices, as well as differences in CAC indices between SZ and CO persons. The significance level was set to p<0.01 (Bonferroni–Holm adjustment: p<0.00045, n=100 indices). In order to facilitate comparisons with other findings within the field where published papers dealt almost exclusively with mean values, it was decided that this paper would present all results as mean values and s.d. All indices in the tables (results section) were also presented in medians and interquartile ranges (see also electronic supplementary material).
3. Results
(a). Standard electroencephalogram-related indices
Considering EEG-related standard frequency domain spectral component indices, we found that when comparing SZ with CO persons in terms of the frontal area, the left frontal area and the right frontal area, highly significant (p<0.00045) differences between both groups were apparent (table 1). Thereby, a significant decrease in the mean power of all spectral bands (delta Pδ to gamma Pγ) and in the whole power P was obviously present for SZ in comparison with CO. In both groups, a lower power was shown in the left frontal area when compared with the right frontal area.
Table 1.
Univariate statistical analysis results of EEG standard indices in the frequency domain. These discriminate between patients suffering from paranoid schizophrenia (SZ) and healthy subjects (CO).
| all frontal | left frontal | right frontal | ||||
|---|---|---|---|---|---|---|
| index | CO mean±s.d. | SZ mean±s.d. | CO mean±s.d. | SZ mean±s.d. | CO mean±s.d. | SZ mean±s.d. |
| EEG | ||||||
| Pδ | 496 ± 761** | 417 ± 1341 | 498 ± 805** | 460 ± 1683 | 494 ± 711** | 367 ± 793 |
| Pθ | 64 ± 65** | 40 ± 57 | 63 ± 67** | 39 ± 62 | 65 ± 63** | 40 ± 50 |
| Pα | 56 ± 54** | 17 ± 14 | 54 ± 54** | 17 ± 14 | 58 ± 54** | 18 ± 14 |
| Pα1 | 34 ± 41** | 10 ± 8.8 | 33 ± 40** | 9.3 ± 8.8 | 35 ± 41** | 10 ± 8.8 |
| Pα2 | 20 ± 15** | 5.8 ± 5.2 | 19 ± 16** | 5.6 ± 5.6 | 21 ± 15** | 6.0 ± 4.7 |
| Pβ | 47 ± 42** | 14 ± 10 | 46 ± 47** | 12 ± 9.4 | 49 ± 34** | 15 ± 10 |
| Pβ1 | 7.0 ± 4.9** | 2.2 ± 1.5 | 6.8 ± 5.2** | 2.0 ± 1.5 | 7.3 ± 4.5** | 2.4 ± 1.6 |
| Pβ2 | 12 ± 10** | 3.4 ± 2.4 | 11 ± 10** | 3.2 ± 2.3 | 12 ± 9.3** | 3.7 ± 2.4 |
| Pγ | 21 ± 32** | 5.2 ± 5.7 | 20 ± 38** | 4.5 ± 4.8 | 21 ± 23** | 6.1 ± 6.5 |
| P | 712 ± 886** | 506 ± 1402 | 710 ± 933** | 546 ± 1753 | 714 ± 831** | 460 ± 843 |
*p<0.01, significantly different between SZ and CO; **p<0.00045, significantly different between SZ and CO.
(b). Standard indices from heart rate variability, blood pressure variability and baroreflex sensitivity
HRV analysis revealed highly significant differences in meanNN (p<0.00045) and rmssd (p<0.01) between both groups (table 2). Thereby, SZ patients were characterized by having reduced mean basic beat-to-beat intervals (meanNN) and HRV (sdNN, rmssd) in comparison with CO subjects. Analyses of basic systolic and diastolic blood pressure indices (BPV_sys, BPV_dia) revealed, however, no significant differences between SZ and CO (table 2).
Table 2.
Univariate statistical analysis results of heart rate and systolic/ diastolic blood pressure variability (HRV, BPV_sys, BPV_dia) in the time domain; and baroreflex sensitivity (BRS) analysis which discriminates between paranoid schizophrenia patients (SZ) and healthy subjects (CO).
| index | p | CO mean ± s.d. | SZ mean ± s.d. |
|---|---|---|---|
| HRV | |||
| meanNN_BBI | ** | 904.2 ± 153.0 | 709.4 ± 104.7 |
| sdNN_BBI | n.s. | 52.0 ± 23.0 | 32.3 ± 23.4 |
| rmssd_BBI | * | 34.1 ± 18.6 | 16.9 ± 13.9 |
| BPV | |||
| meanNN_sys | n.s. | 134.9 ± 19.8 | 121.4 ± 15.4 |
| sdNN_sys | n.s. | 9.2 ± 3.0 | 10.0 ± 6.8 |
| meanNN_dia | n.s. | 69.8 ± 12.8 | 66.7 ± 12.2 |
| sdNN_dia | n.s. | 0.8 ± 0.9 | 2.5 ± 3.6 |
| BRS | |||
| bslope | * | 10.2 ± 5.8 | 4.6 ± 3.5 |
| tslope | * | 11.0 ± 5.5 | 4.8 ± 3.2 |
*p<0.01; **p<0.00045; n.s., not significant; BBI, beat-to-beat intervals; SYS, systolic blood pressure; DIA, diastolic blood pressure.
BRS measures bslope and tslope revealed significant differences (p<0.01) between SZ and CO, namely a significant decrease in the BRS measures bslope and tslope was shown (table 2).
(c). Central–autonomic coupling: high-resolution joint symbolic dynamics
(i). Central–cardiac coupling results (BBI/PEEG)
HRJSD analyses revealed highly significant (p<0.00045) differences between SZ and CO in all eight CAC pattern families (PEEG/BBI, 8×8=64) for the entire frontal area, the left frontal area and the right frontal area (table 3). The patterns were characterized by decreased absolute values in SZ if the central pattern family PEEG-E0, PEEG-E1, PEEG-E2, PEEG-LU1, PEEG-LD1, PEEG-LA1, PEEG-P and PEEG-V was coupled with BBI-E0, BBI-E1, BBI-E2, BBI-LU1 and BBI-LD1. SZ values significantly increased if the central pattern family was coupled with BBI-LA1, BBI-P and BBI-V. Thereby, the central family patterns PEEG-E0 and PEEG-E2 significantly decreased, and PEEG-LA1 significantly increased in SZ, when compared with CO. The cardiac family patterns BBI-E0 and BBI-E2 highly significantly decreased, and BBI-LA1, BBI-P and BBI-V highly significantly increased in SZ, when compared with CO (table 4). The index HRJSDShannon did not reveal any significant differences between SZ and CO, regardless of the investigated frontal area (see also electronic supplementary material, table S1).
Table 3.
Number (N) of significant (p<0.01) HRJSD central–autonomic coupling indices p(N) used to discriminate between patients suffering from paranoid schizophrenia (SZ) and healthy subjects (CO) pertaining to the frontal area, the left frontal area and the right frontal area. BBI/PEEG indicates the coupling between beat-to-beat intervals (BBI) and the mean power in BBI-related EEG intervals (PEEG). SYS/PEEG indicates the coupling between the maximum systolic blood pressure amplitude values over time (SYS) and the mean power in the BBI-related EEG intervals (PEEG) (e.g. PEEG-E0/BBI describes the coupling of the pattern family E0 from PEEG with all other 8 BBI coupling pattern families (figure 3)).
| index | all frontal p(N) | left frontal p(N) | right frontal p(N) | index | all frontal p(N) | left frontal p(N) | right frontal p(N) |
|---|---|---|---|---|---|---|---|
| BBI/PEEG | SYS/PEEG | ||||||
| PEEG-E0/BBI | 6 | 5 | 4 | PEEG-E0/SYS | 5 | 4 | 4 |
| PEEG-E1/BBI | 5 | 5 | 5 | PEEG-E1/SYS | 8 | 8 | 8 |
| PEEG-E2/BBI | 5 | 5 | 4 | PEEG-E2/SYS | 6 | 4 | 5 |
| PEEG-LU1/BBI | 5 | 3 | 3 | PEEG-LU1/SYS | 8 | 6 | 5 |
| PEEG-LD1/BBI | 5 | 4 | 4 | PEEG-LD1/SYS | 8 | 6 | 5 |
| PEEG-LA1/BBI | 8 | 8 | 6 | PEEG-LA1/SYS | 8 | 6 | 5 |
| PEEG-P/BBI | 5 | 4 | 3 | PEEG-P/SYS | 8 | 8 | 8 |
| PEEG-V/BBI | 4 | 4 | 2 | PEEG-V/SYS | 8 | 8 | 4 |
Table 4.
Univariate statistical analysis results showing of the probability of the occurrence of univariate HRJSD pattern families for BBI, SYS and PEEG (figure 3) in % to discriminate between patients suffering from paranoid schizophrenia (SZ) and healthy subjects (CO) for the frontal area, the left frontal area and the right frontal area.
| all frontal | left frontal | right frontal | ||||
|---|---|---|---|---|---|---|
| index | CO mean±s.d. | SZ mean±s.d. | CO mean±s.d. | SZ mean±s.d. | CO mean±s.d. | SZ mean±s.d. |
| PEEG | ||||||
| PEEG-E0 | 1.9 ± 1.3** | 1.5 ± 0.9 | 1.9 ± 1.3** | 1.5 ± 0.9 | 1.9 ± 1.3* | 1.5 ± 0.9 |
| PEEG-E2 | 2.1 ± 1.3* | 2.6 ± 2.0 | 2.0 ± 1.3* | 2.6 ± 2.0 | 2.1 ± 2.0 | 2.6 ± 2.1 |
| PEEG-LA1 | 0.03 ± 0.1** | 0.3 ± 0.5 | 0.03 ± 0.1** | 0.3 ± 0.6 | 0.03 ± 0.1** | 0.3 ± 0.8 |
| BBI | ||||||
| BBI-E0 | 4.6 ± 2.4** | 2.1 ± 1.8 | 4.6 ± 2.4** | 2.1 ± 1.8 | 4.6 ± 2.4** | 2.1 ± 1.8 |
| BBI-E2 | 6.1 ± 3.5** | 3.0 ± 2.3 | 6.1 ± 3.5** | 3.0 ± 2.3 | 6.1 ± 3.5** | 3.0 ± 2.4 |
| BBI-LA1 | 0.03 ± 0.1** | 1.1 ± 2.1 | 0.03 ± 0.1** | 1.1 ± 2.1 | 0.03 ± 0.1** | 1.2 ± 2.2 |
| BBI-P | 2.4 ± 1.7** | 4.5 ± 3.5 | 2.4 ± 1.7** | 4.5 ± 3.4 | 2.4 ± 1.7** | 4.5 ± 3.5 |
| BBI-V | 2.9 ± 2.1** | 5.1 ± 4.2 | 2.9 ± 2.1* | 5.0 ± 4.2 | 2.9 ± 2.1* | 5.1 ± 4.3 |
| SYS | ||||||
| SYS-E0 | 1.7 ± 1.5** | 3.6 ± 3.3 | 1.7 ± 1.5** | 3.6 ± 3.4 | 1.7 ± 1.5** | 3.6 ± 3.4 |
| SYS-E1 | 61.0 ± 21.9** | 33.2 ± 31.3 | 61.0 ± 21.9** | 33.2 ± 31.3 | 61.0 ± 21.9** | 33.2 ± 31.3 |
| SYS-E2 | 1.9 ± 1.3** | 3.3 ± 2.7 | 1.9 ± 1.3** | 3.3 ± 2.7 | 1.9 ± 1.3** | 3.3 ± 2.8 |
| SYS-LU1 | 18.2 ± 9.5** | 27.9 ± 11.8 | 18.2 ± 9.5** | 28.0 ± 11.8 | 18.1 ± 9.5** | 27.9 ± 11.8 |
| SYS-LD1 | 15.9 ± 9.5** | 25.3 ± 11.9 | 15.9 ± 9.5** | 25.3 ± 11.9 | 15.9 ± 9.5** | 25.3 ± 11.9 |
| SYS-LA1 | 0.01 ± 0.03** | 0.3 ± 1.1 | 0.01 ± 0.03** | 0.3 ± 1.1 | 0.01 ± 0.03** | 0.4 ± 1.1 |
| SYS-P | 0.4 ± 0.7** | 3.0 ± 3.1 | 0.4 ± 0.7** | 3.0 ± 3.1 | 0.4 ± 0.7** | 3.0 ± 3.1 |
| SYS-V | 1.2 ± 1.7** | 4.6 ± 3.5 | 1.2 ± 1.7** | 4.6 ± 3.5 | 1.2 ± 1.7** | 4.6 ± 3.5 |
*p<0.01 significantly different between SZ and CO; **p<0.00045 significantly different between SZ and CO; BBI, beat-to-beat intervals; SYS, maximum systolic blood pressure amplitude values over time; PEEG, the mean power in the BBI-related EEG intervals.
(ii). Central–vascular coupling results (SYS/PEEG)
In contrast to the central–cardiac results, a higher number of significantly different central–vascular coupling pattern families (PEEG/SYS, 8×8=64) for the entire frontal area, left frontal area and right frontal area were found (table 3). In SZ patients, the absolute values of central–vascular coupling pattern families significantly decreased if the central pattern family PEEG-E0, PEEG-E1, PEEG-E2, PEEG-LU1, PEEG-LD1, PEEG-LA1, PEEG-P and PEEG-V were coupled with SYS-E1. They significantly increased if the central pattern family PEEG-E0, PEEG-E1, PEEG-E2, PEEG-LU1, PEEG-LD1, PEEG-LA1, PEEG-P and PEEG-V were coupled with SYS-E0, SYS-E2, SYS-LU1, SYS-LD1, SYS-LA1, SYS-P and SYS-V (table 3). In addition, the absolute values of central family patterns PEEG-E0 and PEEG-E2 significantly decreased, and PEEG-LA1 significantly increased in SZ when compared with CO. The values of vascular family patterns SYS-E0, SYS-E2, SYS-LU1, SYS-LD1, SYS-LA1, SYS-P and SYS-V highly significantly (p<0.00045) increased in SZ when compared with CO (table 4). HRJSDShannon values significantly increased in SZ patients when compared with CO for the entire frontal area (CO: 2.7±0.9, SZ: 3.0±1.2, p<0.00045), the left frontal area (CO: 2.7±0.9, SZ: 3.0±1.2, p<0.00045) and the right frontal area (CO: 2.6±0.9, SZ: 3.0±1.2, p<0.01) (see also the electronic supplementary material, table S1).
(d). Central–autonomic coupling: normalized short-time partial-directed coherence
(i). Cardiovascular coupling results (BBI/SYS)
NSTPDC results revealed a significant NF between SZ (NF: −0.48±0.81) and CO (NF: −0.66±0.52). With regard to SZ, the mean NF was nearly −0.5, indicating a reduced bidirectional coupling from SYS→BBI, the driver being SYS and BBI the target variable. Additionally, ASYS→BBI as marker for the coupling strength was highly significantly different between SZ (0.39±0.16) and CO (0.43±0.14) (p<0.00045). In this case, SYS influenced BBI (baroreflex loop) to the extent that a decrease in coupling strength was found. This indicates a weaker causal influence of SYS on BBI (table 5).
Table 5.
Univariate statistical analysis results of NSTPDC for causal central–autonomic coupling to discriminate between patients suffering from paranoid schizophrenia (SZ) and healthy subjects (CO) for the frontal area, the left frontal area and the right frontal area.
| all frontal | left frontal | right frontal | ||||
|---|---|---|---|---|---|---|
| index | CO mean±s.d. | SZ mean±s.d. | CO mean±s.d. | SZ mean±s.d. | CO mean±s.d. | SZ mean±s.d. |
| BBI/PEEG | ||||||
| NF | −0.64 ± 0.86* | −0.81 ± 1.03 | −0.64 ± 0.83 | −0.78 ± 1.05 | −0.65 ± 0.90 | −0.85 ± 1.00 |
| ABBI→PEEG | 0.10 ± 0.05 | 0.09 ± 0.06 | 0.10 ± 0.05 | 0.09 ± 0.06 | 0.10 ± 0.05 | 0.09 ± 0.06 |
| APEEG→BBI | 0.23 ± 0.16 | 0.26 ± 0.17 | 0.22 ± 0.15 | 0.25 ± 0.16 | 0.23 ± 0.17 | 0.28 ± 0.18 |
| SYS/PEEG | ||||||
| NF | 0.00 ± 1.07** | −0.70 ± 0.94 | 0.04 ± 1.02** | −0.64 ± 0.95 | −0.04 ± 1.13** | −0.77 ± 0.92 |
| ASYS→PEEG | 0.13 ± 0.07** | 0.10 ± 0.06 | 0.13 ± 0.07** | 0.10 ± 0.06 | 0.13 ± 0.08** | 0.09 ± 0.07 |
| APEEG→SYS | 0.14 ± 0.10** | 0.20 ± 0.13 | 0.14 ± 0.10** | 0.19 ± 0.12 | 0.14 ± 0.10** | 0.21 ± 0.14 |
*p<0.01 significantly different between SZ and CO; **p<0.00045 significantly different between SZ and CO; BBI, beat-to-beat intervals; SYS, maximum systolic blood pressure amplitude values over time; PEEG, the mean power in BBI-related EEG intervals.
(ii). Central–cardiac coupling results (BBI/PEEG)
When considering the coupling of BBI with PEEG, only the NF revealed a significant (p<0.01) difference between SZ and CO in the entire frontal area. Thereby, mean NF was nearly −0.8, pointing to bidirectional coupling from PEEG→BBI, with the driver being PEEG, and BBI the target variable (table 5).
(iii). Central–vascular coupling results (SYS/PEEG)
When coupling the vascular system (SYS) with the central activity (PEEG), it becomes apparent that the NF was highly significantly (p<0.00045) different between SZ and CO for the entire frontal area, the left frontal area and the right frontal area. Here, CO showed mean NF values of nearly 0, indicating an equal coupling influence in both directions. On the contrary, SZ showed mean NF values of −0.6 to −0.8, pointing to bidirectional coupling from PEEG→SYS (with driver PEEG). These results were supported by ASYS→PEEG and APEEG→SYS for CO, revealing nearly the same values for both directions. Both indices ASYS→PEEG and APEEG→SYS were highly significantly (p<0.00045) different between SZ and CO for the whole frontal area, the left frontal area and the right frontal area. When SYS influences PEEG (SYS→PEEG), the coupling strength was significantly reduced in SZ in comparison with CO. However, when PEEG influences SYS (PEEG→SYS), the coupling strength was significantly increased in SZ when compared with CO (table 5 and figure 4).
Figure 4.

Averaged NSTPDC plots for central–autonomic coupling analyses for (a) healthy subjects and (b) schizophrenic patients. Arrows indicate the causal coupling direction from one time series to another, e.g.  , indicating the causal link from PEEG to SYS. Coupling strength ranges from blue (no coupling) to red (maximum coupling), where SYS represents successive maximum systolic blood pressure amplitude values over time, and PEEG represents the mean power in BBI-related EEG intervals.
(iv). Central–cardiac coupling results (BBI/PEEGband)
For all spectral bands, NSTPDC results revealed significantly (p<0.00045) decreased coupling strengths from the EEG spectral power bands towards BBI (APEEGband→BBI) for the whole frontal area, the left frontal area and the right frontal area in SZ when compared with CO. Thereby, in PEEGγ, the strongest influence of central γ activity towards BBI was found for both SZ and CO. With regard to the coupling direction of BBI towards PEEGband, we found in the coupling strengths for the whole frontal area only in PEEGβ, PEEGβ1, PEEGδ and PEEGθ significant increases in ABBI→PEEGband for SZ in comparison with CO. Regarding the left frontal area, only in PEEGβ1 and PEEGθ were significant increases in the coupling strengths (ABBI→PEEGband) found for SZ, when compared with CO. Regarding the right frontal area, in PEEGα1, PEEGβ1, PEEGδ and PEEGθ significant increases in the coupling strengths (ABBI→PEEGband) could be shown for SZ (figure 5).
Figure 5.

Visualization of significant differences between patients suffering from paranoid schizophrenia (SZ) and healthy subjects (CO) with respect to the coupling strength (NSTPDC) between autonomic activity (BBI, SYS) and central spectral activity (PEEGband) for (a) the whole frontal area, (b) the left frontal area and (c) the right frontal area. Arrows indicate the coupling direction, where black solid lines indicate the direction from central spectral activity towards autonomic target variables. Grey dashed lines indicate the direction from the autonomic variables towards central spectral activity. Note that all arrows were highly significantly (p<0.00045) different between SZ and CO; otherwise, the arrows were indicated by *(p<0.01). BBI, beat-to-beat intervals; SYS, maximum systolic blood pressure amplitude values over time; PEEGband, the mean power in BBI-related EEG spectral band intervals.
Considering the NF values for all couplings between BBI and PEEGband, SZ revealed generally increased NF values in comparison with CO. For the entire frontal area, left frontal area and right frontal area, the coupling directions were bidirectional, with BBI acting as the driver (electronic supplementary material, table S3). Only for PEEGδ and PEEGγ was equal influence present in both directions (see also electronic supplementary material, table S2).
(v). Central–vascular coupling results (SYS/PEEGband)
For the coupling of SYS with spectral power bands, we found for the direction of EEG spectral power bands towards SYS (APEEGband→SYS) an opposite behaviour, as shown by PEEGband→BBI (where significant coupling strengths were found here for all bands and all frontal areas; electronic supplementary material, table S3). Regarding the entire frontal area (PEEGα,PEEGα2) and the left frontal area (PEEGα,PEEGα1,PEEGα2) significant increases in APEEGband→SYS for SZ in comparison with CO were found. Again, in PEEGγ, the strongest influence of central γ activity towards SYS could be found for both SZ and CO. In the opposite direction, namely from SYS towards PEEGband, we found for the frontal area in all spectral bands (PEEGband) highly significant decreased coupling strengths in SZ when compared with CO. For the left frontal area besides PEEGγ and PEEGθ and for the right frontal area besides PEEGδ, PEEGγ and PEEGθ for all other bands showed significantly different coupling strengths between SZ and CO.
With respect to NF, there was generally a bidirectionality found for EEG spectral power bands (PEEGδ, PEEGθ, PEEGβ, PEEGβ1, PEEGβ2), with SYS acting as the driver. Furthermore, there was a unidirectional coupling for PEEGα, PEEGα1 and PEEGα2 and an equal influence in both directions for PEEGγ for the entire frontal area, as well as for the left and right frontal areas. In the α bands and β2 band, NF was decreased in SZ when compared with CO (see also electronic supplementary material, table S2).
4. Discussion
Our study has revealed highly significantly increased heart rates, reduced HRV, decreased BRS, a reduced EEG activity (power) independent from frequency range and frontal area or left hemisphere area, as well as altered CAC in patients with schizophrenia, when compared with healthy subjects. In particular, CAC revealed that the influence of central activity towards SYS was more strongly pronounced than that towards BBI in SZ patients, when compared with CO subjects. In addition, CAC patterns in SZ were mainly characterized by a larger amount of increased short-term alternating and strongly decreasing central patterns (PEEG-LA1, PEEG-E0), as well as more widely distributed alternating and fluctuating heart rate patterns (LA1, P, V). SZ patients' CAC patterns were also characterized by a larger amount of increased short-term strong/weak increasing/decreasing, alternating and fluctuating SYS pattern families (E0, E2, LU1, LD1, LA1, P, V), as well as invariable SYS (E1), in comparison with CO subjects.
(a). Heart rate and blood pressure variability
Our findings in relation to HRV are in accordance with other studies that have revealed an altered autonomic tone in treated schizophrenic patients. Psychiatrists attributed the increased heart rates (meanNN↓) of schizophrenia patients to their antipsychotic treatment. This assumption is only somewhat correct, because treatment with clozapine, for instance, is associated with a reduced vagal function and increased heart rates [40]. It was shown that clozapine, quetiapine and amisulpride revealed stronger anticholinergic side effects of cholinergic or adrenergic receptors on ANS modulation than olanzapine [41]. In addition, Agelink et al. [42] investigated the effects of atypical antipsychotics on autonomic neurocardiac function, showing that only amisulpride did not significantly alter HRV owing to its lack of activity at cholinergic or adrenergic receptors. Bär et al. [43] found a reduction in the complexity of heart rate regulation after olanzapine treatment, measured by compression entropy. Thus, the authors suggested a decreased cardiac vagal function that could increase the risk for cardiac mortality. Although we found some indication of increased sympathetic modulation, their results seemed to be restricted to heart rate regulation and not to blood pressure [44]. Thus, a cardiac dysfunction in SZ does not reflect a simple stress-induced arousal, but rather chronic and distinct changes of heart rate and respiratory regulation [37].
(b). Baroreflex sensitivity
When considering BRS, we found significantly reduced tachycardic (tslope) and bradycardic (bslope) slopes in accordance with other studies investigating unmedicated patients [35,45]. The decrease of efferent vagal activity and the inhibition of baroreflex vagal bradycardia in SZ might be caused by stress owing to psychotic experiences or to the psychosis itself, a process that allows the organism under physiological conditions to adjust to demanding environmental stress [40].
(c). Frontal electroencephalogram analysis results
The results of central activity (via EEG frequency analyses) showed a highly significantly reduced EEG activation (power) in all frequency bands from the frontal lobe, being much more pronounced in the right frontal hemisphere when compared with CO. Recently, MacCrimmon et al. [46] investigated the effects of the atypical antipsychotic clozapine among 64 SZ patients. They found that clozapine augments power globally in the δ and θ bands, but this effect was more pronounced over frontal areas. The authors could demonstrate a significant clozapine-induced α topographic shift frontally and to the right. They suggested further investigations of subcortical structures in an attempt to better understand the diverse aetiologies and optimal treatments of the schizophrenias. Small et al. [47] investigated chronic treatment-resistant patients in relation to placebo, haloperidol, chlorpromazine and clozapine treatment. They found increased frontal δ activity particularly with clozapine and chlorpromazine treatment. Nagase et al. [48] investigated 12 medicated SZ patients, finding that α2 power and slow-wave power were reduced when compared with the neuroleptic-naive state. They concluded that the reduction in α power may occur from the early stage of the disease and progress even further, even though the patients are medicated and clinically improved. Kemali et al. [49] found that after acute treatment, patients showed a significant decrease of δ and an increase of θ2, β1 and β2. After 28 days of haloperidol treatment, similar changes were observed for δ, together with an increase of α1, and a decrease of fast β. Light et al. [50] found that schizophrenia patients have frequency-specific deficits in the generation and maintenance of coherent γ-range oscillations, reflecting a fundamental degradation of the basic integrated neural network activity. In general, γ responses in schizophrenic patients are not necessarily weakened. Depending on the status of the schizophrenic behaviour (negative or positive symptoms) and depending on the difficulty of the applied paradigm, an increase of γ activity may also be observed. Thus, the oscillatory dynamics in schizophrenia also depict the unstable behaviour of electrophysiology in this disease [51]. Patients who were treated with clozapine and olanzapine revealed most prominent changes in the anterior cingulate and medial frontal cortex and a decrease in fast frequency activities in the occipital cortex. These results suggest a compensatory mechanism in the neurobiological substrate for schizophrenia [52]. Unfortunately, at the moment, comparative studies between medicated and unmedicated patients are not available in the literature. This makes it difficult to assess the effectiveness of medication and the effect of central activity in schizophrenia patients. It was shown in many studies on medicated and non-medicated patients that the γ response is lower in SZ patients when compared with healthy subjects [51,53]. Nevertheless, it is strongly justified, based on available literature, to conclude that the δ excess (and to a lesser extent the θ excess) is a strong and bona fide biological marker for schizophrenia, as well as the fact that changes in EEG patterns are not medication-induced [54].
(d). Cardiovascular coupling
Cardiovascular coupling results based on NSTPDC analysis revealed a reduced bidirectional coupling and a reduced coupling strength from SYS→BBI in SZ, supporting the decreased BRS results. Due to the fact that SYS were not significantly changed in SZ, independent of medication usage when compared with CO, it can be assumed that the primary BRS changes in SZ were a result of impaired heart rate regulation. It was shown that during stressful conditions such as mental stress (supposedly present in SZ), the arterial baroreflex was generally inhibited. From the point of view that central mechanisms are involved in BRS regulation, central sites proven to elicit the facilitation are the medial prefrontal cortex, the preoptic/anterior hypothalamus, the ventrolateral part of the periaqueductal grey matter and the nucleus raphe magnus [55].
(e). Central–vascular coupling
Central–vascular coupling analyses demonstrated that the coupling strength was highly significantly reduced in SZ for the direction SYS towards central activity (ASYS→PEEG). For the opposite direction from central activity towards SYS, the coupling strength (APEEG→SYS) was highly significantly increased in SZ when compared with CO. Central–vascular coupling in SZ pointed to a bidirectional one with the central driver (PEEG→SYS), whereas the direction for CO was equal in both directions ( ). This suggests that the closed-loop regulation process of central–vascular regulation in SZ is more strongly focused on maintaining/regulating the blood pressure than this regulation process for CO. In the case of SZ, the central part of this closed loop seems to more strongly influence the autonomic system (SYS). This closed loop in CO indicates a balanced condition (APEEG→SYS corresponding to ASYS→PEEG, NF approx. 0).
Central–vascular coupling by HRJSD in SZ was dominated mainly by highly variable SYS patterns in combination with all other eight central pattern families. This was demonstrated by highly significantly decreased SYS-E1 and highly significantly increased SYS-E0, SYS-E2, SYS-LU1, SYS-LD1, SYS-LA1, SYS-P and SYS-V. It seems to be that the blood pressure regulation is more complex and mainly influences the central–vascular coupling pattern in SZ. Furthermore, it could be shown that central–vascular coupling is strongly affected by reduced BPV (SYS-E1) and short-term strong/weak, increasing/decreasing, alternating and fluctuating vascular family patterns (SYS-E0, SYS-E2, SYS-LU1, SYS-LD1, SYS-LA1, SYS-P, SYS-V), in combination with central activity. We could also found that the complexity of the central–vascular coupling is significantly increased in SZ when compared with CO.
(f). Central–cardiac coupling
Central–cardiac coupling was characterized as bidirectional, with central driving mechanisms (PEEG→BBI) towards autonomic system (BBI) in SZ and CO. For both groups, central activity is much stronger towards the autonomic system than in the opposite direction. However, the results indicated that, for SZ, this closed-loop interaction does not work well owing to the known significant heart rate changes for those patients [37,56]. It is presumed that lesions within the CNS may result in profound alterations in cardiac regulation and may even result in potentially fatal cardiac arrhythmias or sudden cardiac death (owing to cardiovascular dysfunctions) [57]. The possibility that greater levels of cerebral dysfunction are associated with an increasing severity of cardiovascular dysfunction [57] were determined by the overall changes in heart rate and blood pressure in SZ patients, thus posing an increased risk of sudden cardiac death for these patients. It has been assumed that an abnormal interplay between frontocingulate and subcortical brain areas can lead to abnormal autonomic arousal, being expressed as a functional disconnection in autonomic and central systems when patients with paranoid schizophrenia process threat-related signals [9]. Thus, the supposition is that paranoid cognition may reflect an internally generated cycle of misattribution regarding incoming fear signals owing to a breakdown in the regulation of these systems resulting in an altered brain–heart interaction, influenced by a lack of cortical inhibitory control over sympathoexcitatory subcortical regions [9]. Thayer et al. showed that resting HRV is tied to the functioning of frontal–subcortical circuits, in the way that a higher resting HRV is associated with the effective functioning of frontal-top-down control over subcortical brain regions that support flexible and adaptive responses to environmental demands [12]. It is worth noting that the disruption of frontal–subcortical circuits has been associated with a wide range of psychopathologies, including SZ [15]. HRJSD results demonstrated that central–cardiac coupling in SZ was mainly characterized by a larger amount of decreased short-term strong/weak, increasing/decreasing central pattern families (PEEG-E0, PEEG-E1, PEEG-E2, PEEG-LU1, PEEG-LD1) and an increased alternating and fluctuating of central pattern families (PEEG-LA1, PEEG-P and PEEG-V). This means that central activity is much more variable and more random, with weaker rhythmic oscillatory components. Moreover, fast alterations of increased and subsequently decreased (BBI-P), fast alterations of decreased and subsequently increased (BBI-V) and alternating (BBI-LA1) of heart rate patterns were increased for SZ compared with CO, indicating a more random central–cardiac coupling with weaker rhythmic components of cardiac cycle intervals in relation to central activity in SZ. Schulz et al. [35] could also demonstrate that autonomic regulation in medicated SZ patients seems to be partly dominated by an increasing amount of invariable heart rate patterns (BBI-E1, BBI-LA1, BBI-V), in combination with alternating SYS (SYS-E2, SYS-LU1, SYS-P). These results suggest an impairment of the baroreflex control feedback loop. They assumed that these effects are probably related to the anticholinergic effects of the antipsychotic treatment. Being a unique feature of the HRJSD approach in contrast to other coupling approaches, we could clearly identify different altered central–autonomic physiological regulatory patterns generated by the interplay of the CNS and the ANS in patients with schizophrenia. One of our results to be highlighted is the finding that, in schizophrenic patients, the central activity had a much stronger variability and higher degree of randomness with less rhythmic oscillatory components than the central activity in healthy controls. From the aspect of biomedical signal processing based on symbolic analysis, the HRJSD approach, based on a redundancy reduction strategy and grouping of single-word types into eight pattern families, enables a detailed description and quantification of bivariate couplings. As a further unique feature in contrast to the classical JSD approach and other coupling approaches [58,59], HRJSD emphasizes a clear characterization of how the couplings are composed, with regard to the different regulatory aspects of the CNS and ANS. To summarize, the applied HRJSD approach creates a bridge between univariate and bivariate symbolic analyses, allowing the quantification and classification of deterministic regulatory bivariate coupling patterns depending on the experimental conditions at hand [35].
(g). Central–autonomic coupling
It was stated by Williams et al. [9]: ‘that paranoid schizophrenia is characterized by a specific disjunction of arousal and amygdala-prefrontal circuits that leads to impaired processing of significant, particularly threat-related, signals. The pattern of excessive arousal but reduced amygdala activity in paranoid patients points to a dysregulation in the normal cycle of mutual feedback between amygdala function and somatic state (autonomic activity). The concomitant lack of ‘with-arousal’ medial prefrontal engagement suggests that this region cannot undertake its usual role in regulating amygdala-autonomic function, leading to a perseveration and exacerbation of arousal responses’. The precise mechanism of ANS dysregulation in SZ still remains unclear, complicated by the large number of cortical, subcortical and brainstem structures that coordinate autonomic function. However, it was suggested that reduced HRV may represent evidence of an inhibitory deficit that is mirrored by impaired cognitive and behavioural inhibition [60,61]. Moreover, it was shown that the prefrontal cortex could play a critical role in ANS dysregulation and that SZ patients are characterized by a decrease in their prefrontal cortex activity and concomitant deficits in executive function and inhibition [60,61]. Thayer & Lane [60] also proposed that ANS dysregulation is driven by the failure of the prefrontal cortex to inhibit the amygdala-mediating cardiovascular and autonomic responses to stress.
They further [14] emphasized the importance of the medial prefrontal cortex as the ‘core integration’ system owing to its assumed critical role in the representation of internally and externally generated information, as well as its integrative function to regulate behaviour and to adapt peripheral physiology. Furthermore, when integrating findings from research concerning the central and cardiovascular effects of increasing emotional intensity, the suggestion is posed that changes in functional central system activation and changes in heart rate and blood pressure are related. Especially noteworthy is the proof that the left and right central hemispheres are specialized for parasympathetic and sympathetic control of cardiovascular functioning [57]. Tanida et al. could show that mental arithmetic (MA) task induced larger activity in the right prefrontal cortex than that in the left prefrontal cortex in subjects with high heart rate increases, suggesting that the right prefrontal cortex activity during MA task has a greater role in the central regulation of heart rate owing to virtue of decreasing parasympathetic effects or increasing sympathetic effects [62]. The relationship between autonomic functioning and cognitive performance in patients with schizophrenia is still exclusive. Mathewson et al. [63] are the first to show associations between autonomic regulatory capacity and neuropsychological performance in patients with schizophrenia. In particular, susceptibility to perseveration in patients was associated with faster heart rates at rest and reduced vagal modulation. Moreover, the authors suggest that the executive function deficits in schizophrenia and autonomic deficiencies reported in this population should be investigated jointly. Unfortunately, neuronal effects of cardiac autonomic dysfunction have not yet been investigated in schizophrenia patients. However, the assumption exists/it has been assumed that an abnormal interplay between frontocingulate and subcortical brain areas can lead to abnormal autonomic arousal [9].
Considering central–cardiac coupling and central–vascular coupling with respect to central spectral power bands, the strongest influence of cerebral γ activity towards BBI and SYS was found for both SZ (here reduced) and CO, independent of the brain hemisphere. This highlights the role of γ activity in SZ and was also demonstrated in multiple studies [51,64]. It was shown that γ and β activity is most augmented in SZ over frontal and temporal brain regions, reflecting a genetic liability for schizophrenia [65]. It was suggested that impaired neural oscillation (e.g. a reduction in amplitude and altered phase synchronization in all frequency bands with emphasis on the β and γ band activity) in schizophrenia patients can be considered a marker for a functional disconnectivity between different brain areas and for dysfunctional cortical networks [66]. Moreover, studies also showed that the parasympathetic and sympathetic nervous systems are lateralized to the left and right central hemispheres, respectively. Furthermore, researchers have proposed that increasing levels of central activation within the left hemisphere are associated with increasing parasympathetic tone [57]. Thus, the differences in central activity in SZ between the two hemispheres would determine the overall changes in heart rate and blood pressure [57]. The central–cardiac and central–vascular coupling directions with respect to central spectral power bands were characterized as bidirectional with BBI and SYS acting as the driver in each frequency band. This may suggest that the autonomous system provides feedback information towards the different central oscillatory components (with the exception of γ). All these components considered together as the whole central activity provide, in turn, feed-forward information to the ANS.
(h). Limitations and ideas for further research
A limitation of this study is that SZ patients received antipsychotic treatment. However, on the one hand, it is very difficult to recruit unmedicated patients for such investigations due to the fact that the patients are very instable in their psychotic states and are also less cooperative. While antipsychotic drugs provide a basic therapeutic tool for the treatment of schizophrenia and other psychotic conditions, their effectiveness is associated with a series of unresolved questions. It is not clear, for example, which of the neurobiological mechanisms (beyond D 2 receptor-blocking) is the final therapeutic target responsible for the beneficial effect on distorted information processing in schizophrenia, and for subsequent elimination or reduction of psychotic symptoms [52]. On the other hand, some studies exist [46,48,51,52,64] where the effect of various atypical antipsychotic drugs in schizophrenic patients via quantitative EEG analysis methods are compared. They revealed that in clozapine and olanzapine an increase in slow frequency bands were found, both in routinely treated patients and in healthy volunteers after a single dose and that risperidone produces fewer changes than clozapine and olanzapine [52]. In further research, we will also investigate the couplings of central activity and respiration as well as of electrodermal activity coupling since it was clearly hallmarked that these autonomic variables were significantly altered in SZ [36,37,67]. However, in this study, we did not find any significant differences in respiratory-related variables (electronic supplementary material, table S4). At the moment, we have focused our investigation on short-term instantaneous CAC in the frontal area. However, it is not clear if these CAC are changing over longer time (time-variant) and if they are possibly concentrated in specific frontal areas (clusters). Therefore, time-variant analyses and topographical EEG cluster analyses (some EEG electrodes were formed to a cluster) are necessary. Moreover, to solve these open questions, in addition, functional magnetic resonance imaging (fMRI) data analyses are necessary. However, the advantage of using the EEG technique instead of fMRI is that EEG has a very good temporal resolution. This allows a very good characterization of the central–autonomic network (CAN). The EEG covers many cortical regions of the CAN. In comparison, fMRI has a very good spatial resolution with a very slow response (shown by the BOLD signal). Thus, fMRI does not seem to be the best technique to characterize ANS alterations owing to its slow signal response (BOLD). Therefore, EEG seems to be the more adequate technique in order to establish an association/connection between central activity (cortical EEG) and autonomic function (cardiovascular). However, the EEG is unable to investigate anatomical connectivity owing to its poor spatial resolution.
5. Conclusion
This study is the starting point for an enhanced understanding of the complex brain–heart network between central activity and cardiovascular regulation in SZ patients. We are currently just beginning to understand the interrelationship between the autonomic system in psychotic states, the central networks and control mechanisms in SZ patients. Moreover, we hypothesize that an improvement in autonomic functioning could be achieved through physical fitness (sport intervention), for example, which, in turn, would lead to an improvement in these patients' clinical symptoms. Additional studies are nevertheless needed. To conclude, the scientific impact of this study marks a further step towards a more comprehensive understanding of the interplay of neuronal and autonomic regulatory processes in schizophrenia patients. At the same time, greater insight has now been provided regarding the complex relationship between psychotic stages and (cardiac) autonomic activity. This study may thus contribute to an optimal selection of therapy strategies that would lead to more successful therapy plans for these patients in the future.
Supplementary Material
Supplementary Material
Supplementary Material
Supplementary Material
Supplementary Material
Data accessibility
Results supporting this article have been uploaded as part of the electronic supplementary material (see tables S1–S4). An exemplary dataset of one schizophrenic patient and one healthy subject supporting this article has been uploaded as part of the electronic supplementary material, in the file Schulz_etal_RSTA-2015–0178.zip. All the used data are the property of the University Hospital Jena, Germany and it is strictly forbidden to pass on or distribute all the data online. However, those interested in using the data should contact the authors to prepare an appropriate cooperation.
Author' contributions
S.S., calculation, analyses and interpretation of central–autonomic indices, manuscript writing. K.-J.B., study design, patient recruitment and study supervision. M.B., study design and measurement of physiological biosignals. A.V., supervision of central–autonomic indices, result interpretation. All authors contributed to and approved the final manuscript.
Competing interests
We declare we have no competing interests.
Funding
This work was partly supported by grants from the Thuringian Ministry of Economy, Labour and Technology, and European Social Fund (ESF) 2014 KN 0018, as well as by grants from the Federal Ministry for Economic Affairs and Energy (BMWI) KF 2447308KJ4.
References
- 1.Hennekens CH, Hennekens AR, Hollar D, Casey DE. 2005. Schizophrenia and increased risks of cardiovascular disease. Am. Heart J. 150, 1115–1121. ( 10.1016/j.ahj.2005.02.007) [DOI] [PubMed] [Google Scholar]
- 2.Laursen TM, Nordentoft M, Mortensen PB. 2014. Excess early mortality in schizophrenia. Annu. Rev. Clin. Psychol. 10, 425–448. ( 10.1146/annurev-clinpsy-032813-153657) [DOI] [PubMed] [Google Scholar]
- 3.McGrath J, Saha S, Chant D, Welham J. 2008. Schizophrenia: a concise overview of incidence, prevalence, and mortality. Epidemiol. Rev. 30, 67–76. ( 10.1093/epirev/mxn001) [DOI] [PubMed] [Google Scholar]
- 4.Saha S, Chant D, McGrath J. 2007. A systematic review of mortality in schizophrenia: is the differential mortality gap worsening over time? Arch. Gen. Psychiatry 64, 1123–1131. ( 10.1001/archpsyc.64.10.1123) [DOI] [PubMed] [Google Scholar]
- 5.Brown S. 1997. Excess mortality of schizophrenia. A meta-analysis. Br. J. Psychiatry 171, 502–508. ( 10.1192/bjp.171.6.502) [DOI] [PubMed] [Google Scholar]
- 6.Ringen PA, Engh JA, Birkenaes AB, Dieset I, Andreassen OA. 2014. Increased mortality in schizophrenia due to cardiovascular disease—a non-systematic review of epidemiology, possible causes, and interventions. Front. Psychiatry 5, 137 ( 10.3389/fpsyt.2014.00137) [DOI] [PMC free article] [PubMed] [Google Scholar]
- 7.Straus SMJM, Bleumink GS, Dieleman JP, van der Lei J, 't Jong GW, Kingma JH, Sturkenboom MC, Stricker BH. 2004. Antipsychotics and the risk of sudden cardiac death. Arch. Intern. Med. 164, 1293–1297. ( 10.1001/archinte.164.12.1293) [DOI] [PubMed] [Google Scholar]
- 8.Bär K-J, Boettger MK, Berger S, Baier V, Sauer H, Yeragani VK, Voss A. 2007. Decreased baroreflex sensitivity in acute schizophrenia. J. Appl. Physiol. (1985) 102, 1051–1056. ( 10.1152/japplphysiol.00811.2006) [DOI] [PubMed] [Google Scholar]
- 9.Williams LM. et al. 2004. Dysregulation of arousal and amygdala-prefrontal systems in paranoid schizophrenia. Am. J. Psychiatry 161, 480–489. ( 10.1176/appi.ajp.161.3.480) [DOI] [PubMed] [Google Scholar]
- 10.Ruiz-Padial E, Sollers JJ, Vila J, Thayer JF. 2003. The rhythm of the heart in the blink of an eye: emotion-modulated startle magnitude covaries with heart rate variability. Psychophysiology 40, 306–313. ( 10.1111/1469-8986.00032) [DOI] [PubMed] [Google Scholar]
- 11.Hansen AL, Johnsen BH, Thayer JF. 2003. Vagal influence on working memory and attention. Int. J. Psychophysiol. 48, 263–274. ( 10.1016/S0167-8760(03)00073-4) [DOI] [PubMed] [Google Scholar]
- 12.Thayer JF, Lane RD. 2000. A model of neurovisceral integration in emotion regulation and dysregulation. J. Affect. Disord. 61, 201–216. ( 10.1016/S0165-0327(00)00338-4) [DOI] [PubMed] [Google Scholar]
- 13.Heatherton TF, Wagner DD. 2011. Cognitive neuroscience of self-regulation failure. Trends Cogn. Sci. 15, 132–139. ( 10.1016/j.tics.2010.12.005) [DOI] [PMC free article] [PubMed] [Google Scholar]
- 14.Thayer JF, Åhs F, Fredrikson M, Sollers JJ, Wager TD. 2012. A meta-analysis of heart rate variability and neuroimaging studies: implications for heart rate variability as a marker of stress and health. Neurosci. Biobehav. Rev. 36, 747–756. ( 10.1016/j.neubiorev.2011.11.009) [DOI] [PubMed] [Google Scholar]
- 15.Callicott JH, Mattay VS, Verchinski BA, Marenco S, Egan MF, Weinberger DR. 2003. Complexity of prefrontal cortical dysfunction in schizophrenia: more than up or down. Am. J. Psychiatry 160, 2209–2215. ( 10.1176/appi.ajp.160.12.2209) [DOI] [PubMed] [Google Scholar]
- 16.Harvey PD, Howanitz E, Parrella M, White L, Davidson M, Mohs RC, Hoblyn J, Davis KL. 1998. Symptoms, cognitive functioning, and adaptive skills in geriatric patients with lifelong schizophrenia: a comparison across treatment sites. Am. J. Psychiatry 155, 1080–1086. ( 10.1176/ajp.155.8.1080) [DOI] [PubMed] [Google Scholar]
- 17.Brum PC, Da Silva GJJ, Moreira ED, Ida F, Negrao CE, Krieger EM. 2000. Exercise training increases baroreceptor gain sensitivity in normal and hypertensive rats. Hypertension 36, 1018–1022. ( 10.1161/01.HYP.36.6.1018) [DOI] [PubMed] [Google Scholar]
- 18.Negrao CE. et al. 1993. Effect of exercise training on RSNA, baroreflex control, and blood pressure responsiveness. Am. J. Physiol. 265, R365–R370. [DOI] [PubMed] [Google Scholar]
- 19.Sugawara J, Murakami H, Maeda S, Kuno S, Matsuda M. 2001. Change in post-exercise vagal reactivation with exercise training and detraining in young men. Eur. J. Appl. Physiol. 85, 259–263. ( 10.1007/s004210100443) [DOI] [PubMed] [Google Scholar]
- 20.Dampney RA. 1994. Functional organization of central pathways regulating the cardiovascular system. Physiol. Rev. 74, 323–364. [DOI] [PubMed] [Google Scholar]
- 21.McAllen RM. 1976. Inhibition of the baroreceptor input to the medulla by stimulation of the hypothalamic defence area. J. Physiol. 257, 45–46. ( 10.1113/jphysiol.1976.sp011355) [DOI] [PubMed] [Google Scholar]
- 22.Taylor EW, Al-Ghamdi MS, Ihmied IH, Wang T, Abe AS. 2001. The neuranatomical basis of central control of cardiorespiratory interactions in vertebrates. Exp. Physiol. 86, 771–776. ( 10.1111/j.1469-445X.2001.tb00043.x) [DOI] [PubMed] [Google Scholar]
- 23.Owens NC, Verberne AJ. 2000. Medial prefrontal depressor response: involvement of the rostral and caudal ventrolateral medulla in the rat. J. Auton. Nerv. Syst. 78, 86–93. ( 10.1016/S0165-1838(99)00062-4) [DOI] [PubMed] [Google Scholar]
- 24.Shoemaker JK, Norton KN, Baker J, Luchyshyn T. 2015. Forebrain organization for autonomic cardiovascular control. Auton. Neurosci. 188, 5–9. ( 10.1016/j.autneu.2014.10.022) [DOI] [PubMed] [Google Scholar]
- 25.Ziegler G, Dahnke R, Yeragani VK, Bär K-J. 2009. The relation of ventromedial prefrontal cortex activity and heart rate fluctuations at rest. Eur. J. Neurosci. 30, 2205–2210. ( 10.1111/j.1460-9568.2009.07008.x) [DOI] [PubMed] [Google Scholar]
- 26.Beissner F, Meissner K, Bär K-J, Napadow V. 2013. The autonomic brain: an activation likelihood estimation meta-analysis for central processing of autonomic function. J. Neurosci. 33, 10 503–10 511. ( 10.1523/JNEUROSCI.1103-13.2013) [DOI] [PMC free article] [PubMed] [Google Scholar]
- 27.Thayer JF, Friedman BH. 2004. A neurovisceral integration model of health disparities in aging. In Critical perspectives on racial and ethnic differences in health in late life (eds NB Anderson, RA Bulato, B Cohen), pp. 567–603. Washington, DC: The National Academies Press. [PubMed] [Google Scholar]
- 28.Waldstein SR, Kop WJ, Schmidt LA, Haufler AJ, Krantz DS, Fox NA. 2000. Frontal electrocortical and cardiovascular reactivity during happiness and anger. Biol. Psychol. 55, 3–23. ( 10.1016/S0301-0511(00)00065-X) [DOI] [PubMed] [Google Scholar]
- 29.Thayer JF. 2007. What the heart says to the brain (and vice versa) and why we should listen. Psychol. Top. 16, 241–250. [Google Scholar]
- 30.Wessel N, Voss A, Malberg H, Ziehmann C, Voss HU, Schirdewan A, Meyerfeldt U, Kurths J. 2000. Nonlinear analysis of complex phenomena in cardiological data. Z. Herzschr. Elektrophys. 11, 159–173. ( 10.1007/s003990070035) [DOI] [Google Scholar]
- 31.Tong S, Thakor NV. 2009. Quantitative EEG analysis methods and clinical applications. Boston, MA: Artech House. [Google Scholar]
- 32.Task Force of the European Society of Cardiology and North American Society of Pacing and Electrophysiology. 1996. Heart rate variability: standards of measurement, physiological interpretation and clinical use. Circulation 93, 1043–1065. ( 10.1161/01.CIR.93.5.1043) [DOI] [PubMed] [Google Scholar]
- 33.Voss A, Baier V, Schulz S, Bär K-J. 2006. Linear and nonlinear methods for analyses of cardiovascular variability in bipolar disorders. Bipolar Disord. 8, 441–452. ( 10.1111/j.1399-5618.2006.00364.x) [DOI] [PubMed] [Google Scholar]
- 34.Malberg H. 1999. Dual sequence method for analysis of spontaneous baroreceptor reflex sensitivity in patients with dilated cardiomyopathy. Z. Kardiol. 88, 331–337. [DOI] [PubMed] [Google Scholar]
- 35.Schulz S, Tupaika N, Berger S, Haueisen J, Bär K-J, Voss A. 2013. Cardiovascular coupling analysis with high-resolution joint symbolic dynamics in patients suffering from acute schizophrenia. Physiol. Meas. 34, 883–901. ( 10.1088/0967-3334/34/8/883) [DOI] [PubMed] [Google Scholar]
- 36.Schulz S, Haueisen J, Bär K-J, Andreas V. 2015. High-resolution joint symbolic analysis to enhance classification of the cardiorespiratory system in patients with schizophrenia and their relatives. Phil. Trans. R. Soc. A 373, 20140098 ( 10.1098/rsta.2014.0098) [DOI] [PMC free article] [PubMed] [Google Scholar]
- 37.Schulz S, Bär K-J, Voss A. 2015. Analyses of heart rate, respiration and cardiorespiratory coupling in patients with schizophrenia. Entropy 17, 483–501. ( 10.3390/e17020483) [DOI] [Google Scholar]
- 38.Adochiei F, Schulz S, Edu I, Costin H, Voss A. 2013. A new normalised short time PDC for dynamic coupling analyses. Biomed. Eng. 58(Suppl. 1). ( 10.1515/bmt-2013-4167) [DOI] [PubMed] [Google Scholar]
- 39.Milde T, Schwab K, Walther M, Eiselt M, Schelenz C, Voss A, Witte H. 2011. Time-variant partial directed coherence in analysis of the cardiovascular system. A methodological study. Physiol. Meas. 32, 1787–1805. ( 10.1088/0967-3334/32/11/S06) [DOI] [PubMed] [Google Scholar]
- 40.Bär K-J. 2015. Cardiac autonomic dysfunction in patients with schizophrenia and their healthy relatives—a small review. Front. Neurol. 6, 139 ( 10.3389/fneur.2015.00139) [DOI] [PMC free article] [PubMed] [Google Scholar]
- 41.Schulz S, Haueisen J, Bär K-J, Voss A. 2014. Antipsychotic medication influences cardiovascular coupling in patients suffering from acute schizophrenia. In Computing in Cardiology Conf., Cambridge, MA, 7–10 September 2014, pp. 973–976. Piscataway, NJ: IEEE.
- 42.Agelink MW, Majewski T, Wurthmann C, Lukas K, Ullrich H, Linka T, Klieser E. 2001. Effects of newer atypical antipsychotics on autonomic neurocardiac function: a comparison between amisulpride, olanzapine, sertindole, and clozapine. J. Clin. Psychopharmacol. 21, 8–13. ( 10.1097/00004714-200102000-00003) [DOI] [PubMed] [Google Scholar]
- 43.Bär K-J, Koschke Mandy, Berger S, Schulz S, Tancer M, Voss A, Yeragani VK. 2008. Influence of olanzapine on QT variability and complexity measures of heart rate in patients with schizophrenia. J. Clin. Psychopharmacol. 28, 694–698. ( 10.1097/JCP.0b013e31818a6d25) [DOI] [PubMed] [Google Scholar]
- 44.Bär K-J, Boettger MK, Voss A. 2006. Differences between heart rate and blood pressure variability in schizophrenia. Biomed. Tech. 51, 237–239. ( 10.1515/BMT.2006.045) [DOI] [PubMed] [Google Scholar]
- 45.Bar K, Letzsch A, Jochum T, Wagner G, Greiner W, Sauer H. 2005. Loss of efferent vagal activity in acute schizophrenia. J. Psychiat. Res. 39, 519–527. ( 10.1016/j.jpsychires.2004.12.007) [DOI] [PubMed] [Google Scholar]
- 46.MacCrimmon D, Brunet D, Criollo M, Galin H, Lawson JS. 2012. Clozapine augments delta, theta, and right frontal EEG alpha power in schizophrenic patients. ISRN Psychiatry 2012, 596486 ( 10.5402/2012/596486) [DOI] [PMC free article] [PubMed] [Google Scholar]
- 47.Small JG. et al. 1987. Computerized EEG profiles of haloperidol, chlorpromazine, clozapine and placebo in treatment resistant schizophrenia. Clin. Electroencephalogr. 18, 124–135. [PubMed] [Google Scholar]
- 48.Nagase Y, Okubo Y, Toru M. 1996. Electroencephalography in schizophrenic patients: comparison between neuroleptic-naive state and after treatment. Biol. Psychiatry 40, 452–456. ( 10.1016/0006-3223(96)00304-6) [DOI] [PubMed] [Google Scholar]
- 49.Kemali D, Galderisi S, Maj M, Mucci A, Gregorio MD, Bucci P. 1992. Computerized EEG topography findings in schizophrenic patients before and after haloperidol treatment. Int. J. Psychophysiol. 13, 283–290. ( 10.1016/0167-8760(92)90078-P) [DOI] [PubMed] [Google Scholar]
- 50.Light GA, Hsu JL, Hsieh MH, Meyer-Gomes K, Sprock J, Swerdlow NR, Braff DL. 2006. Gamma band oscillations reveal neural network cortical coherence dysfunction in schizophrenia patients. Biol. Psychiatry 60, 1231–1240. ( 10.1016/j.biopsych.2006.03.055) [DOI] [PubMed] [Google Scholar]
- 51.Basar E, Guntekin B. 2008. A review of brain oscillations in cognitive disorders and the role of neurotransmitters. Brain Res. 1235, 172–193. ( 10.1016/j.brainres.2008.06.103) [DOI] [PubMed] [Google Scholar]
- 52.Tislerova B, Brunovsky M, Horacek J, Novak T, Kopecek M, Mohr P, Krajca V. 2008. LORETA functional imaging in antipsychotic-naive and olanzapine-, clozapine- and risperidone-treated patients with schizophrenia. Neuropsychobiology 58, 1–10. ( 10.1159/000154474) [DOI] [PubMed] [Google Scholar]
- 53.Horacek J, Bubenikova-Valesova V, Kopecek M, Palenicek T, Dockery C, Mohr P, Höschl C. 2006. Mechanism of action of atypical antipsychotic drugs and the neurobiology of schizophrenia. CNS Drugs 20, 389–409. ( 10.2165/00023210-200620050-00004) [DOI] [PubMed] [Google Scholar]
- 54.Boutros NN, Arfken C, Galderisi S, Warrick J, Pratt G, Iacono W. 2008. The status of spectral EEG abnormality as a diagnostic test for schizophrenia. Schizophr. Res. 99, 225–237. ( 10.1016/j.schres.2007.11.020) [DOI] [PMC free article] [PubMed] [Google Scholar]
- 55.Nosaka S. 1996. Modifications of arterial baroreflexes: obligatory roles in cardiovascular regulation in stress and poststress recovery. Jpn. J. Physiol. 46, 271–288. ( 10.2170/jjphysiol.46.271) [DOI] [PubMed] [Google Scholar]
- 56.Bär K-J, Boettger MK, Koschke M, Schulz S, Chokka P, Yeragani VK, Voss A. 2007. Non-linear complexity measures of heart rate variability in acute schizophrenia. Clin. Neurophysiol. 118, 2009–2015. ( 10.1016/j.clinph.2007.06.012) [DOI] [PubMed] [Google Scholar]
- 57.Foster PS, Harrison DW. 2004. The covariation of cortical electrical activity and cardiovascular responding. Int. J. Psychophysiol. 52, 239–255. ( 10.1016/j.ijpsycho.2003.10.009) [DOI] [PubMed] [Google Scholar]
- 58.Schulz S, Adochiei F-C, Edu I-R, Schroeder R, Costin H, Bär K-J, Voss A. 2013. Cardiovascular and cardiorespiratory coupling analyses: a review. Phil. Trans. R. Soc. A 371, 20120191 ( 10.1098/rsta.2012.0191) [DOI] [PubMed] [Google Scholar]
- 59.Porta A, Baumert M, Cysarz D, Wessel N. 2015. Enhancing dynamical signatures of complex systems through symbolic computation. Phil. Trans. R. Soc. A 373, 20140099 ( 10.1098/rsta.2014.0099) [DOI] [PMC free article] [PubMed] [Google Scholar]
- 60.Thayer JF, Lane RD. 2009. Claude Bernard and the heart-brain connection: further elaboration of a model of neurovisceral integration. Neurosci. Biobehav. Rev. 33, 81–88. ( 10.1016/j.neubiorev.2008.08.004) [DOI] [PubMed] [Google Scholar]
- 61.Henry BL, Minassian A, Paulus MP, Geyer MA, Perry W. 2010. Heart rate variability in bipolar mania and schizophrenia. J. Psychiatr. Res. 44, 168–176. ( 10.1016/j.jpsychires.2009.07.011) [DOI] [PMC free article] [PubMed] [Google Scholar]
- 62.Tanida M, Sakatani K, Takano R, Tagai K. 2004. Relation between asymmetry of prefrontal cortex activities and the autonomic nervous system during a mental arithmetic task: near infrared spectroscopy study. Neurosci. Lett. 369, 69–74. ( 10.1016/j.neulet.2004.07.076) [DOI] [PubMed] [Google Scholar]
- 63.Mathewson KJ, Jetha MK, Goldberg JO, Schmidt LA. 2012. Autonomic regulation predicts performance on Wisconsin card sorting test (WCST) in adults with schizophrenia. Biol. Psychol. 91, 389–399. ( 10.1016/j.biopsycho.2012.09.002) [DOI] [PubMed] [Google Scholar]
- 64.Basar E, Guntekin B. 2013. Review of delta, theta, alpha, beta, and gamma response oscillations in neuropsychiatric disorders. Suppl. Clin. Neurophysiol. 62, 303–341. ( 10.1016/B978-0-7020-5307-8.00019-3) [DOI] [PubMed] [Google Scholar]
- 65.Venables NC, Bernat EM, Sponheim SR. 2009. Genetic and disorder-specific aspects of resting state EEG abnormalities in schizophrenia. Schizophr. Bull. 35, 826–839. ( 10.1093/schbul/sbn021) [DOI] [PMC free article] [PubMed] [Google Scholar]
- 66.Uhlhaas PJ, Singer W. 2010. Abnormal neural oscillations and synchrony in schizophrenia. Nat. Rev. Neurosci. 11, 100–113. ( 10.1038/nrn2774) [DOI] [PubMed] [Google Scholar]
- 67.Rachow T, Berger S, Boettger MK, Schulz S, Guinjoan S, Yeragani VK, Voss A, Bär K-J. 2011. Nonlinear relationship between electrodermal activity and heart rate variability in patients with acute schizophrenia. Psychophysiology 48, 1323–1332. ( 10.1111/j.1469-8986.2011.01210.x) [DOI] [PubMed] [Google Scholar]
Associated Data
This section collects any data citations, data availability statements, or supplementary materials included in this article.
Supplementary Materials
Data Availability Statement
Results supporting this article have been uploaded as part of the electronic supplementary material (see tables S1–S4). An exemplary dataset of one schizophrenic patient and one healthy subject supporting this article has been uploaded as part of the electronic supplementary material, in the file Schulz_etal_RSTA-2015–0178.zip. All the used data are the property of the University Hospital Jena, Germany and it is strictly forbidden to pass on or distribute all the data online. However, those interested in using the data should contact the authors to prepare an appropriate cooperation.