

Abstract
Within the framework of ‘Network Physiology’, we ask a fundamental question of how modulations in cardiac dynamics emerge from networked brain–heart interactions. We propose a generalized time-delay approach to identify and quantify dynamical interactions between physiologically relevant brain rhythms and the heart rate. We perform empirical analysis of synchronized continuous EEG and ECG recordings from 34 healthy subjects during night-time sleep. For each pair of brain rhythm and heart interaction, we construct a delay-correlation landscape (DCL) that characterizes how individual brain rhythms are coupled to the heart rate, and how modulations in brain and cardiac dynamics are coordinated in time. We uncover characteristic time delays and an ensemble of specific profiles for the probability distribution of time delays that underly brain–heart interactions. These profiles are consistently observed in all subjects, indicating a universal pattern. Tracking the evolution of DCL across different sleep stages, we find that the ensemble of time-delay profiles changes from one physiologic state to another, indicating a strong association with physiologic state and function. The reported observations provide new insights on neurophysiological regulation of cardiac dynamics, with potential for broad clinical applications. The presented approach allows one to simultaneously capture key elements of dynamic interactions, including characteristic time delays and their time evolution, and can be applied to a range of coupled dynamical systems.
Keywords: brain–heart interactions, time-delay analysis, delay-correlation landscape, Network Physiology
1. Introduction
As an integrated physiologic system under neural regulation, the cardiac system exhibits complex behaviour characterized by continuous fluctuations and transient, nonlinear and scale-invariant temporal dynamics. Reflecting modulation in neural autonomic control and sympatho-vagal balance [1–4], the linear and nonlinear characteristics of cardiac dynamics [5–7] change with sleep–wake cycle [8,9], across circadian phases [10] and sleep-stage transitions [11–13]. Various measures derived from linear and nonlinear characteristics of cardiac dynamics have been established as robust biomarkers for diagnosis and prognosis under a broad range of conditions [14,15], young versus elderly [16,17] and under pathological perturbations [18–23]. To account for these extensive empirical observations, modelling approaches have been developed (i) to investigate the underlying mechanisms of neuroautonomic control and associated nonlinear feedback loops acting on a wide range of time scales, and (ii) to study how these mechanisms change across different physiologic states and conditions [24].
Despite the importance of understanding the basic mechanisms of neural regulation of organ systems, it is not well understood how the brain and the cardiac system dynamically interact and coordinate their functions to generate a variety of physiologic states. Specifically, the role of different brain rhythms and their temporal dynamics in mediating brain–heart communications remains an open question.
Probing dynamics of brain–heart interactions is a major challenge due to several levels of complexity. At the individual systems level: the heart and the brain are very different integrated systems, each with its own structural and functional complexity, leading to output dynamics with distinct characteristics, i.e. the cardiac system exhibits a pronounced oscillatory pattern on the scale of seconds, whereas brain dynamics are characterized by multiple rhythms with different origins and functions that operate on much shorter time scales. At the level of pairwise interactions: physiological systems often interact through multiple forms of coupling, which are of transient nature, can switch on/off, and can simultaneously coexist [25–29]. In the context of brain–heart communications [30], synchronization [31–33], coherence [34], time delay [35,36] and information transfer [37,38] play important roles. At the organism level where dynamical networks of diverse organ systems are essential: integrated physiologic function emerges as a global phenomenon from hierarchical networks representing the dynamical interactions among organ systems, and cannot be simply described by summing up the behaviours of individual systems.
Within the framework of ‘Network Physiology’ [36,39,40], using the concept of time-delay stability (TDS), recent work [26,40] has demonstrated that the cardiac system communicates with the brain not only through one but rather through multiple brain rhythms simultaneously. Further, empirical analyses have shown that, during different physiologic states, brain–heart communications are predominantly mediated through different brain rhythms, where patterns of brain–heart networked interactions depend on brain locations, and undergo complex hierarchical reorganization with transitions across physiologic states [40].
To quantify brain–heart interactions, here we extend the TDS approach [36,40–42] and we propose a generalized time-delay analysis based on the novel concept of delay-correlation landscape (DCL) to investigate coordination of bursting activities in the brain and heart output signals. We hypothesize that key properties of the brain–heart DCL reflect changes in neuroautonomic control of cardiac and brain dynamics associated with distinct physiologic states such as sleep or wake and different sleep stages. Specifically, we hypothesize that the characteristic time delays and directionality of brain–heart communications between each physiologically relevant brain rhythm and cardiac output dynamics exhibit unique signature profiles reflecting physiologic function during distinct physiologic states.
2. Material and methods
(a). Data
We analyse continuously recorded multichannel physiological data obtained from 34 healthy young subjects (17 female, 17 male, with ages between 20 and 40, average 29 years) during night-time sleep [43] (average record duration is 7.8 h). This allows us to track the dynamics and evolution of brain–heart interactions during different sleep stages and sleep-stage transitions. We focus on physiological dynamics during sleep as sleep stages are well-defined physiological states, and external influences due to physical activity or sensory inputs are reduced during sleep. Sleep stages are scored in 30 s epochs by sleep laboratory technicians based on standard criteria [44,43]. In particular, we focus on the electroencephalogram (EEG) and the electrocardiogram (ECG). To compare these very different signals with each other and to study interrelations between them, we extract the following time series from the raw signals: the spectral power of five physiologically relevant frequency bands of the EEG, derived from the central C3 channel, in moving windows of 2 s with a 1 s overlap (namely δ wave (0.5–3.5 Hz), θ wave (4–7.5 Hz), α wave (8–11.5 Hz), σ wave (12–15.5 Hz) and β wave (16–19.5 Hz)); heartbeat RR intervals are re-sampled to 1 Hz (1 s bins) after which values are inverted to obtain the instantaneous heart rate (HR). Thus, all time series have the same time resolution of 1 s before our analyses are applied.
We calculate the fast Fourier transform (FFT) in 2 s EEG windows and determine the spectral power in the EEG frequency bands mentioned above. As there is a problem of power leakage from one frequency bin to others, we taper the window by a Hann function, and because tapering itself introduces the problem of weighting the edge of the windows much less than the data in the middle, we choose an overlap of half the window length, i.e. 1 s. According to Press et al. [45], tapering and choosing an overlap that is half the window length resolves the problems of power leakage and different weights, respectively. Because we are analysing EEG data that were recorded during sleep, we use the five EEG band definitions that are commonly accepted in sleep medicine [46] as defined above. We originally extended the definition for β to include ‘high β waves’ (20–30 Hz); however, we noted that, past 20 Hz, the EEG is more susceptible to electromyography (EMG) movement artefacts, and therefore we chose the traditional 16–19.5 Hz frequency band.
The ECG data are analysed and annotated by a semi-automatic R-peak detector (see below). EEG recordings were filtered by a high-pass filter (0–0.4 Hz) and a low-pass filter (30–70 Hz). We apply the high-pass filter in this range to filter out slow movement artefacts without much affecting δ frequencies. The low-pass filter filters out high-frequency artefacts (e.g. from EMG). In addition, the EEG recording device had a 50 Hz notch filter. R-peaks are extracted from the ECG data using the semi-automatic peak detector Raschlab developed by the cardiology group of Klinikum Rechts der Isar, Munich, Germany (R. Schneider. Open source toolbox for handling cardiologic data, available on the internet: www.librasch.org). A beat classification (normal beat, ventricular beat, artefact) is assigned to each R-peak by the detector. Then we calculate the series of RR time intervals between each pair of consecutive heartbeats and obtain the HR time series by inverting the RR series. Ectopic beats and artefacts are detected by Raschlab. Additionally, we examine more carefully the obtained RR intervals and exclude RR intervals from our calculations, if (i) the beat at the beginning or at the end of the interval is not normal, (ii) the calculated interval is shorter than 330 ms or longer than 2000 ms or (iii) the interval is more than 30% shorter or more than 60% longer than the preceding interval. The purpose of the last filter is to eliminate extrasystoles and ectopic beats unnoticed by the peak detector. This procedure led to ≈1% removal of original ECG RR intervals and corresponding ≈1% reduction in the original EEG data.
One potential approach to study brain–heart interaction mediated by different brain rhythms is to use the absolute spectral power in each EEG frequency band. However, our preliminary results (not shown) indicate that the bursting activity in HR is strongly modulated by trends in the total EEG power within the frequency range of 0.5–19.5 Hz (sum of all five frequency bands)—a masking effect leading to very similar results for each pair of HR and brain rhythm interaction. In order to eliminate this masking effect and to isolate spurious synchronization among all brain rhythms caused by modulations in the total EEG spectral power, we use normalized (relative) spectral power in our analyses. First, we calculate the time series of the total power of EEG (SEEG) as the sum of all spectral powers from the five frequency bands listed above. Next, we obtain the relative spectral power in each frequency band with a 1 s resolution. The relative spectral power (Sδ(t),Sθ(t),Sα(t),Sσ(t),Sβ(t)) is obtained as the ratio between the spectral power in the specific frequency band and the total spectral power of all five bands. Thus, the obtained normalized relative spectral power represents the relative contribution of each brain rhythm to the total brain activity, and allows one to investigate the individual role of each brain rhythm in facilitating brain–heart communications.
(b). Generalized time-delay analysis and delay-correlation landscape
The TDS method proposed in earlier studies [36,41,40] focuses on the time evolution and stability of the time delay defined as the time shift corresponding to maximum degree of correlation/ anti-correlation between two signals. While the percentage of data segments exhibiting time-delay stability (%TDS) was found to have important physiological relevance, as it undergoes a pronounced transition from one physiologic state to another, it does not provide information on the type of correlation (positive or negative) and directionality of interaction based on the sign of the time delay.
To address these limitations and to further quantify the dynamical aspects of brain–heart interaction, we extend our TDS methodology to a more generalized time-delay analysis framework, which keeps track of both the time t evolution of cross-correlation C as well as the time shift τ dependence of the cross-correlation, i.e. C(t,τ).
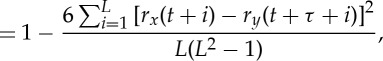
As shown in figure 1, for each time window t with size L=30 s, we obtain the Spearman cross-correlation as a function Cxy of the time shift τ∈[−30,30] between two signals x and y, where rx and ry represent the ranks of the values in the signals x and y, respectively. The functional form of Cxy(t,τ) can be written as:
 |
2.1 |
 |
2.2 |
where  . At each time step t, we shift the 30 s window of the HR (signal y) relatively to the 30 s window of EEG spectral power (signal x) in steps of 1 s, and calculate the cross-correlation as a function of the relative time shift τ (vertical axis in figure 1). Cxy(t,τ) forms a DCL as shown in figure 1c that represents the time evolution of cross-correlation for different choices of time shift τ between two signals.
Figure 1.

Generalized time-delay analysis and delay-correlation landscape. (a) Normalized spectral power Sδ of δ brain rhythm (0.5–4 Hz) derived from EEG recording at the central C3 channel (C3–M2 set-up), and (b) heart rate (HR) from a healthy subject during 30 min of night-time sleep. Black dashed lines and background colours in (a) and (b) represent sleep stages (denoted on the right vertical axis) as defined by traditional sleep-stage scoring criteria [43,44]. (c) Spearman cross-correlation function Cδ,HR(τ,t) between Sδ and heart rate (HR) are obtained in 30 s windows moving with a step of 30 s and plotted as delay-correlation landscape (colour map). Horizontal axis t indicates the time corresponding to the centre of the two aligned 30 s windows used for the cross-correlation calculation. At each time step t, we shift the 30 s window of the HR relatively to the 30 s window of EEG spectral power, and calculate the cross-correlation as a function of the relative time shift τ (vertical axis): τ>0 when the 30 s window for brain rhythm signal precedes the window of cardiac signal and vice versa for τ<0. Colour of the delay-correlation landscape (DCL) represents the value of cross-correlation: red corresponds to positive correlation C>0 and blue corresponds to negative correlation C<0. Black triangle symbols in (c) mark the time evolution (in 30 s steps) of the maximum correlation time delay τMC(t) defined as the time shift corresponding to the maximum absolute value of the cross-correlation function. Positive and negative correlation maps are plotted separately in (d) and (e), where only positive or negative correlation values are shown. We define positive correlation time delay τPC(t) (red circles) and negative correlation time delayτNC(t) (blue squares) as the time shift corresponding to the maximum positive or maximum negative correlation. (Online version in colour.)
Theoretically, the DCL contains the information provided by both the traditional cross-correlation analysis and the original TDS method [36,41,40]. The cross-section of DCL along the black dashed line τ=0 in figure 1c represents the cross-correlation of the two signals without any time shift, i.e. Cxy(t)|τ=0. Black triangle symbols in figure 1c mark the evolution of time delay defined in the original TDS method as the time shift between the two signals at which the maximum in the absolute value of cross-correlation is observed, i.e.  . The DCL reveals a more comprehensive picture of the dynamic interaction between two signals as represented by a heterogeneous landscape within which red ‘hills’ (positive correlation, C>0) and blue ‘valleys’ (negative correlation, C<0) form a complex mixture.
To quantify the structure of DCL and to better understand the nature of interactions that generate the delay-correlation configuration at each time t, it is important to differentiate the two types of cross-correlation—positive versus negative. Thus, we construct the subset of DCL with only positive correlation, i.e. only ‘hills’ in the DCL, as shown in figure 1d, where red solid circles mark the positive correlation time delay,  , corresponding to the time shift where maximum positive cross-correlation is observed at each time step t. Similarly, we also construct the negative DCL of blue ‘valleys’ as shown in figure 1e, where blue squares track the time evolution of negative correlation time delay,
  , corresponding to the maximum negative cross-correlation at each time step t.
In our analyses of brain–heart interactions, we fix the second signal to be the instantaneous heart rate y(t)≡HR(t), and we assign the first signal x(t) as the relative spectral power of five physiologically relevant brain rhythms (Sδ(t),Sθ(t),Sα(t),Sσ(t),Sβ(t)) and the total spectral power SEEG(t). Under this definition, a positive time delay τ>0 always corresponds to a situation when the modulation in brain rhythms precedes corresponding changes in the cardiac signal, and vice versa for τ<0.
(c). Probability distributions of time delay
Our previous work has shown that TDS is a reliable measure of interaction and coupling between dynamical systems, and that it is sensitive to differentiate between physiological states and conditions even in cases when the amplitude of cross-correlation cannot provide a statistically significant separation between real and surrogate data [36]. Thus, to probe brain–heart interactions, here we quantify the temporal dynamics and statistical properties of the time delay inherent to different pairs of brain rhythms and heart interactions by calculating the probability distribution P(τ) of three types of time delay, including maximum correlation time delay (τMC), positive correlation time delay (τPC) and negative correlation time delay (τNC). In other words, we are interested in the most probable time delay when significant cross-correlations are observed. The probability distribution is represented by a renormalized histogram of time delays and the summation of the histogram values over all bins (1 s bin) equals 1. As shown in figures 2 and 3, we obtain the probability distributions for all three types of time delay for a typical individual subject as well as for the entire group of subjects. Panels along the horizontal direction are colour-coded to represent interactions between different brain signals and the HR output, whereas different rows of panels correspond to different types of time delay.
Figure 2.

Probability distribution profiles for maximum, positive and negative correlation time delays τMC, τPC and τNC: (a) for an individual subject and (b) for the group average of 34 healthy subjects representing the entire night-time sleep period. Solid black line in each panel is a moving average of the probability distribution (smoothed profile with 3 s moving window). The bin size for the time delay τ is 1 s. Similarity between the individual subject profiles and the group average profiles for each pair of brain rhythm–heart interaction indicates a universal mechanism underlying time delays in brain–heart communication. (Online version in colour.)
Figure 3.

Statistical patterns of characteristic time delays underlying brain–heart communications. Probability distributions of the maximum correlation time delay τMC (first row), positive correlation time delay τPC (second row) and negative correlation time delay τNC (third row) are obtained from the generalized time-delay analysis (figure 1) for each pair of brain–heart interactions. (a) Individual distributions for all 34 subjects (plotted in different colours) and (b) the group average, where black error bars represent the standard deviation across subjects. Distributions are obtained for the entire night-time sleep period. Distribution profiles skewed to the right with peak at τ>0 indicate that activations in brain dynamics precede cardiac dynamics. Considering interactions between the relative spectral power of each brain rhythm and the HR, we find unique profiles for the probability distribution of the time delay τ, indicating a specific role of each brain rhythm in mediating brain–heart interactions. Note the different distribution profiles of τMC, τPC and τNC for the interaction between each brain rhythm and the heart, indicating that positive and negative cross-correlations are characterized by different time delays. Interactions between the total EEG power (all five brain rhythms) and the HR are characterized by a significant peak at τPC=0, indicating synchronized bursting activity in the brain–heart network where modulations in the same direction for the heart and the brain occur simultaneously. By contrast, total EEG power and HR interactions exhibit a sharp peak at τNC>0, indicating that modulations in the HR that are in opposite direction to changes in brain oscillation occur with a positive time delay. The double-peak distribution profile of τMC reflects a combination of the profiles for τPC and τNC. Remarkably, the ensemble of probability distribution profiles for all three types of time delays is consistently observed for all subjects with small standard deviation, indicating a universal mechanism underlying time delays in brain–heart communication. (Online version in colour.)
For a given pair of brain–heart interaction, the probability distributions of τPC and τNC can be further combined into one histogram profile by plotting P(τPC) in the upper half plane with corresponding colours as in figures 2 and 3, and inverting and plotting P(τNC) in the lower half plane with the same light shade (figure 4). Combining histograms in this way enables us to better demonstrate the changes in the probability distribution profile of the time delay for a given pair of brain–heart interaction with transitions from one physiologic state (sleep stage) to another, as well as the corresponding hierarchical reorganization of the entire set of distribution profiles for all pairs of brain rhythms and heart interactions (shown in figure 4).
Figure 4.

Change in brain–heart time-delay distribution profiles with transitions across physiologic states. Joint profiles of the probability distribution of τPC and τNC for each pair of brain–heart interactions during different physiologic states (sleep stages) obtained by pooling data from all subjects (see §2). Distributions for τPC are plotted in the upper half plane in each panel (different colours for different brain–heart interactions as in figure 3). Distributions for τNC are inverted and plotted in the lower half plane with the same light shade. Each sleep stage (horizontal row) is characterized by a specific set of profiles representing the time-delay characteristics for each brain–heart interaction. Considering each pair of brain rhythm and heart interaction (column), the joint distribution profile of τPC and τNC changes from one sleep stage to another, leading to a complex reorganization for the entire set of profiles across different physiologic states. This reorganization in the time-delay profiles across sleep stages is also observed for the total EEG spectral power (right column), indicating a pronounced change in the coupling between the overall brain activity and cardiac dynamics. Note that, for all pairs of brain–heart interactions during all sleep stages, there are no peaks with significant negative time delay, indicating that brain–heart communications are mainly mediated through directional interaction from the brain to the heart. Each sleep stage is characterized by a specific ensemble of joint time-delay distribution profiles indicating that these profiles are a robust signature of physiologic state. (Online version in colour.)
Peaks in the probability distribution profiles of time delay correspond to the characteristic time delays that underlie brain–heart communications, and the sign of these characteristic time delays is indicative of the directionality of brain–heart communication: τ>0 for directional interaction from the brain to the heart, whereas τ<0 indicates that cardiac dynamics precede modulations in brain activity.
3. Results and discussion
Integrated physiological systems, in general, are coupled by feedback and/or feed-forward loops with a broad range of time delays that underlie physiologic interactions. Combination of these feedback loops leads to different types of coordinated modulation in the output dynamics of physiological systems that can simultaneously coexist [25–27]. Characteristics of physiologic coupling and interaction, such as the range of time delays and different modes of coordination, are essential for the entire organism to optimize its function during different physiologic states and to generate proper response to external perturbation. Consequently, we focus on the characteristic time delays involved in different modes of brain–heart interaction.
We perform empirical analyses of EEG and HR data recorded in healthy subjects during night-time sleep to probe the interaction between distinct brain rhythm and the heart, and how these interactions change with different sleep stages (well-defined physiologic states). As brain rhythm activation and cardiac dynamics continuously change even within the same physiologic state, we expect a high degree of complexity in the DCL representing brain–heart communications (§2). As shown in figure 1c, the DCL for the Sδ−HR interaction is characterized by pronounced heterogeneity where different types of cross-correlation (positive or negative correlation as represented by regions with different colours) form a complex mixture.
(a). Ensemble of characteristic time-delay profiles
To investigate whether there are characteristic time delays associated with brain–heart interactions, we construct the DCL (figure 1) for each pair of brain rhythm and HR signals. We obtain probability distributions for three distinct types of time delays:
(i) Maximum correlation time delay (τMC) is the time shift which corresponds to the highest degree of cross-correlation defined as the maximum of |C|. If the fluctuations of τMC remain small within the range of ΔτMC=±1 s, the two signals are considered to exhibit TDS and the two physiological systems are linked during this time period [36,40,41].
(ii) Positive correlation time delay (τPC) is the time shift for which two signals exhibit the maximum positive cross-correlation. Strong positive correlation Cxy is often associated with coordinated bursting activities in both signals, namely increase (or decrease) in signal x is accompanied by a corresponding increase (or decrease) in signal y.
(iii) Negative correlation time delay (τNC) represents the time shift for which two signals exhibit the most negative cross-correlation. Thus, τNC characterizes the typical time delay when modulations in two signals occur in the opposite direction.
We find that, for each pair of brain–heart interaction, τMC, τPC and τNC are characterized by markedly different patterns in their probability distribution P(τ) (vertical columns in figures 2 and 3). For example, Sδ−HR interaction has a pronounced peak for P(τPC) at τPC≈0 s, while the peak for P(τNC) is located at τNC≈6 s, indicating that different modes of brain–heart coordination operate at markedly different time delays. For τMC, we consistently observe a double-peak pattern in its probability distribution for all pairs of brain rhythm and HR interactions, which reflects features of the distribution profiles for both τPC and τNC—this double-peak pattern is most pronounced for the SEEG–HR interaction (figures 2 and 3).
Comparing pairs of interaction between the HR and different brain rhythms, we find that for each type of time delay (horizontal rows in figures 2 and 3) different pairs of brain–heart interactions exhibit distinct profiles of the probability distribution P(τ). For example, while P(τPC) for the pair Sδ−HR has a dominant peak at τPC≈0 s, the pair Sθ−HR is characterized by a dominant time delay of τPC≈6 s, and Sσ−HR has characteristic time delays at both τPC≈0 s and τPC≈6 s. By contrast, comparing P(τNC) for different pairs of brain rhythm–HR interaction, we observe a pronounced peak at τNC≈6 s for Sδ−HR and peak at τNC≈0 s for Sθ−HR; this is exactly opposite to the peak locations observed in P(τPC) (figures 2 and 3). These distinct profiles indicate that each brain rhythm plays a specific role in mediating brain–heart interactions.
Remarkably, the entire ensemble of distribution profiles for all three types of time delays is robust, as it is consistently observed for all individual subjects (figure 3a) as well as for the group average behaviour (figure 3b). This consistency in time-delay distribution profiles is demonstrated by the small standard deviation across subjects (error bars around group average value, figure 3).
Our statistical analysis (electronic supplementary material, figure S5a) reveals that the most pronounced characteristic time delays underlying brain–heart communications are associated with the following pairwise interactions: (i) Sδ–HR, (ii) Sθ–HR and (iii) SEEG–HR. These interactions exhibit statistically significant peaks in the profiles of P(τPC) and P(τNC), coupled with consistent time delays for τPC and τNC across subjects: (i) for Sδ–HR, τPC=0 s and τNC=6 s; (ii) for Sθ–HR, τPC=6 s and τNC=0 s; and (iii) for SEEG–HR, τPC=0 s and τNC=6 s.
To further explore the interrelation between the characteristic time delays in the brain–heart communication and distinct physiologic functions, we calculate the probability distributions for τPC and τNC for different sleep stages, including deep sleep (DS), light sleep (LS), rapid eye movement sleep (REM) and wake/brief arousals (W).
We find that each sleep stage is characterized by a specific set of joint profiles of the probability distribution for τPC and τNC (horizontal rows in figure 4). Following each pair of brain–heart interaction (vertical columns in figure 4), we observe that the joint profile of τPC and τNC changes significantly from one sleep stage to another, reflecting changes in the neural regulation of cardiac dynamics. Moreover, we find that the joint τPC and τNC profile for each pair of brain–heart interaction follows a specific transition pattern across sleep stages (figure 4). Thus, with transition across physiological states there is a complex reorganization of the entire ensemble of time-delay distribution profiles of the different brain rhythm–HR interactions.
Intriguingly, our results for the total power SEEG–HR interaction show that, with increase in sympathetic tone from DS to LS, REM and W, the peak in P(τNC) at τNC=6 s completely vanishes (figure 4), corresponding to the loss of significant time delays for negative brain–heart cross-correlation (i.e. for modulations in the opposite directions between the EEG and HR signals). Indeed, increased bursting activity in brain dynamics associated with dominant parasympathetic tone during DS and LS is associated with dipping in the HR, leading to a pronounced anti-correlation profile, which disappears under dominant sympathetic tone during wake. This pronounced τNC=6 s time delay is consistently observed for all subjects (electronic supplementary material, figure S5). While it may be associated with the baroreflex feedback loop, the underlying physiologic mechanism for this characteristic time delay remains to be explored. These observations identify characteristic time delays of brain–heart communications as a new hallmark of physiologic state and function.
Notably, we find that, for both τPC and τNC, there are no peaks at significant negative time delays as shown by the profiles in figure 4, indicating that brain–heart communications are mainly mediated through directional interaction from the brain to the cardiac system.
4. Conclusion
To understand the basic mechanisms of neuroautonomic control of the cardiac systems, we develop a generalized time-delay analysis framework and a novel DCL approach to investigate the role of distinct physiologically relevant brain rhythms in mediating brain–heart interactions. Compared with the traditional cross-correlation analysis with a fixed time delay or the original TDS approach, where the emergence of stable time delay marks the onset of dynamical coupling between two systems, the approach proposed here keeps track of both the time evolution and the delay dependence of the cross-correlation between two signals.
We find that brain–heart interactions exhibit characteristic time delays and that different modes of interaction (i.e. positive or negative cross-correlations) are characterized by different time delays. Our results demonstrate that the interactions between different brain rhythms and the HR are characterized by distinct distribution profiles for time delays, indicating that each brain rhythm has a specific role in mediating brain–heart communications. Furthermore, we find that the time-delay profile for each pair of brain rhythm and HR interaction follows a unique transition pattern from one sleep stage to another, leading to a complex reorganization of the entire ensemble of time-delay profiles.
As sleep-stage transitions are closely associated with changes in sympatho-vagal balance, the uncovered ensemble of time-delay profiles representing brain–heart interactions reveals previously unknown dynamical aspects of cardiac neural regulation that are a hallmark of physiologic state and function.
Remarkably, the uncovered time-delay distribution profiles for all pairs of brain rhythm and HR interactions are consistently observed in all healthy subjects, and exhibit a similar reorganization with transition across sleep stages in each subject. Thus, these new measures can potentially be used not only as robust markers of physiologic states and functions under healthy condition, but also as diagnostic and prognostic indicators of pathological perturbations.
The main purpose of this work is to present a first proof-of-concept demonstration of a DCL approach to identify and quantify the characteristic time delay underlying brain–heart interactions. Thus, in this study, we use data from the C3 EEG channel only, which is most commonly used in sleep research, and we use EEGC3–HR interaction as an example to present our computational framework. Naturally, follow-up work will extend to other EEG leads to identify the different roles of brain location in mediating brain–heart interactions. These extended analyses may include not only instantaneous HR time series, as presented here, but also high- and low-frequency HR components as well as other static and dynamic local characteristics of the cardiac output. Further, modelling approaches based on surrogate time series with different autocorrelations and other dynamical characteristics as observed in the brain and heart output signals can help elucidate the origin and structure of the DCL representing brain–heart interactions during different sleep stages.
The proposed time-delay approach is general and can be applied to other types of dynamical systems with complex output signals where the existence and the nature of coupling and interactions are not known a priori. Moreover, the novel concept of delay-correlation landscape encompasses all key elements of cross-correlation, and provides a comprehensive picture of the coupling strength, characteristic time delays and time evolution of correlation between dynamical systems. Thus, the approach presented here can serve as a general analytical tool to understand basic mechanisms underlying physiological interactions, which is essential for the development of the new field of ‘Network Physiology’.
Supplementary Material
Acknowledgements
We acknowledge the generous support given by the above organizations.
Ethics
The research protocol was approved by the Institutional Review Boards of Boston University (Boston, MA, USA) and was conducted according to the principles expressed in the Declaration of Helsinki.
Data accessibility
The data we used in this work are pre-existing multi-channel physiologic recordings from EU SIESTA databases. The detailed protocol of the SIESTA database can be found in Klösch et al. [43]. All participants provided written informed consent.
Author' contributions
A.L. and K.K.L.L. contributed equally to this paper. A.L. and K.K.L.L. designed the analysis algorithm. A.L., K.K.L.L., R.P.B. and P.Ch.I. analysed the data. K.K.L.L., R.P.B. and P.Ch.I. prepared the manuscript. P.Ch.I. initiated the investigation and supervised all aspects of the work. All authors discussed the results and commented on the manuscript.
Competing interests
The authors declare that they have no competing interests.
Funding
This research was supported by W. M. Keck Foundation, National Institutes of Health (NIH grant 1R01- HL098437), the Office of Naval Research (ONR grant 000141010078), the US–Israel Binational Science Foundation (BSF grant 2012219), EC-FP7 Marie Curie Fellowship (IIF 628159) (to R.P.B.), the National Natural Science Foundation of China (grant no. 61304145) (to A.L.) and the Research Fund for the Doctoral Program of Higher Education (grant no. 20130009120016) (to A.L.).
References
- 1.Akselrod S, Gordon D, Ubel FA, Shannon DC, Berger AC, Cohen RJ. 1981. Power spectrum analysis of heart rate fluctuation: a quantitative probe of beat-to-beat cardiovascular control. Science 213, 220–222. ( 10.1126/science.6166045) [DOI] [PubMed] [Google Scholar]
- 2.Somers VK, Dyken ME, Mark AL, Abboud FM. 1993. Sympathetic-nerve activity during sleep in normal subjects. New Engl. J. Med. 328, 303–307. ( 10.1056/NEJM199302043280502) [DOI] [PubMed] [Google Scholar]
- 3.Otzenberger H, Gronfier C, Simon C, Charloux A, Ehrhart J, Piquard F, Brandenberger G. 1998. Dynamic heart rate variability: a tool for exploring sympathovagal balance continuously during sleep in men. Am. J. Physiol. 275, H946–H950. See http://ajpheart.physiology.org/content/275/3/H946. [DOI] [PubMed] [Google Scholar]
- 4.Malliani A, Pagani M, Lombardi F, Cerutti S. 1991. Cardiovascular neural regulation explored in the frequency domain. Circulation 84, 482–492. ( 10.1161/01.CIR.84.2.482) [DOI] [PubMed] [Google Scholar]
- 5.Peng C-K, Havlin S, Stanley HE, Goldberger AL. 1995. Quantification of scaling exponents and crossover phenomena in nonstationary heartbeat time series. Chaos 5, 82–87. ( 10.1063/1.166141) [DOI] [PubMed] [Google Scholar]
- 6.Ivanov PCh, Amaral LAN, Goldberger AL, Havlin S, Rosenblum MG, Struzik ZR, Stanley HE. 1999. Multifractality in human heartbeat dynamics. Nature 399, 461–465. ( 10.1038/20924) [DOI] [PubMed] [Google Scholar]
- 7.Ivanov PCh, Amaral LAN, Goldberger AL, Havlin S, Rosenblum MG, Stanley HE, Struzik Z. 2001. From 1/f noise to multifractal cascades in heartbeat dynamics. Chaos 11, 641–652. ( 10.1063/1.1395631) [DOI] [PubMed] [Google Scholar]
- 8.Bonnet M, Arand D. 1997. Heart rate variability: sleep stage, time of night, and arousal influences. Electroencephalogr. Clin. Neurophysiol. 102, 390–396. ( 10.1016/S0921-884X(96)96070-1) [DOI] [PubMed] [Google Scholar]
- 9.Ivanov PCh, Bunde A, Amaral LAN, Havlin S, Fritsch-Yelle J, Baevsky RM, Stanley HE, Goldberger AL. 1999. Sleep–wake differences in scaling behavior of the human heartbeat: analysis of terrestrial and long-term space flight data. Europhys. Lett. 48, 594–600. ( 10.1209/epl/i1999-00525-0) [DOI] [PubMed] [Google Scholar]
- 10.Ivanov PCh, Hu K, Hilton MF, Shea SA, Stanley HE. 2007. Endogenous circadian rhythm in human motor activity uncoupled from circadian influences on cardiac dynamics. Proc. Natl Acad. Sci. USA 104, 20 702–20 707. ( 10.1073/pnas.0709957104) [DOI] [PMC free article] [PubMed] [Google Scholar]
- 11.Bunde A, Havlin S, Kantelhardt JW, Penzel T, Peter J-H, Voigt K. 2000. Correlated and uncorrelated regions in heart-rate fluctuations during sleep. Phys. Rev. Lett. 85, 3736–3739. ( 10.1103/PhysRevLett.85.3736) [DOI] [PubMed] [Google Scholar]
- 12.Kantelhardt JW, Ashkenazy Y, Ivanov PCh, Bunde A, Havlin S, Penzel T, Peter J-H, Stanley HE. 2002. Characterization of sleep stages by correlations in the magnitude and sign of heartbeat increments. Phys. Rev. E 65, 051908 ( 10.1103/PhysRevE.65.051908) [DOI] [PubMed] [Google Scholar]
- 13.Dvir I, Adler Y, Freimark D, Lavie P. 2002. Evidence for fractal correlation properties in variations of peripheral arterial tone during REM sleep. Am. J. Physiol. Heart Circ. Physiol. 283, H434–H439. ( 10.1152/ajpheart.00336.2001) [DOI] [PubMed] [Google Scholar]
- 14.Karasik R, Sapir N, Ashkenazy Y, Ivanov PCh, Dvir I, Lavie P, Havlin S. 2002. Correlation differences in heartbeat fluctuations during rest and exercise. Phys. Rev. E 66, 062902 ( 10.1103/PhysRevE.66.062902) [DOI] [PubMed] [Google Scholar]
- 15.Echeverria JC, Aguilar SD, Ortiz MR, Alvarez-Ramirez J, González-Camarena R. 2006. Comparison of RR-interval scaling exponents derived from long and short segments at different wake periods. Physiol. Meas. 27, N19–N25. ( 10.1088/0967-3334/27/4/N01) [DOI] [PubMed] [Google Scholar]
- 16.Corino VDA, Matteucci M, Cravello L, Ferrari E, Ferrari AA, Mainardi LT. 2006. Long-term heart rate variability as a predictor of patient age. Comp. Methods Prog. Biomed. 82, 248–257. ( 10.1016/j.cmpb.2006.04.005) [DOI] [PubMed] [Google Scholar]
- 17.Schmitt DT, Stein PK, Ivanov PCh. 2009. Stratification pattern of static and scale-invariant dynamic measures of heartbeat fluctuations across sleep stages in young and elderly. IEEE Trans. Biomed. Eng. 56, 1564–1573. ( 10.1109/TBME.2009.2014819) [DOI] [PMC free article] [PubMed] [Google Scholar]
- 18.Ho KKL, Moody GB, Peng C-K, Mietus JE, Larson MG, Levy D, Goldberger AL. 1997. Predicting survival in heart failure cases and controls using fully automated methods for deriving nonlinear and conventional indices of heart rate dynamics. Circulation 96, 842–848. ( 10.1161/01.CIR.96.3.842) [DOI] [PubMed] [Google Scholar]
- 19.Huikuri HV, Mäkikallio TH, Peng C-K, Goldberger AL, Hintze U, Moller M. 2000. Fractal correlation properties of R-R interval dynamics and mortality in patients with depressed left ventricular function after an acute myocardial infarction. Circulation 101, 47–53. ( 10.1161/01.CIR.101.1.47) [DOI] [PubMed] [Google Scholar]
- 20.Moelgaard H, Soerensen KE, Bjerregaard P. 1991. Circadian variation and influence of risk factors on heart rate variability in healthy subjects. Am. J. Cardiol. 68, 777–784. ( 10.1016/0002-9149(91)90653-3) [DOI] [PubMed] [Google Scholar]
- 21.Penzel T, Wessel N, Riedl M, Kantelhardt JW, Rostig S, Glos M, Suhrbier A, Malberg H, Fietze I. 2007. Cardiovascular and respiratory dynamics during normal and pathological sleep. Chaos 17, 015116 ( 10.1063/1.2711282) [DOI] [PubMed] [Google Scholar]
- 22.Valenza G, Garcia RG, Citi L, Scilingo EP, Tomaz CA, Barbieri R. 2015. Nonlinear digital signal processing in mental health: characterization of major depression using instantaneous entropy measures of heartbeat dynamics. Front. Physiol. 6, 74 ( 10.3389/fphys.2015.00074) [DOI] [PMC free article] [PubMed] [Google Scholar]
- 23.Lombardi F, Sandrone G, Pernpruner S, Sala R, Garimoldi M, Cerutti S, Baselli G, Pagani M, Malliani A. 1987. Heart rate variability as an index of sympathovagal interaction after acute myocardial infarction. Am. J. Cardiol. 60, 1239–1245. ( 10.1016/0002-9149(87)90601-1) [DOI] [PubMed] [Google Scholar]
- 24.Ivanov PCh, Amaral LAN, Goldberger AL, Stanley HE. 1998. Stochastic feedback and the regulation of biological rhythms. Europhys. Lett. 43, 363–368. ( 10.1209/epl/i1998-00366-3) [DOI] [PubMed] [Google Scholar]
- 25.Bartsch RP, Schumann AY, Kantelhardt JW, Penzel T, Ivanov PCh. 2012. Phase transitions in physiologic coupling. Proc. Natl Acad. Sci. USA 109, 10 181–10 186. ( 10.1073/pnas.1204568109) [DOI] [PMC free article] [PubMed] [Google Scholar]
- 26.Bartsch RP, Ivanov PCh. 2014. Coexisting forms of coupling and phase-transitions in physiological networks. Commun. Comput. Inf. Sci. 438, 270–287. ( 10.1007/978-3-319-08672-9_33) [DOI] [Google Scholar]
- 27.Bartsch RP, Liu KKL, Ma QDY, Ivanov PCh. 2014. Three independent forms of cardio-respiratory coupling: transitions across sleep stages. Comput. Cardiol. 41, 781–784. See http://www.cinc.org/archives/2014/pdf/0781.pdf. [PMC free article] [PubMed] [Google Scholar]
- 28.Stankovski T, Duggento A, McClintock PVE, Stefanovska A. 2012. Inference of time-evolving coupled dynamical systems in the presence of noise. Phys. Rev. Lett. 109, 024101 ( 10.1103/PhysRevLett.109.024101) [DOI] [PubMed] [Google Scholar]
- 29.Stankovski T, Ticcinelli V, McClintock PVE, Stefanovska A. 2015. Coupling functions in networks of oscillators. New J. Phys. 17, 035002 ( 10.1088/1367-2630/17/3/035002) [DOI] [Google Scholar]
- 30.Napadow V, Dhond R, Conti G, Makris N, Brown EN, Barbieri R. 2008. Brain correlates of autonomic modulation: combining heart rate variability with fMRI. NeuroImage 42, 169–177. ( 10.1016/j.neuroimage.2008.04.238) [DOI] [PMC free article] [PubMed] [Google Scholar]
- 31.Song LZ, Schwartz GE, Russek LG. 1998. Heart-focused attention and heart–brain synchronization: energetic and physiological mechanisms. Altern. Ther. Health Med. 4(5), 44–52, 54–60, 62. [PubMed] [Google Scholar]
- 32.Dumont M, Jurysta F, Lanquart J-P, Migeotte P-F, van de Borne P, Linkowski P. 2004. Interdependency between heart rate variability and sleep EEG: linear/non-linear? Clin. Neurophysiol. 115, 2031–2040. ( 10.1016/j.clinph.2004.04.007) [DOI] [PubMed] [Google Scholar]
- 33.Chen Z, Hu K, Stanley HE, Novak V, Ivanov PCh. 2006. Cross-correlation of instantaneous phase increments in pressure-flow fluctuations: applications to cerebral autoregulation. Phys. Rev. E 73, 031915 ( 10.1103/PhysRevE.73.031915) [DOI] [PMC free article] [PubMed] [Google Scholar]
- 34.McCraty R, Atkinson M, Tomasino D, Bradley RT. 2009. The coherent heart: heart–brain interactions, psychophysiological coherence, and the emergence of system-wide order. Integral Rev. 5(2), 10–115. See http://integral-review.org/pdf-template-issue.php?pdfName=vol_5_no_2_mccraty_et_al_the_coherent_heart.pdf. [Google Scholar]
- 35.Long X, Arends JB, Aarts RM, Haakma R, Fonseca P, Rolink J. 2015. Time delay between cardiac and brain activity during sleep transitions. Appl. Phys. Lett. 106, 143702 ( 10.1063/1.4917221) [DOI] [Google Scholar]
- 36.Bashan A, Bartsch RP, Kantelhardt JW, Havlin S, Ivanov PCh. 2012. Network physiology reveals relations between network topology and physiological function. Nat. Commun. 3, 702 ( 10.1038/ncomms1705) [DOI] [PMC free article] [PubMed] [Google Scholar]
- 37.Faes L, Nollo G, Jurysta F, Marinazzo D. 2014. Information dynamics of brain–heart physiological networks during sleep. New J. Phys. 16, 105005 ( 10.1088/1367-2630/16/10/105005) [DOI] [Google Scholar]
- 38.Faes L, Marinazzo D, Jurysta F, Nollo G. 2015. Linear and non-linear brain–heart and brain–brain interactions during sleep. Physiol. Meas. 36, 683–698. ( 10.1088/0967-3334/36/4/683) [DOI] [PubMed] [Google Scholar]
- 39.Ivanov PCh, Bartsch RP. 2014. Network physiology: mapping interactions between networks of physiologic networks. In Networks of networks: the last frontier of complexity (eds G D'Agostino, A Scala), ch. 10, pp. 203–222. Understanding Complex Systems series. Cham, Switzerland: Springer International ( 10.1007/978-3-319-03518-5_10). [DOI] [Google Scholar]
- 40.Bartsch RP, Liu KKL, Bashan A, Ivanov PC. 2015. Network physiology: how organ systems dynamically interact. PLoS ONE 10, e0142143 ( 10.1371/journal.pone.0142143) [DOI] [PMC free article] [PubMed] [Google Scholar]
- 41.Liu KKL, Bartsch RP, Lin A, Mantegna RN, Ivanov PC. 2015. Plasticity of brain wave network interactions and evolution across physiologic states. Front. Neural Circuits 9, 62 ( 10.3389/fncir.2015.00062) [DOI] [PMC free article] [PubMed] [Google Scholar]
- 42.Liu KKL, Bartsch RP, Ma QDY, Ivanov PCh. 2015. Major component analysis of dynamic networks of physiologic organ interactions. J. Phys. Conf. Ser. 640, 012013 ( 10.1088/1742-6596/640/1/012013) [DOI] [PMC free article] [PubMed] [Google Scholar]
- 43.Klösch G. et al. 2001. The SIESTA project polygraphic and clinical database. IEEE Eng. Med. Biol. Mag. 20, 51–57. ( 10.1109/51.932725) [DOI] [PubMed] [Google Scholar]
- 44.Rechtschaffen A, Kales A. 1968. A manual of standardized terminology, techniques and scoring system for sleep stages of human subjects. Bethesda, MD: U.S. Department of Health, Education, and Welfare. [Google Scholar]
- 45.Press WH, Teukolsky SA, Vetterling WT, Flannery BP. 2007. Numerical recipes: the art of scientific computing, 3rd edn Cambridge, UK: Cambridge University Press. [Google Scholar]
- 46.Campbell IG. 2009. Unit 10.2: EEG recording and analysis for sleep research. In Current protocols in neuroscience, Suppl. 49, pp. 10.2.1–10.2.19. Hoboken, NJ: John Wiley & Sons ( 10.1002/0471142301.ns1002s49) [DOI] [PMC free article] [PubMed] [Google Scholar]
Associated Data
This section collects any data citations, data availability statements, or supplementary materials included in this article.
Supplementary Materials
Data Availability Statement
The data we used in this work are pre-existing multi-channel physiologic recordings from EU SIESTA databases. The detailed protocol of the SIESTA database can be found in Klösch et al. [43]. All participants provided written informed consent.