

Abstract
Objective
Cortical atrophy is a biomarker of Alzheimer’s disease (AD) that correlates with clinical symptoms. This study examined changes in cortical thickness from before to after an exercise intervention in Mild Cognitive Impairment (MCI) and healthy elders.
Method
Thirty physically inactive older adults (14 MCI, 16 healthy controls) underwent MRI before and after participating in a 12-week moderate intensity walking intervention. Participants were between the ages of 61 and 88. Change in cardiorespiratory fitness was assessed using residualized scores of the peak rate of oxygen consumption (V̇O2peak) from pre- to post-intervention. Structural magnetic resonance images were processed using FreeSurfer v5.1.0.
Results
V̇O2peak increased an average of 8.49%, which was comparable between MCI and healthy elders. Overall, cortical thickness was stable except for a significant decrease in the right fusiform gyrus in both groups. However, improvement in cardiorespiratory fitness due to the intervention (V̇O2peak) was positively correlated with cortical thickness change in the bilateral insula, precentral gyri, precuneus, posterior cingulate, and inferior and superior frontal cortices. Moreover, MCI participants exhibited stronger positive correlations compared to healthy elders in the left insula and superior temporal gyrus.
Discussion
A 12-week moderate intensity walking intervention led to significantly improved fitness in both MCI and healthy elders. Improved V̇O2peak was associated with widespread increased cortical thickness, which was similar between MCI and healthy elders. Thus, regular exercise may be an especially beneficial intervention to counteract cortical atrophy in all risk groups, and may provide protection against future cognitive decline in both healthy elders and MCI.
Keywords: aerobic fitness, aging, Alzheimer’s disease, exercise, cognition, neural plasticity, physical activity, structural MRI
Alzheimer’s disease (AD) is characterized by an insidious onset and gradual decline of cognitive abilities that eventually render patients unable to carry out activities of daily living (ADLs), such as bathing and dressing, which necessitates assisted living (American Psychiatric Association, 2013). AD diagnoses are expected to increase exponentially from 5 million in 2013 to a projected 14 million in 2050 (Alzheimer's, 2013). Mild cognitive impairment (MCI) is considered a prodromal phase of dementia and is characterized by cognitive decline in the absence of functional impairment (American Psychiatric Association, 2013). MCI represents a high-risk state for AD conversion (Albert et al., 2011; Petersen et al., 2001), with 40% progressing to AD over a 4-year period (Petersen, 2000) and approximately 60% exhibiting autopsy-verified AD post-mortem (DeKosky & Marek, 2003). MCI prognosis varies and many patients remain cognitively stable (Gauthier et al., 2006). The variability of disease progression suggests that MCI may be an opportunity to implement interventions aimed at slowing the rate of neurodegeneration and cognitive decline.
Cortical thickness is a useful biomarker to track cognitive and neuropathological symptoms of dementia (Apostolova et al., 2012; Devanand et al., 2007; Jack et al., 2011; Whitwell et al., 2007) including tau and amyloid beta protein deposition (Desikan et al., 2009) and future conversion to AD (Gomar et al., 2011). Specific regions that are most vulnerable to atrophy among individuals diagnosed with MCI include the inferior and medial temporal cortices, precuneus, posterior cingulate, temporoparietal junction, (Whitwell et al., 2007) entorhinal cortex, and hippocampus (Devanand et al., 2007). While it is recognized that cortical thinning is a marker of AD progression, there is little evidence that interventions may be able to slow or preclude atrophy in these regions in individuals who have already experienced cognitive decline and are in the prodromal stage of AD.
A recent NIH consensus panel concluded that while there is no definitive evidence that any modifiable factor is associated with reduced risk for AD, there have been promising yet inconclusive results from exercise interventions (Daviglus et al., 2010). Exercise training has been shown to increase hippocampal volume (Erickson et al., 2011) and grey and white matter volume density (Colcombe et al., 2006) in healthy older adults. There is also preliminary evidence that exercise training may improve cognitive function (Baker et al., 2010; Gauthier et al., 2006; Lautenschlager et al., 2008; Smith et al., 2013), increase neural efficiency during semantic memory retrieval (Smith et al., 2013), and promote the preservation of hippocampal volume (ten Brinke et al., 2015) among those diagnosed with MCI. While there is evidence that exercise may have neurotrophic effects on greater gray matter volume in healthy older adults, it is not known if exercise-induced cortical plasticity is possible in people diagnosed with MCI.
The current study sought to examine cortical thickness changes associated with a 12-week exercise intervention in MCI and healthy elders. This study is an extension of our previously published paper (Smith et al., 2013), which found that this 12-week moderate intensity walking intervention resulted in decreased activation in several cortical regions during a semantic memory-related famous name discrimination task (Smith et al., 2013). Based on previous studies (Colcombe et al., 2006), we predicted that cortical thickness would increase in response to exercise training in healthy elders, and that this effect would also be present but attenuated in older adults diagnosed with MCI due to the progression of cognitive decline and cortical thinning (McDonald et al., 2009). We also predicted that changes in cortical thickness would be positively associated with changes in cardiorespiratory fitness (V̇O2peak), such that MCI and healthy elders who achieved greater gains in fitness would show greater increases in cortical thickness.
Method
Participants
This study was conducted according to the Declaration of Helsinki and was approved by the Institutional Review Board at the Medical College of Wisconsin. All research participants provided written informed consent. Thirty-five community dwelling older adults between ages 60 and 88 participated in the exercise training intervention. Recruitment was completed through informational sessions that took place at retirement communities and recreation centers, advertisements, and physician referrals. All participants received physician approval to ensure safety for a moderate intensity exercise program. For more details regarding recruitment and participant characteristics, refer to Smith et al. (2013).
Participants were included if they reported being engaged in moderate intensity physical activity less than three days per week for the past six months. Exclusion criteria included a history of neurological illnesses (i.e., head trauma with loss of consciousness >30 min, cerebral ischemia, vascular headache, carotid artery disease, cerebral palsy, epilepsy, brain tumor, chronic meningitis, multiple sclerosis, pernicious anemia, normal-pressure hydrocephalus, HIV infection, Parkinson’s disease, or Huntington’s disease); medical illnesses that potentially influence brain function (i.e., untreated hypertension, glaucoma, and chronic obstructive pulmonary disease); untreated DSM-IV Axis I disorders (i.e., severe depressive symptoms, substance abuse or dependence); and specific criteria pursuant to MR scanning (i.e., pregnancy; weight inappropriate for height; ferrous objects within the body; history of claustrophobia; left-handedness; current use of psychotropic medications, except stable doses of SSRI and SNRI; unstable or severe cardiovascular disease or asthmatic condition; history of transient ischemic attack; or > 4 on the modified Hachinski ischemic scale). Participants were also excluded if they showed impaired ADLs measured by the Lawton and Brody Self- Maintaining and Instrumental Activities of Daily Living Scale (Lawton & Brody, 1970). Participants taking anti-hypertensive medications were included if the dosage was stable for at least one month prior to and during the intervention. There were no significant differences between the groups in use of acetylcholinesterase inhibitors.
MCI was determined using the clinical criteria detailed by the NIH-Alzheimer’s Association workgroup on the diagnosis of MCI due to AD (Albert et al., 2011): subjective concern about a change in cognition; objective impairment in one or more cognitive domains on neuropsychological testing; preservation of independent ADLs; and not demented. Impairment was deemed by clinical consensus amongst three clinicians (including KAN) based on comparison with age and education norms. A neurologist with expertise in dementia examined all MCI participants to rule out other possible etiologies for cognitive impairment. All MCI participants obtained a modified Hachinski ischemia score below 4. At Risk and Control participants were required to perform within normal limits on neuropsychological testing.
The neuropsychological battery used for this determination (as well as pre-post intervention cognitive assessment included the Mini-Mental State Exam (MMSE; Folstein, Folstein, & McHugh, 1975), Mattis Dementia Rating Scale–2 (DRS; Jurica, Leitten, & Mattis, 2004), Rey Auditory Verbal Learning Test (RAVLT; Rey, 1964), Logical Memory and Letter-Number Sequencing subtests from the Wechsler Memory Scale-III (WMS-III; Wechsler, 1997), Symbol-Digit Modalities Test (SDMT; Smith, 1991), Controlled Oral Word Association Test (COWAT; Benton & Hamsher, 1978), Animal Fluency (Goodglass & Kaplan, 1983), and the Clock Drawing Test (Cosentino, Jefferson, Chute, Kaplan, & Libon, 2004). Alternate forms of the RAVLT and the DRS were used at the pre- and post-intervention test sessions. The specific cognitive performances and differences between the two participant groups, is explained in detail in our prior study (Smith et al., 2013).
Graded Exercise Test
Before and after the exercise intervention, participants completed a submaximal exercise test to estimate peak aerobic capacity (V̇O2peak). Resting heart rate was determined after 10 minutes of supine rest prior to each exercise test. The metabolic cart system was calibrated against known concentrations of O2 and CO2. The exercise test was conducted on a motorized treadmill (General Electric, Milwaukee, WI) using a modified Balke-Ware protocol of 2.0 mi/h (3.2 km/h) beginning with 0° grade, and increasing 1° per min, in accordance with the American College of Sports Medicine Guidelines (American College of Sports Medicine, 2010). The beginning and end of each test included 3-5 minutes of level walking at 1-2 mi/h (1.6–3.2 km/h). Each test included the measurement of heart rate, blood pressure (every 2 min), ratings of perceived exertion (RPE; each minute), and concentrations of oxygen and carbon dioxide in expired air (V̇O2, V̇CO2, respectively; every 15 s) (ParvoMedics, Sandy, UT). Termination criteria for the exercise test included reaching 85% of age-predicted maximal heart rate, a diastolic blood pressure of >110 mmHg, or the participant wanting to stop the test. The peak rate of oxygen uptake (V̇O2peak expressed as ml/kg/minute at STPD) was estimated from the highest V̇O2 value achieved during the test (American College of Sports Medicine, 2010).
Exercise Intervention
The intervention is described in more detail in Smith et al. (2013). Briefly, participants completed 44 total sessions of treadmill walking over 12 weeks. Exercise intensity, session duration, and session frequency gradually increased during the first four weeks of the intervention until participants were completing four sessions weekly and walking for 30 minutes each session at 50-60% of HRR, which is considered moderate intensity exercise for older adults (Mazzeo & Tanaka, 2001). The exercise intervention was customized to each participant based on individual baseline exercise capacity. The treadmill speed and incline were modified each session based on heart rate and perceived subjective effort of the participant (<15 on the Borg 6-20 RPE scale). The intervention was intended to be moderately challenging and to improve V̇O2peak. A personal fitness trainer or exercise physiologist supervised each session. Sessions were conducted at a fitness center near the participants’ homes. Heart rate was continuously monitored with a Polar® heart rate monitor and participants provided subjective ratings of perceived exertion at minutes 5, 15, and 30 during each session (Borg, 1998; Cook, O'Connor, Eubanks, Smith, & Lee, 1997). Participants exercised individually or in groups of two. The beginning and end of each session included 10 minutes of light walking and flexibility exercises.
MRI Acquisition and Analysis
Whole-brain anatomical magnetic resonance imaging (MRI) was conducted on a General Electric (Waukesha, WI) 3.0 Tesla scanner equipped with a quad split quadrature transmit/receive head coil. High-resolution, three-dimensional spoiled gradient-recalled at steady-state (SPGR) anatomic images were acquired (TE = 3.9 ms; TR = 9.6 ms; inversion recovery (IR) preparation time = 450 ms; flip angle = 12°; number of excitations (NEX)=1; slice thickness = 1.0 mm; FOV = 240 mm; resolution=256×224). Foam padding was used to reduce head movement within the coil.
MRI data were processed using FreeSurfer 5.1.0 (http://surfer.nmr.mgh.harvard.edu). Each image underwent a processing stream to include longitudinal data with two time points (pre- and post-intervention). Each image was first processed for removal of non-brain tissue, automated Talairach transformation, intensity normalization, automated topology correction, and segmentation of white and gray matter. A white matter surface was generated through tessellation of the gray matter-white matter junction, which was deformed and inflated to approximate the gray matter–CSF boundary for cortical reconstruction. The cerebral cortex was parcellated into units with respect to gyral and sulcal structure according to the Desikan-Killiany atlas (Desikan et al., 2006). The longitudinal processing stream was used to create an unbiased within-subject template space and provide robust, inverse consistent registration (Reuter, Rosas, & Fischl, 2010). Atlas registration, spherical surface maps, and parcellations were then initialized with common information from the within-subject template to significantly increase reliability and statistical power (Reuter, Schmansky, Rosas, & Fischl, 2012). Topological defects were corrected using both automated and manual methods. A trained rater (KR), blind to participant group membership, manually edited each MRI volume to improve the accuracy of the cortical thickness measurements. Edits were made to each scan and typically consisted of correcting for frontal and temporal pole exclusion, and removing the skull and eye socket that were classified as gray matter during automated segmentation.
Cortical thickness maps were created using the Query, Design, Estimate, Contrast (QDEC) application within FreeSurfer. Longitudinal changes were assessed with a surface created by QDEC that includes percent change values from baseline to post-intervention at each vertex. QDEC runs a general linear model including selected explanatory factors (i.e. V̇O2peak change) on each vertex of the brain. A 15-mm full-width at half maximum (FWHM) kernel was applied to the cortical thickness data along the cortical surface. Significance values were adjusted for multiple comparisons using a False Discovery Rate (FDR) threshold of p < 0.05 and visualized on the surface as −log(10)p.
Cardiorespiratory Fitness Analysis
Change in V̇O2peak was assessed through residual scores estimated from linear regression analysis that predicted post-intervention V̇O2peak from pre-intervention V̇O2peak. This method corrects for regression to the mean, practice effects, and has shown to be an effective tool to assess physiological and psychological changes (Llabre, Spitzer, Saab, Ironson, & Schneiderman, 1991; McSweeny, Naughle, Chelune, & Lüders, 1993; Temkin, Heaton, Grant, & Dikmen, 1999).
Data Analysis
First, whole-group cortical thickness change from pre- to post-intervention was assessed in both MCI and healthy elders with a whole-brain approach using FreeSurfer with correction for multiple comparisons using FDR. For reach region that was statistically significant in the whole-groups analysis, a label was created to extract percent change from pre- to post- intervention for each participant in the selected vertices. Between-groups analysis for these regions was conducted in SPSS version 21 using analysis of variance (ANOVA). Second, a whole-group analysis, using a whole-brain approach corrected for multiple comparisons with FDR, was conducted to examine the correlations between change in V̇O2peak and change in cortical thickness from pre- to post-intervention. We also examined the influence of age, sex, education, and APOE-ε4 inheritance, with only age being negatively related to change in fitness. In addition, only age was weakly negatively correlated with change in cortical thickness in several regions confined to the frontal lobe; however, none of these associations survived FDR correction. Third, the whole-brain correlational analysis was followed by a region of interest analysis to determine if there were differences between the groups in the magnitude of the correlation between change in V̇O2peak and change in cortical thickness. The regions of interest were defined as those regions that showed a statistically significant relationship between cortical thickness change and V̇O2peak change in the whole-group analysis. The percent change in cortical thickness from pre- to post- intervention was extracted from each region of interest for each participant. Then, a Pearson correlation coefficient was calculated between change in cortical thickness and change in fitness within each group. The strength of the correlation coefficients between MCI and healthy elders were compared using Fisher’s r to z transformation, with FDR correction for multiple comparisons.
Results
Participant Characteristics and Exercise Intervention Intensity
Thirty-five participants (17 MCI, 18 healthy controls) completed the exercise intervention. Of those, five were excluded from further analyses (3 MCI, 2 healthy controls) due to missing post-intervention V̇O2peak data (3 subjects), missing MRI data (1 subject), and outlier V̇O2peak change that was influenced by reduced body weight (1 subject). Participant demographic information is provided in Table 1. Participant groups were not statistically different in age, sex, education, or exercise intensity performed during the intervention. The mean adherence rate to the 44 exercise sessions was 96%.
Table 1.
Demographic and exercise intervention intensity characteristics of the participants.
| Variable | MCI |
Healthy Controls |
|||
|---|---|---|---|---|---|
| Mean (SD) | Range | Mean (SD) | Range | p | |
| Demographic Characteristics | |||||
| N | 14 | 16 | |||
| Age | 78.85 (7.75) | 65-88 | 75.87 (6.90) | 61-85 | 0.27 |
| Sex | |||||
| Male/Female | 6/8 | 3/13 | 0.24 | ||
| Education (years) | 15.93 (3.10) | 12-24 | 16.44 (2.03) | 12-20 | 0.60 |
| Intervention Intensity | |||||
| Heart rate (beats/min) | 104.91 (11.27) | 80.32-121.61 | 111.72 (6.98) | 97.25-121.85 | 0.05 |
| Perceived Exertion | |||||
| Borg 6-20 RPE Scale | 10.85 (2.16) | 7.35-15.62 | 10.92 (1.52) | 7.01-12.75 | 0.91 |
| Treadmill speed (meters/sec) | 2.68 (0.44) | 1.76-3.43 | 2.76 (0.60) | 1.45-3.62 | 0.69 |
| Treadmill incline (% grade) | 4.22 (2.55) | 1.17-10.87 | 4.06 (2.77) | 0.39-9.95 | 0.87 |
Notes: MCI=Mild Cognitive Impairment; RPE=ratings of perceived exertion; P-values are associated with t-tests and χ2 tests to determine group differences.
Cardiorespiratory Fitness Change
V̇O2peak increased from pre- to post-intervention by a mean of 8.49%, which was statistically significant (F(1,27)=6.57, partial η2=0.20, p=0.02. This effect was not statistically different by cognitive group status, F(1,27)=0.07, partial η2=0.00, p=0.79).
Cortical Thickness Change from Pre- to Post- Walking Intervention
Cortical thickness as a function of the 12-week exercise intervention was relatively stable. One region in the right fusiform gyrus showed a significant decrease from pre- to post- intervention, F(1,27)=21.37, partial η2=0.44, p<0.001 and was not statistically different by cognitive status group, F(1,27)=2.32, partial η2=0.08, p=0.14.
Cortical Thickness Change as a Function of Cardiorespiratory Fitness
Given that cortical thickness did not change considerably as a result of the 12-week walking intervention, and given the large variability in cortical thickness changes within both groups, the possibility that change in cortical thickness would be related to the change in cardiorespiratory fitness over time was queried. Multiple and extensive brain regions exhibited significant positive correlations between fitness increase and increase in cortical thickness across participants (see Figure 1 and Table 2).
Figure 1.
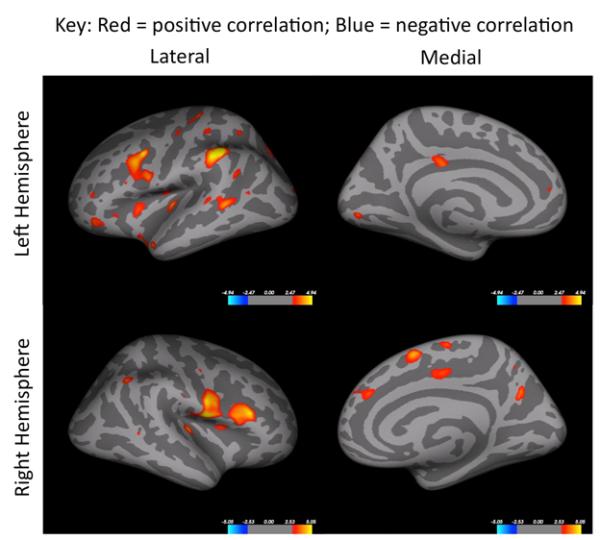
Correlations between change in cortical thickness and residualized V̇O2peak change are shown for in all participants. Colored regions are areas of statistical significance (−log10(p) with FDR correction of p < .05). Red to yellow color scheme represents positive correlations and blue colors indicate a negative correlation.
Table 2.
Areas that showed a significant correlation between change in cortical thickness and residualized V̇O2peak change after intervention in all participants (shown in Figure 1).
| Side | Region | x | y | z | Pearson's r | Surface Area (mm2) |
|---|---|---|---|---|---|---|
| Frontal Lobes | ||||||
| L | Insula | −39.91 | −9.09 | 16.92 | 0.60 | 204.34 |
| L | Insula | −37.60 | −3.08 | −17.58 | 0.68 | 334.96 |
| L | Insula | −36.82 | −24.51 | −.044 | 0.66 | 196.37 |
| L | Insula | −30.47 | 10.52 | 5.93 | 0.59 | 118.56 |
| L | MdFG | −12.77 | 45.65 | 10.79 | 0.55 | 16.69 |
| L | MFG/IFG/PreG | −33.09 | 9.03 | 23.63 | 0.74 | 746.22 |
| L | Pars orbitalis | −39.67 | 36.41 | −11.72 | 0.65 | 197.63 |
| L | Pars triangularis | −33.08 | 31.22 | −3.37 | 0.56 | 45.30 |
| L | PreG | −32.36 | −14.40 | 42.05 | 0.57 | 69.89 |
| L | Rostral MFG | −15.64 | 85.35 | −11.15 | 0.58 | 31.62 |
| R | Insula | 35.49 | 8.12 | 12.14 | 0.64 | 117.90 |
| R | MdFG | 9.38 | 42.24 | 25.09 | 0.61 | 161.95 |
| R | MdFG | 8.09 | 8.91 | 50.74 | 0.65 | 178.12 |
| R | Pars opercularis | 26.05 | 54.34 | −3.76 | 0.64 | 741.59 |
| R | PreG | 53.35 | −2.60 | 10.79 | 0.78 | 1065.88 |
| R | PreG | 44.46 | −6.45 | 41.02 | 0.57 | 33.48 |
| Temporal Lobes | ||||||
| L | Bankssts | −50.10 | −44.68 | 3.58 | 0.64 | 227.57 |
| L | STG | −46.58 | 10.05 | −21.06 | 0.59 | 109.89 |
| L | STG | −63.84 | −31.54 | 7.46 | 0.60 | 105.21 |
| R | Bankssts | 57.18 | −47.45 | 5.21 | 0.58 | 28.50 |
| R | Transverse temporal | 40.08 | −25.75 | 4.79 | 0.51 | 119.45 |
| Parietal Lobes | ||||||
| L | Inferior Parietal | −47.08 | −60.26 | 13.12 | 0.73 | 21.70 |
| L | Lingual | −6.00 | −84.29 | −1.68 | 0.62 | 102.07 |
| L | Postcentral | −29.37 | −27.27 | 53.03 | 0.75 | 676.95 |
| L | Postcentral | −39.00 | −30.91 | 47.92 | 0.59 | 113.14 |
| L | Posterior Cingulate | −6.98 | −23.90 | 29.64 | 0.62 | 124.87 |
| L | Superior Parietal | −28.01 | −49.29 | 48.80 | 0.57 | 59.09 |
| L | Superior Parietal | 14.67 | −82.23 | 29.23 | 0.69 | 448.97 |
| L | Supramarginal | −50.83 | −50.98 | 23.03 | 0.59 | 68.57 |
| L | Supramarginal | −55.58 | −35.84 | 39.57 | 0.79 | 568.78 |
| R | Inferior Parietal | 48.07 | −52.00 | 42.23 | 0.63 | 64.30 |
| R | Para central | 6.14 | −11.16 | 57.41 | 0.62 | 82.74 |
| R | Posterior Cingulate | 12.03 | −9.52 | 37.21 | 0.64 | 145.60 |
| R | Precuneus | 9.61 | −56.51 | 44.74 | 0.56 | 12.35 |
| R | Precuneus | 9.73 | −61.15 | 29.23 | 0.64 | 234.19 |
| R | Supramarginal | 56.78 | −17.67 | 25.64 | 0.57 | 12.25 |
| Occipital Lobes | ||||||
| L | Lateral Occipital | −22.89 | −92.82 | 17.38 | 0.59 | 57.04 |
Notes: banksst=banks of the superior temporal sulcus; IFG=inferior frontal gyrus; L=left hemisphere; R=right hemisphere; MFG=middle frontal gyrus; MdFG=medial frontal gyrus; PreG=Precentral gyrus STG=superior temporal gyrus.
Further exploration of between-group differences in the magnitude of this correlation was assessed. Fisher’s r to z transformation revealed larger fitness-related changes in cortical thickness in the MCI group compared to the healthy elders in the left insula (p=0.04) and the left superior temporal gyrus (p=0.01) (See Figure 2). No other statistically significant between-group differences were observed.
Figure 2.
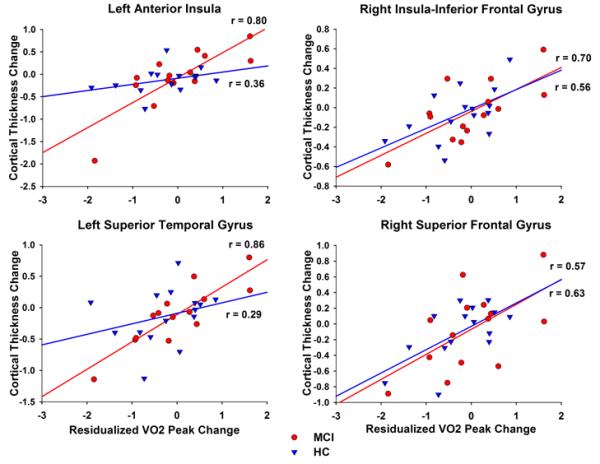
Correlations between change in cortical thickness and residualized V̇O2peak change by group. Significant group differences were observed in the left anterior insula (top left) and the left superior temporal gyrus (bottom left). The correlation coefficient was statistically larger in the MCI group, compared to healthy elders in both regions. In contrast, as examples of the remaining regions where the associations were similar in both groups, there were no group differences in the right insula/inferior frontal gyrus (top right) and right superior frontal gyrus (bottom right).
Discussion
We found that moderate intensity exercise over 3 months increased cardiorespiratory fitness in both healthy elders and in older adults diagnosed with MCI. Furthermore, increased fitness was positively associated with increased cortical thickness in regions that are vulnerable to AD-related atrophy (McEvoy et al., 2009; Misra, Fan, & Davatzikos, 2009; Whitwell et al., 2007). Specifically, these associations were observed in bilateral inferior frontal gyri, insula, left medial temporal gyrus, posterior cingulate, supramarginal gyrus, and the right medial superior frontal gyrus and precuneus. The consistency of these associations in both MCI and healthy elders suggests that exercise training may produce a comparable cortical structural benefit for both healthy and cognitively impaired older adults. We predicted that these associations would be attenuated in individuals diagnosed with MCI. However, the similar magnitude of effects in the MCI group is a promising step toward addressing questions related to the extent and potential for neuroplasticity in a population that has likely experienced AD-related neurodegeneration. Stronger associations between change in fitness and change in cortical thickness were found in the MCI group compared to the healthy control group in two regions, the only group differences that were observed, underscoring the potential neurotrophic effects of exercise in MCI.
We also hypothesized that there would be increased absolute cortical thickness from before to after the intervention. However, on average cortical thickness was relatively stable throughout the intervention period, with the exception of the decrease in the right fusiform gyrus in both groups. Evidence suggests that this region may be particular vulnerable to atrophy in both MCI and healthy aging (Fjell et al., 2014; Hogstrom, Westlye, Walhovd, & Fjell, 2012; McDonald et al., 2012; Yao et al., 2012). A moderate intensity walking exercise intervention is aligned with the healthy living physical activity recommendations for older adults (American College of Sports Medicine, 2010). Also, walking is an activity that can be safely performed by most people and is encouraged in many retirement communities (Mazzeo & Tanaka, 2001). Our exercise intervention was effective to significantly improve cardiorespiratory fitness. There is evidence to suggest that higher intensity exercise may lead to greater cortical thickness changes (Cotman & Berchtold, 2002; van Praag, Kempermann, & Gage, 1999). The participants in our study were not exclusively sedentary at baseline, and our intervention was relatively brief. Thus, it is possible that greater effects on cortical thickness may have been observed if greater changes in fitness had been achieved, or if the intervention had been longer in duration. Nevertheless, the considerable variability in the changes in cortical thickness that occurred in both the healthy and MCI participant groups could be accounted for, in part, by the amount of change in cardiorespiratory fitness.
Furthermore, we found that the MCI showed stronger positive relationships between change in cortical thickness and change in cardiorespiratory fitness in two regions; the left insula and left superior temporal gyrus. Both of these regions have shown reduced cortical density in MCI compared to healthy controls (Karas et al., 2004). Furthermore, fMRI studies indicate that decreased activity in the anterior insula network system, which includes the superior temporal gyrus, differentiates MCI versus healthy controls (Xie et al., 2012). Thus, it appears that the left superior temporal gyrus and insula are regions vulnerable to functional and structural alterations associated with progression to MCI and AD. Our findings of stronger associations in the MCI participants between change in fitness and change in cortical thickness in these two regions suggests that exercise may provide a restorative influence and possibly counteract these neurodegenerative processes.
A review of the existing literature corroborates a positive relationship between fitness change and cortical volume change in an aging population (Erickson, Leckie, & Weinstein, 2014); however, very few studies examined this relationship in response to an intervention using cortical thickness as an outcome measure. A similar study that examined gray matter volume change with respect to fitness change (defined as kcals per week) in a 6-month walking intervention showed a positive relationship in bilateral cingulate and occipital regions, and left prefrontal regions (Ruscheweyh et al., 2011).
Interestingly, our earlier work in the same groups of MCI and healthy elders showed reduced fMRI activation during a famous names discrimination task from pre- to post- intervention (Smith et al., 2013) in overlapping regions that exhibited a positive relationship between changes in fitness and cortical thickness. Specifically, the left middle temporal gyrus, precentral gyrus, and right precuneus showed both increased neuronal efficiency in semantic memory in our prior study, and cortical plasticity associated with increased fitness in the current study. Past research has shown that cortical atrophy in the preclinical stages of AD is associated with increased fMRI activation and is thought to be a compensatory response within memory networks to maintain normal cognitive function (Buckner et al., 2005). Over time, hyper-activation is thought to lead to neural inefficiency, and eventually the degeneration of memory networks (Sperling et al., 2009). It is plausible that exercise may produce neurotrophic effects that enhance cortical thickness, thereby improving the efficiency within these neural networks. Although this study was not designed to examine changes in neural activation efficiency during memory retrieval or whether these changes were mediated by fitness-related increases in cortical thickness, the present results would be consistent with this interpretation. Further research is needed to examine this possibility more conclusively.
To our knowledge, this is the first study to examine cortical thickness MRI outcomes in older adults with MCI after an exercise intervention. Only one previous study examined the influence of exercise training on brain structure in MCI, however it only focused on the hippocampus (ten Brinke et al., 2015). The 6-month randomized control trial in women with MCI revealed stable hippocampal volume in aerobic exercise groups compared to a control group. Yet, it is difficult to directly compare to the current results because neither cortical volume nor cortical thickness data were reported. Others have reported that participants with MCI displayed cognitive gains from exercise training in category fluency, an index of semantic memory retrieval (Baker et al., 2010) and in verbal memory (Smith et al., 2013). The precise mechanisms for these effects are not known. The limited evidence for exercise to benefit brain function and structure in MCI suggests, however, that the mechanisms by which exercise produces these effects in healthy older adults may also occur in MCI.
The most well known neurobiological mechanism for the neuroprotective effects of exercise is neurogenesis, which has been most studied in the hippocampus (Eriksson et al., 1998; van Praag et al., 1999). Exercise training in healthy elders is associated with an increase in brain-derived neurotrophic factor (BDNF) (Ruscheweyh et al., 2011), which has been shown to mediate the relationship of exercise and increased hippocampal volume (Erickson et al., 2011; Kramer, Erickson, & Colcombe, 2006) and is associated with greater neural connectivity between the temporal cortex and the hippocampus (Voss et al., 2013). These neurotrophic effects in the hippocampus are hypothesized to contribute to the benefits of exercise on memory performance (Pereira et al., 2007) and induce angiogenesis downstream in regions such as motor cortex (Swain et al., 2003). Thus, it is also possible that changes in cortical thickness, such as those demonstrated in the present study, reflect exercise-induced spinogenesis and/or dendritic branching (Eadie, Redila, & Christie, 2005). Moreover, exercise is known to potently protect against metabolic and cerebrovascular disease (Middleton et al., 2013) and neuroinflammation (Intlekofer & Cotman, 2013), which are known to increase the risk of AD (Honjo, Black, & Verhoeff, 2012; Martins et al., 2006). Indeed, physical inactivity has been associated with increased neuroinflammation and impaired adult neurogenesis (Voloboueva & Giffard, 2011). Thus, it is plausible that exercise promotes neuroprotection, in part, through its effects on the neurovascular system and reductions in inflammation.
There are several limitations to this study. In particular, the lack of a non-exercise or other control group limits the interpretation of cortical thickness change over the intervention period. However, it is unlikely that the association we observed between changes in cortical thickness and cardiorespiratory fitness could be attributed to the passage of time, social interaction, or exposure to learning. All participants were exposed to a similar degree of social contact, and had similar experiences learning the protocol and the treadmill exercise. Participants attended a mean of 42 out of 44 sessions, and this did not differ between groups, so it is unlikely that attendance could explain the results. In the absence of a regular exercise stimulus, cardiorespiratory fitness does not change, and if anything may decrease over 12-weeks. Thus, the increased fitness we observed can be attributed to the exercise that was performed. Therefore, the relationships between fitness improvements and increased cortical thickness were not likely due to extraneous variables. Nevertheless, the inclusion of a non-exercise control group would provide a more rigorous understanding of whether or not cortical thickness changes were due to the exercise alone. In addition, the 3-month intervention period does not provide an opportunity to observe longer-term changes in cortical thickness. A longer exercise intervention period, with follow-up after the intervention ends, would permit observation of the time-course of brain structural changes and if these changes may be maintained. Finally we enrolled participants who reported exercising no more than 2 days per week. It is possible that greater changes in fitness, and perhaps greater changes in cortical thickness, may have occurred in completely sedentary older adults.
In conclusion, the current findings suggest that moderate intensity walking exercise, previously shown in the same subjects to increase the efficiency of neuronal processing during semantic memory retrieval (Smith et al., 2013), may induce cortical plasticity through improved cardiorespiratory fitness in both MCI and healthy elders. Future research should examine fitness changes that coincide with neurobiological measures, such as BDNF, amyloid beta, and indices of vascular function and neuroinflammation, in MCI and in healthy older adults at increased genetic risk for AD (Smith et al., 2014).
Acknowledgments
We thank the participants for their time and dedication to this project. The authors also thank Piero Antuono, Alissa Butts, Ryan Hanson, Nathan Hantke, Karen Outzen, and Matthew Verber for assistance with various phases of this study. This study was supported by the University of Wisconsin-Milwaukee Graduate School Research Growth Initiative; and the National Center for Advancing Translational Sciences, National Institutes of Health grant numbers 8UL1TR000055 and 8KL2TR000056. Its contents are solely the responsibility of the authors and do not necessarily represent the official views of the NIH.
Footnotes
Disclosures of conflicts of interest: None
References
- Albert MS, DeKosky ST, Dickson D, Dubois B, Feldman HH, Fox NC, Phelps CH. The diagnosis of mild cognitive impairment due to Alzheimer's disease: recommendations from the National Institute on Aging-Alzheimer's Association workgroups on diagnostic guidelines for Alzheimer's disease. Alzheimers Dement. 2011;7(3):270–279. doi: 10.1016/j.jalz.2011.03.008. [DOI] [PMC free article] [PubMed] [Google Scholar]
- Alzheimer's, A. 2013 Alzheimer's disease facts and figures. Alzheimers Dement. 2013;9(2):208–245. doi: 10.1016/j.jalz.2013.02.003. [DOI] [PubMed] [Google Scholar]
- American College of Sports Medicine . In: ACSM's guidelines for exercise testing and prescription. 8th ed Thompson WR, Gordon NF, Pescatello LS, editors. Lippincott Williams & Wilkins; Philadelphia: 2010. [Google Scholar]
- American Psychiatric Association . Diagnostic and statistical manual of mental disorders. 5th ed Author; Washington, D.C.: 2013. [Google Scholar]
- Apostolova LG, Green AE, Babakchanian S, Hwang KS, Chou YY, Toga AW, Thompson PM. Hippocampal atrophy and ventricular enlargement in normal aging, mild cognitive impairment (MCI), and Alzheimer Disease. Alzheimer Dis Assoc Disord. 2012;26(1):17–27. doi: 10.1097/WAD.0b013e3182163b62. [DOI] [PMC free article] [PubMed] [Google Scholar]
- Baker LD, Frank LL, Foster-Schubert K, Green PS, Wilkinson CW, McTiernan A, Craft S. Effects of aerobic exercise on mild cognitive impairment: A controlled trial. Arch Neurol. 2010;67(1):71–79. doi: 10.1001/archneurol.2009.307. [DOI] [PMC free article] [PubMed] [Google Scholar]
- Benton A, Hamsher K. d. S. Multilingual aphasia exam manual. University of Iowa; Iowa City, IA: 1978. [Google Scholar]
- Borg G. Borg's Perceived exertion and pain scales. Human Kinetics; Champaign, IL: 1998. [Google Scholar]
- Buckner RL, Snyder AZ, Shannon BJ, LaRossa G, Sachs R, Fotenos AF, Mintun MA. Molecular, structural, and functional characterization of Alzheimer's disease: evidence for a relationship between default activity, amyloid, and memory. J Neurosci. 2005;25(34):7709–7717. doi: 10.1523/JNEUROSCI.2177-05.2005. [DOI] [PMC free article] [PubMed] [Google Scholar]
- Colcombe SJ, Erickson KI, Scalf PE, Kim JS, Prakash R, McAuley E, Kramer AF. Aerobic Exercise Training Increases Brain Volume in Aging Humans. The Journals of Gerontology Series A: Biological Sciences and Medical Sciences. 2006;61(11):1166–1170. doi: 10.1093/gerona/61.11.1166. [DOI] [PubMed] [Google Scholar]
- Cook DB, O'Connor PJ, Eubanks SA, Smith JC, Lee M. Naturally occurring muscle pain during exercise: assessment and experimental evidence. Med Sci Sports Exerc. 1997;29(8):999–1012. doi: 10.1097/00005768-199708000-00004. [DOI] [PubMed] [Google Scholar]
- Cosentino S, Jefferson A, Chute DL, Kaplan E, Libon DJ. Clock Drawing Errors in Dementia: Neuropsychological and Neuroanatomical Considerations. Cognitive and Behavioral Neurology. 2004;17(2):74–84. doi: 10.1097/01.wnn.0000119564.08162.46. [DOI] [PubMed] [Google Scholar]
- Cotman CW, Berchtold NC. Exercise: a behavioral intervention to enhance brain health and plasticity. Trends Neurosci. 2002;25(6):295–301. doi: 10.1016/s0166-2236(02)02143-4. [DOI] [PubMed] [Google Scholar]
- Daviglus ML, Bell CC, Berrettini W, Bowen PE, Connolly ES, Cox NJ, Trevisan M. NIH State-of-the-Science Conference Statement: Preventing Alzheimer's Disease and Cognitive Decline. NIH Consens State Sci Statements. 2010;27(4):1–30. doi: 2010-00034-STMT [pii] [PubMed] [Google Scholar]
- DeKosky ST, Marek K. Looking backward to move forward: early detection of neurodegenerative disorders. Science. 2003;302(5646):830–834. doi: 10.1126/science.1090349. [DOI] [PubMed] [Google Scholar]
- Desikan RS, Cabral HJ, Hess CP, Dillon WP, Glastonbury CM, Weiner MW, Alzheimer's Disease Neuroimaging, I. Automated MRI measures identify individuals with mild cognitive impairment and Alzheimer's disease. Brain. 2009;132(Pt 8):2048–2057. doi: 10.1093/brain/awp123. [DOI] [PMC free article] [PubMed] [Google Scholar]
- Desikan RS, Segonne F, Fischl B, Quinn BT, Dickerson BC, Blacker D, Killiany RJ. An automated labeling system for subdividing the human cerebral cortex on MRI scans into gyral based regions of interest. Neuroimage. 2006;31(3):968–980. doi: 10.1016/j.neuroimage.2006.01.021. [DOI] [PubMed] [Google Scholar]
- Devanand DP, Pradhaban G, Liu X, Khandji A, De Santi S, Segal S, de Leon MJ. Hippocampal and entorhinal atrophy in mild cognitive impairment: Prediction of Alzheimer disease. Neurology. 2007;68:828–836. doi: 10.1212/01.wnl.0000256697.20968.d7. [DOI] [PubMed] [Google Scholar]
- Eadie BD, Redila VA, Christie BR. Voluntary exercise alters the cytoarchitecture of the adult dentate gyrus by increasing cellular proliferation, dendritic complexity, and spine density. J Comp Neurol. 2005;486(1):39–47. doi: 10.1002/cne.20493. [DOI] [PubMed] [Google Scholar]
- Erickson KI, Leckie RL, Weinstein AM. Physical activity, fitness, and gray matter volume. Neurobiol Aging. 2014;35(Suppl 2):S20–28. doi: 10.1016/j.neurobiolaging.2014.03.034. [DOI] [PMC free article] [PubMed] [Google Scholar]
- Erickson KI, Voss MW, Prakash RS, Basak C, Szabo A, Chaddock L, White SM. Exercise training increases size of hippocampus and improves memory. Proceedings of the National Academy of Sciences. 2011 doi: 10.1073/pnas.1015950108. 201015950. [DOI] [PMC free article] [PubMed] [Google Scholar]
- Eriksson PS, Perfilieva E, Bjork-Eriksson T, Alborn AM, Nordborg C, Peterson DA, Gage FH. Neurogenesis in the adult human hippocampus. Nat.Med. 1998;4(11):1313–1317. doi: 10.1038/3305. [DOI] [PubMed] [Google Scholar]
- Fjell AM, Westlye LT, Grydeland H, Amlien I, Espeseth T, Reinvang I, Alzheimer Disease Neuroimaging, I. Accelerating cortical thinning: unique to dementia or universal in aging? Cereb Cortex. 2014;24(4):919–934. doi: 10.1093/cercor/bhs379. [DOI] [PMC free article] [PubMed] [Google Scholar]
- Folstein MF, Folstein SE, McHugh PR. “Mini-mental state”. A practical method for grading the cognitive state of patients for the clinician. J Psychiatr Res. 1975;12(3):189–198. doi: 10.1016/0022-3956(75)90026-6. [DOI] [PubMed] [Google Scholar]
- Gauthier S, Reisberg B, Zaudig M, Petersen RC, Ritchie K, Broich K, Winblad B. Mild cognitive impairment. The Lancet. 2006;367(9518):1262–1270. doi: 10.1016/s0140-6736(06)68542-5. [DOI] [PubMed] [Google Scholar]
- Gomar JJ, Bobes-Bascaran MT, Conejero-Goldberg C, Davies P, Goldberg TE, Initiative A. s. D. N. Utility of combinations of biomarkers, cognitive markers, and risk factors to predict conversion from mild cognitive impairment to Alzheimer disease in patients in the Alzheimer's disease neuroimaging initiative. Archives of general psychiatry. 2011;68(9):961–969. doi: 10.1001/archgenpsychiatry.2011.96. [DOI] [PubMed] [Google Scholar]
- Goodglass H, Kaplan E. The assessment of aphasia and related disorders. Lea & Febiger; 1983. [Google Scholar]
- Hogstrom LJ, Westlye LT, Walhovd KB, Fjell AM. The structure of the cerebral cortex across adult life: age-related patterns of surface area, thickness, and gyrification. Cereb Cortex. 2012;23(11):2521–2530. doi: 10.1093/cercor/bhs231. [DOI] [PubMed] [Google Scholar]
- Honjo K, Black SE, Verhoeff NP. Alzheimer's disease, cerebrovascular disease, and the beta-amyloid cascade. Can J Neurol Sci. 2012;39(6):712–728. doi: 10.1017/s0317167100015547. [DOI] [PubMed] [Google Scholar]
- Intlekofer KA, Cotman CW. Exercise counteracts declining hippocampal function in aging and Alzheimer's disease. Neurobiology of disease. 2013;57:47–55. doi: 10.1016/j.nbd.2012.06.011. [DOI] [PubMed] [Google Scholar]
- Jack CR, Jr., Vemuri P, Wiste HJ, Weigand SD, Aisen PS, Trojanowski JQ, Alzheimer's Disease Neuroimaging, I. Evidence for ordering of Alzheimer disease biomarkers. Arch Neurol. 2011;68(12):1526–1535. doi: 10.1001/archneurol.2011.183. [DOI] [PMC free article] [PubMed] [Google Scholar]
- Jurica PJ, Leitten CL, Mattis S. DRS-2 dementia rating scale-2: professional manual. Psychological Assessment Resources; 2004. [Google Scholar]
- Karas GB, Scheltens P, Rombouts SA, Visser PJ, van Schijndel RA, Fox NC, Barkhof F. Global and local gray matter loss in mild cognitive impairment and Alzheimer's disease. Neuroimage. 2004;23(2):708–716. doi: 10.1016/j.neuroimage.2004.07.006. [DOI] [PubMed] [Google Scholar]
- Kramer AF, Erickson KI, Colcombe SJ. Exercise, cognition, and the aging brain. J Appl Physiol (1985) 2006;101(4):1237–1242. doi: 10.1152/japplphysiol.00500.2006. [DOI] [PubMed] [Google Scholar]
- Lautenschlager NT, Cox KL, Flicker L, Foster JK, van Bockxmeer FM, Xiao J, Almeida OP. Effect of physical activity on cognitive function in older adults at risk for Alzheimer disease: a randomized trial. Journal of the American Medical Association. 2008;300(9):1027–1037. doi: 10.1001/jama.300.9.1027. [DOI] [PubMed] [Google Scholar]
- Lawton MP, Brody EM. Assessment of older people: Self-maintaining and instrumental activities of daily living. Nursing Research. 1970;19(3):278. [PubMed] [Google Scholar]
- Llabre MM, Spitzer SB, Saab PG, Ironson GH, Schneiderman N. The reliability and specificity of delta versus residualized change as measures of cardiovascular reactivity to behavioral challenges. Psychophysiology. 1991;28(6):701–711. doi: 10.1111/j.1469-8986.1991.tb01017.x. [DOI] [PubMed] [Google Scholar]
- Martins IJ, Hone E, Foster JK, Sunram-Lea SI, Gnjec A, Fuller SJ, Martins RN. Apolipoprotein E, cholesterol metabolism, diabetes, and the convergence of risk factors for Alzheimer's disease and cardiovascular disease. Mol Psychiatry. 2006;11(8):721–736. doi: 10.1038/sj.mp.4001854. [DOI] [PubMed] [Google Scholar]
- Mazzeo RS, Tanaka H. Exercise prescription for the elderly: current recommendations. Sports Med. 2001;31(11):809–818. doi: 10.2165/00007256-200131110-00003. [DOI] [PubMed] [Google Scholar]
- McDonald C, McEvoy L, Gharapetian L, Fennema-Notestine C, Hagler D, Holland D, Dale A. Regional rates of neocortical atrophy from normal aging to early Alzheimer disease. Neurology. 2009;73(6):457–465. doi: 10.1212/WNL.0b013e3181b16431. [DOI] [PMC free article] [PubMed] [Google Scholar]
- McDonald CR, Gharapetian L, McEvoy LK, Fennema-Notestine C, Hagler DJ, Jr., Holland D, Alzheimer's Disease Neuroimaging, I. Relationship between regional atrophy rates and cognitive decline in mild cognitive impairment. Neurobiol Aging. 2012;33(2):242–253. doi: 10.1016/j.neurobiolaging.2010.03.015. [DOI] [PMC free article] [PubMed] [Google Scholar]
- McEvoy LK, Fennema-Notestine C, Roddey JC, Hagler DJ, Jr., Holland D, Karow DS, Alzheimer's Disease Neuroimaging, I. Alzheimer disease: quantitative structural neuroimaging for detection and prediction of clinical and structural changes in mild cognitive impairment. Radiology. 2009;251(1):195–205. doi: 10.1148/radiol.2511080924. [DOI] [PMC free article] [PubMed] [Google Scholar]
- McSweeny JA, Naughle RI, Chelune GJ, Lüders H. “T scores for change”: An illustration of a regression approach to depicting change in clinical neuropsychology. The Clinical Neuropsychologist. 1993;7(3):300–312. [Google Scholar]
- Middleton LE, Corbett D, Brooks D, Sage MD, Macintosh BJ, McIlroy WE, Black SE. Physical activity in the prevention of ischemic stroke and improvement of outcomes: a narrative review. Neurosci Biobehav Rev. 2013;37(2):133–137. doi: 10.1016/j.neubiorev.2012.11.011. [DOI] [PubMed] [Google Scholar]
- Misra C, Fan Y, Davatzikos C. Baseline and longitudinal patterns of brain atrophy in MCI patients, and their use in prediction of short-term conversion to AD: results from ADNI. Neuroimage. 2009;44(4):1415–1422. doi: 10.1016/j.neuroimage.2008.10.031. [DOI] [PMC free article] [PubMed] [Google Scholar]
- Pereira AC, Huddleston DE, Brickman AM, Sosunov AA, Hen R, McKhann GM, Small SA. An in vivo correlate of exercise-induced neurogenesis in the adult dentate gyrus. Proceedings of the National Academy of Science U.S.A. 2007;104(13):5638–5643. doi: 10.1073/pnas.0611721104. [DOI] [PMC free article] [PubMed] [Google Scholar]
- Petersen RC. Mild cognitive impairment: transition between aging and Alzheimer's disease. Neurologia. 2000;15(3):93–101. [PubMed] [Google Scholar]
- Petersen RC, Stevens JC, Ganguli M, Tangalos EG, Cummings JL, DeKosky ST. Practice parameter: early detection of dementia: mild cognitive impairment (an evidence-based review) Report of the Quality Standards Subcommittee of the American Academy of Neurology. Neurology. 2001;56(9):1133–1142. doi: 10.1212/wnl.56.9.1133. [DOI] [PubMed] [Google Scholar]
- Reuter M, Rosas HD, Fischl B. Highly accurate inverse consistent registration: a robust approach. Neuroimage. 2010;53(4):1181–1196. doi: 10.1016/j.neuroimage.2010.07.020. [DOI] [PMC free article] [PubMed] [Google Scholar]
- Reuter M, Schmansky NJ, Rosas HD, Fischl B. Within-subject template estimation for unbiased longitudinal image analysis. Neuroimage. 2012;61(4):1402–1418. doi: 10.1016/j.neuroimage.2012.02.084. [DOI] [PMC free article] [PubMed] [Google Scholar]
- Rey A. L’examen clinique en psychologie [Clinical psychological examination] Presses Universitaires de France; Paris: 1964. [Google Scholar]
- Ruscheweyh R, Willemer C, Kruger K, Duning T, Warnecke T, Sommer J, Floel A. Physical activity and memory functions: an interventional study. Neurobiol Aging. 2011;32(7):1304–1319. doi: 10.1016/j.neurobiolaging.2009.08.001. [DOI] [PubMed] [Google Scholar]
- Smith A. Symbol Digit Modality Test (SDMT) Western Psychological Services; Los Angeles: 1991. [Google Scholar]
- Smith JC, Nielson KA, Antuono P, Lyons JA, Hanson RJ, Butts AM, Verber MD. Semantic Memory Functional MRI and Cognitive Function after Exercise Intervention in Mild Cognitive Impairment. Journal of Alzheimers Disease. 2013;37(1):197–215. doi: 10.3233/Jad-130467. [DOI] [PMC free article] [PubMed] [Google Scholar]
- Smith JC, Nielson KA, Woodard JL, Seidenberg M, Durgerian S, Hazlett KE, Matthews MA. Physical activity reduces hippocampal atrophy in elders at genetic risk for Alzheimer's disease. Front Aging Neurosci. 2014;6 doi: 10.3389/fnagi.2014.00061. [DOI] [PMC free article] [PubMed] [Google Scholar]
- Sperling RA, Laviolette PS, O'Keefe K, O'Brien J, Rentz DM, Pihlajamaki M, Johnson KA. Amyloid deposition is associated with impaired default network function in older persons without dementia. Neuron. 2009;63(2):178–188. doi: 10.1016/j.neuron.2009.07.003. [DOI] [PMC free article] [PubMed] [Google Scholar]
- Swain RA, Harris AB, Wiener EC, Dutka MV, Morris HD, Theien BE, Greenough WT. Prolonged exercise induces angiogenesis and increases cerebral blood volume in primary motor cortex of the rat. Neuroscience. 2003;117(4):1037–1046. doi: 10.1016/s0306-4522(02)00664-4. [DOI] [PubMed] [Google Scholar]
- Temkin NR, Heaton RK, Grant I, Dikmen SS. Detecting significant change in neuropsychological test performance: A comparison of four models. Journal of International Neuropsychological Society. 1999;5:357–369. doi: 10.1017/s1355617799544068. [DOI] [PubMed] [Google Scholar]
- ten Brinke LF, Bolandzadeh N, Nagamatsu LS, Hsu CL, Davis JC, Miran-Khan K, Liu-Ambrose T. Aerobic exercise increases hippocampal volume in older women with probable mild cognitive impairment: a 6-month randomised controlled trial. Br J Sports Med. 2015;49(4):248–254. doi: 10.1136/bjsports-2013-093184. [DOI] [PMC free article] [PubMed] [Google Scholar]
- van Praag H, Kempermann G, Gage FH. Running increases cell proliferation and neurogenesis in the adult mouse dentate gyrus. Nat Neurosci. 1999;2(3):266–270. doi: 10.1038/6368. [DOI] [PubMed] [Google Scholar]
- Voloboueva LA, Giffard RG. Inflammation, mitochondria, and the inhibition of adult neurogenesis. J Neurosci Res. 2011;89(12):1989–1996. doi: 10.1002/jnr.22768. [DOI] [PMC free article] [PubMed] [Google Scholar]
- Voss MW, Erickson KI, Prakash RS, Chaddock L, Kim JS, Alves H, Kramer AF. Neurobiological markers of exercise-related brain plasticity in older adults. Brain Behav Immun. 2013;28:90–99. doi: 10.1016/j.bbi.2012.10.021. [DOI] [PMC free article] [PubMed] [Google Scholar]
- Wechsler D. Wechsler Adult Intelligence Scale (WAIS-IIIuk): Wechsler Memory Scale (WMS-IIIuk) Psychological Corporation; 1997. [Google Scholar]
- Whitwell JL, Przybelski SA, Weigand SD, Knopman DS, Boeve BF, Petersen RC, Jack CR., Jr. 3D maps from multiple MRI illustrate changing atrophy patterns as subjects progress from mild cognitive impairment to Alzheimer's disease. Brain. 2007;130(Pt 7):1777–1786. doi: 10.1093/brain/awm112. [DOI] [PMC free article] [PubMed] [Google Scholar]
- Xie C, Bai F, Yu H, Shi Y, Yuan Y, Chen G, Li SJ. Abnormal insula functional network is associated with episodic memory decline in amnestic mild cognitive impairment. Neuroimage. 2012;63(1):320–327. doi: 10.1016/j.neuroimage.2012.06.062. [DOI] [PMC free article] [PubMed] [Google Scholar]
- Yao Z, Hu B, Liang C, Zhao L, Jackson M, Alzheimer's Disease Neuroimaging, I. A longitudinal study of atrophy in amnestic mild cognitive impairment and normal aging revealed by cortical thickness. PLoS One. 2012;7(11):e48973. doi: 10.1371/journal.pone.0048973. [DOI] [PMC free article] [PubMed] [Google Scholar]