

Abstract
Background:
There is strong evidence that breast cancer risk is influenced by environmental factors. Blood lipid and lipoprotein levels are also influenced by environmental factors and are associated with some breast cancer risk factors. We examined whether serial measures of serum lipids and lipoproteins were associated with breast cancer risk.
Methods:
We carried out a nested case-control study within a randomized long-term dietary intervention trial with 4690 women with extensive mammographic density followed for an average of 10 years for breast cancer incidence. We measured lipids in an average of 4.2 blood samples for 279 invasive breast cancer case subjects and 558 matched control subjects. We calculated subaverages of lipids for each subject based on menopausal status and use of hormone replacement therapy (HRT) at blood collection and analyzed their association with breast cancer using generalized estimating equations. All statistical tests were two-sided.
Results:
High-density lipoprotein-cholesterol (HDL-C) (P = .05) and apoA1 (P = .02) levels were positively associated with breast cancer risk (75th vs 25th percentile: HDL-C, 23% higher; apoA1, 28% higher) and non-HDL-C (P = .03) and apoB (P = .01) levels were negatively associated (75th vs 25th percentile: non-HDL-C, 19% lower; apoB, 22% lower). These associations were observed only when lipids were measured when HRT was not used. Total cholesterol and triglyceride levels were not statistically significantly associated with breast cancer risk.
Conclusions:
These results demonstrate that serum lipids are associated with breast cancer risk in women with extensive mammographic density. The possibility that interventions for heart disease prevention, which aim to reduce non-HDL-C or raise HDL-C, may have effects on breast cancer risk merits examination.
The incidence of breast cancer varies widely between countries and is about four times higher in Western countries than in Asia (1), largely because of an excess of hormone receptor–positive tumors occurring after age 50 years (2). Migrants from Asia to the West eventually acquire the breast cancer incidence of the country to which they have moved (3–5). These data provide evidence that the incidence of breast cancer is influenced by environmental factors. The strong correlation between international breast cancer incidence rates and estimates of nutrient intakes (6) suggest that differences in diet may account for differences in incidence.
Plasma lipids and lipoproteins are influenced by environmental factors, including weight and diet, and have associations with breast cancer risk factors that suggest that lipids may be relevant to breast cancer risk. We have previously shown that extensive mammographic density, a strong risk factor for breast cancer (7), is associated with higher levels of high-density lipoprotein-cholesterol (HDL-C) and lower levels of low-density lipoprotein-cholesterol (LDL-C) (8), and that HDL-C levels are influenced by several other breast cancer risk factors (9).
Previous studies of lipids and lipoproteins in relation to breast cancer risk have given conflicting results; however, almost all of these studies were based on measurements made in a single blood sample. In this study, we measured blood lipids at multiple time points in the years preceding the diagnosis of breast cancer, and accounted for menopausal status and hormone replacement therapy (HRT) at the time of blood collection. This study design is expected to reduce measurement error and generate more precise estimates of the effects of blood lipids on breast cancer risk than has been possible to date.
Methods
Source of Subjects
This case-control study was nested within the cohort of the Canadian Diet and Breast Cancer Prevention Study, a multicenter randomized controlled trial that tested whether a reduction in dietary fat intake would reduce the incidence of breast cancer in women at increased risk of for the disease (10). We recruited 4690 women with extensive mammographic density and followed them for an average of 10 years (minimum of seven years). Data on risk factors and anthropometric measures were collected at baseline and annually thereafter by personal interview. At the end of active follow-up in 2005, 220 cases of invasive breast cancer had been identified, and an additional 63 cases (diagnosed by the end of 2009) were identified by record linkage with provincial cancer registries. Of the total of 283 cases, 279 had at least one prediagnosis blood sample and were included in this study.
Case subjects were individually matched to two control subjects (women who did not develop breast cancer) according to age (within one year), date of random assignment (within one year), study center, and duration of follow-up (within six months). All P values are for two-sided statistical tests.
Blood Samples
Subjects provided a nonfasting blood sample at baseline and annually thereafter. Lipids were measured in a maximum of six prediagnosis blood samples selected in the following order of priority: at baseline, the last sample before breast cancer diagnosis, at two years after baseline, the second-to-last sample before diagnosis, and up to two additional samples approximately evenly spaced between the two-year and the second-to-last sample. On average, measurements were performed in 4.2 samples per subject. The last sample was collected on average 2.0 years (SD 2.8) before breast cancer diagnosis.
For control subjects, blood samples collected at time points as close as possible to those for their respective case subjects were selected. Written informed consent to use blood for potential breast cancer biomarkers was obtained from subjects at entry to the trial. The trial protocol was approved by the research ethics board of the University Health Network, Cancer Care Ontario, University of British Columbia, McMaster University, and University of Western Ontario.
Lipid Assays
Blood samples from case subjects (n = 279) and their matched control subjects (n = 558) were analyzed in the same batches but in random order. Lipids assays were performed at the Lipid Research Laboratory at St Michael’s Hospital, Toronto, Canada, and included total cholesterol (TC), HDL-C, triglyceride (TG), and apolipoproteins A1 and B (apoA1 and apoB). Non-HDL-C was calculated as TC minus HDL-C. Serum lipid measures were standardized with the Centers for Disease Control (CDC, Atlanta, GA) Lipid Standardization Program. HDL-C was measured by a direct homogeneous assay reagent HDLC3 on the Roche Cobas 6000 c501 System (Roche Diagnostics, Indianapolis, IN). ApoA1 and apoB were measured by nephelometry using the BN Prospec (Siemens, Mississauga, ON).
Statistical Analysis
There was no statistically significant effect of the dietary intervention on breast cancer incidence in the trial (10); therefore, the low-fat dietary intervention and comparison groups were combined for the main analysis. Baseline characteristics of case and control subjects were compared using two-sample t tests for continuous variables and chi-square tests for categorical variables.
For each lipid, we examined the association of the baseline measure and the overall average of all measures per subject with breast cancer risk using conditional logistic regression. Models were adjusted for date of random assignment, diet study group, baseline or average weight, and baseline breast cancer risk factors, including baseline HRT use and menopausal status.
Since HRT use and menopausal status changed over time for some subjects, and these variables were associated with lipid levels (see Supplementary Figure 1, available online), it is unlikely that adjustment for HRT and menopausal status at baseline only would be optimal when examining the overall average of all measures per subject. Therefore, we used time-varying variables for HRT/menopausal status and the lipid measurements. HRT/menopausal status at the time of blood collection was coded as one categorical variable with three levels (1 = premenopausal no HRT, 2 = postmenopausal no HRT, and 3 = postmenopausal with HRT). We then calculated subaverages of the lipid measurements for each subject that corresponded to each category of the HRT/menopausal variable. Figure 1 shows examples of how the lipid subaverages would be calculated for subjects with six measurements. Sixty percent of subjects had one subaverage (all samples in one category), 33% had two subaverages, and 7% had three subaverages. Women were considered premenopausal at blood collection if they had had a menstrual period within the previous 12 months or had had a hysterectomy with only one ovary removed and were younger than 50 years. Women were classified as postmenopausal if they had at least 12 months of amenorrhea, had an oophorectomy, were older than 50 years and had a hysterectomy, or were taking HRT.
Figure 1.
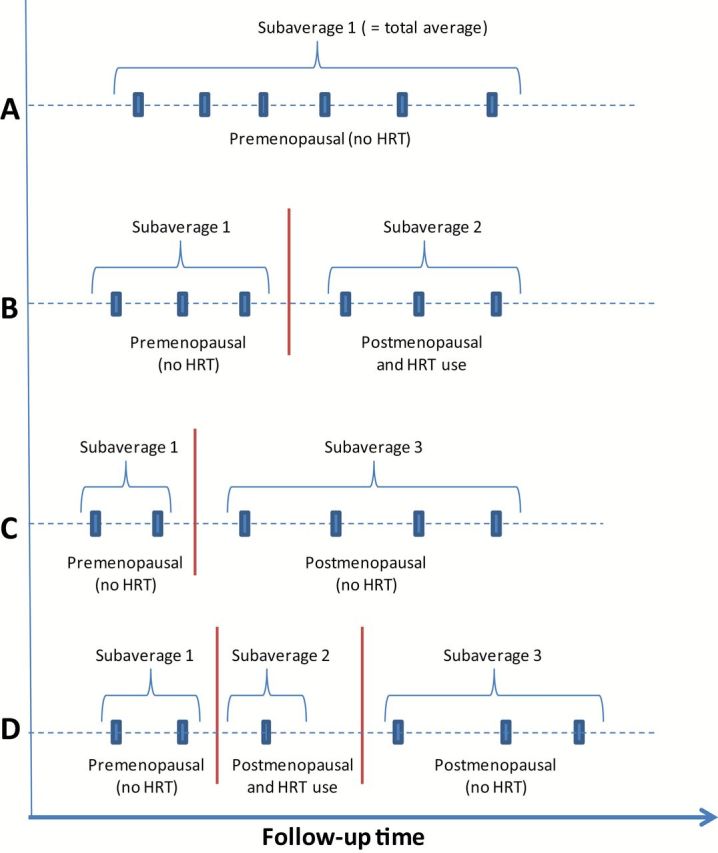
Examples of calculation of lipid subaverages. A maximum of three subaverages of serum lipid measurements were calculated for each subject depending on menopausal status and hormone replacement therapy (HRT) use at the time of blood collection: 1) premenopausal (no HRT), 2) postmenopausal and taking HRT, and 3) postmenopausal and not taking HRT. The figure shows examples of how the lipid subaverages would be calculated for subjects with measurements at six time points: (A) premenopausal, no HRT, (B) premenopausal, no HRT and postmenopausal, HRT, (C) premenopausal, no HRT and postmenopausal, no HRT, (D) premenopausal, no HRT, postmenopausal, HRT, and postmenopausal, no HRT. Sixty percent of subjects had only one subaverage (all of their samples in one category), 33% had two subaverages, and 7% had three subaverages. HRT = hormone replacement therapy.
For the primary analysis, we assessed the association of lipid subaverages with breast cancer risk using generalized estimating equations (GEE) (using an independent correlation matrix) to account for multiple observations per subject. Case-control status was the outcome variable, and serum lipid level (subaverage) and HRT/menopausal status were time-varying independent variables. Case subjects and control subjects were not matched on menopausal status or HRT use (used in determining the subaverages); therefore, we used unmatched analysis. Results were adjusted for breast cancer risk factors at baseline, date of random assignment, study group, and subaverages of age and weight calculated in the same manner as lipids. Interaction terms were tested for diet study group, body mass index (BMI), and HRT use. The fit of alternative GEE models was compared using the Quasi-likelihood under the Independence Model Criterion (QIC) statistic (11;12), where models with smaller QIC statistics are preferred.
We also performed a stratified analysis based on the categories of premenopausal, postmenopausal (no HRT), and postmenopausal (taking HRT) using unconditional logistic regression.
To express the results as odds ratios in the figures, we determined the interquartile range for each lipid based on all subaverages for all subjects and then calculated the odds ratio corresponding to that difference using the beta estimate for each lipid. All statistical tests were two-sided.
The main objective of our analysis was to identify which serum lipids and lipoproteins are associated with breast cancer risk; therefore, we did not correct the estimates for attenuation because of measurement error. Our simpler analysis produces in general asymptotically valid P values (13).
Results
Characteristics of Subjects
Table 1 shows selected characteristics of case subjects and control subjects. Similar proportions of subjects (50%) were in the comparison and dietary intervention arms of the trial. On average, breast cancer case subjects weighed more than control subjects (63.3 vs 62.0kg, P = .03) and had a higher BMI (23.6 vs 23.2, P = .03). Case subjects had a higher frequency of family history of breast cancer, an earlier age at menarche, and later age at first child, but the differences were not statistically significant. There were no statistically significant differences between case subjects and control subjects in the baseline values of serum lipids or lipoproteins. The average time between baseline and breast cancer diagnosis was 7.9 years (4.7 SD).
Table 1.
Selected demographic characteristics and serum lipid variables at baseline*
| Characteristic | Mean (SD) or % | P | |
|---|---|---|---|
| Case subjects (n = 279) | Control subjects (n = 558) | ||
| Group† | |||
| Intervention | 50.5 | 49.8 | .84 |
| Comparison | 49.5 | 50.2 | |
| Age, y | 48.4 (6.4) | 48.5 (6.4) | .94 |
| Weight, kg | 63.3 (8.8) | 62.0 (7.7) | .03 |
| Height, cm | 163.5 (6.4) | 163.2 (6.2) | .55 |
| Body mass index, kg/m2 | 23.6 (2.7) | 23.2 (2.4) | .03 |
| Smoked ever, % yes | 50.5 | 48.4 | .56 |
| Age at menarche, y | 12.8 (1.3) | 13.0 (1.4) | .07 |
| Parous, % yes | 68.5 | 69.9 | .67 |
| Age at birth of first child‡, y (n = 191, 389) | 26.2 (5.1) | 25.4 (4.8) | .10 |
| Number of live births‡ (n = 191, 390) | 2.18 (0.84) | 2.24 (0.84) | .41 |
| Postmenopausal, % yes | 30.5 | 33.0 | .46 |
| HRT used, % yes | 26.9 | 22.0 | .12 |
| Family history of breast cancer§, % yes | 21.9 | 17.2 | .10 |
| Total cholesterol, mmol/L | 5.04 (0.89) | 5.11 (0.91) | .30 |
| HDL-C, mmol/L | 1.42 (0.40) | 1.42 (0.39) | .95 |
| ApoA1, g/L | 1.73 (0.28) | 1.71 (0.26) | .36 |
| HDL-C/ApoA1 ratio | 0.818 (0.180) | 0.825 (0.165) | .60 |
| Non-HDL-C‖, mmol/L | 3.62 (0.97) | 3.69 (0.97) | .35 |
| ApoB, g/L | 0.835 (0.203) | 0.857 (0.218) | .17 |
| non-HDL-C/ApoB ratio | 4.33 (0.39) | 4.32 (0.48) | .68 |
| Triglyceride, mmol/L | 1.35 (0.77) | 1.34 (0.67) | .85 |
* ApoA1 = apolipoprotein A1; ApoB = apolipoprotein B; HDL-C = high density lipoprotein cholesterol; HRT = hormone replacement therapy.
† Randomization group.
‡ Among parous.
§ At least one first-degree relative diagnosed with breast cancer.
‖ Calculated as the difference between total cholesterol and HDL-C.
Serum Lipids, Lipoproteins, and Breast Cancer Risk
Table 2 shows the association between lipid variables (baseline, overall average, and subaverages) and breast cancer risk. There were no statistically significant associations of baseline lipid measures with breast cancer risk, although the inverse association with apoB was of borderline statistical significance (P = .06). When the overall average lipid values were examined, the beta estimates for all lipids increased compared with baseline, but the effect was greatest for HDL-C and TG (about a two-fold increase). The inverse association with apoB became statistically significant (P = .03). However, the precision of the beta estimates for the overall average of lipids was not improved compared with the single measure at baseline (ie, standard error of the beta estimates was not reduced). Compared with the overall average of lipid values, the subaverage results, which took advantage of multiple measures per subject but also controlled for HRT use and menopausal status at the time of blood collection, showed larger beta estimates for several lipids, and again the effect was greatest for HDL-C and TG (about a two-fold increase). In addition, the standard errors of the beta estimates were slightly reduced. The results of the subaverage analysis are further described below and in Figure 2, which shows the odds ratios for a difference equal to the interquartile range (calculated using subaverages for all subjects) for selected lipid variables.
Table 2.
Serum lipids (baseline, overall averages and subaverages) and risk of breast cancer*
| Lipid | Baseline† All subjects (279 case subjects, 558 control subjects) |
Overall averages‡ All subjects (279 case subjects, 558 control subjects) |
Subaverages§ All subjects (279 case subjects, 558 control subjects) |
||||||
|---|---|---|---|---|---|---|---|---|---|
| Beta | SE | P | Beta | SE | P | Beta | SE | P | |
| Total cholesterol, mmol/L | -0.1291 | 0.0910 | .16 | -0.1334 | 0.1008 | .19 | -0.1290 | 0.0948 | .17 |
| HDL-C, mmol/L | 0.1073 | 0.2333 | .65 | 0.2356 | 0.2323 | .31 | 0.4074 | 0.2048 | .05 |
| Apo A1, g/L | 0.4170 | 0.3285 | .20 | 0.5428 | 0.3317 | .10 | 0.7136 | 0.3181 | .02 |
| HDL-C / Apo A1 ratio | -0.0637 | 0.5889 | .91 | 0.2687 | 0.6583 | .68 | 0.8283 | 0.5308 | .12 |
| Non-HDL-C, mmol/L | -0.1277 | 0.0855 | .14 | -0.1520 | 0.0938 | .11 | -0.1919 | 0.0874 | .03 |
| Apo B, g/L | -0.7240 | 0.3812 | .06 | -0.8987 | 0.4032 | .03 | -1.0099 | 0.384 | .01 |
| Non-HDL-C / Apo B ratio | -0.0775 | 0.1902 | .68 | 0.3887 | 0.2455 | .11 | 0.1730 | 0.2188 | .43 |
| Triglyceride, mmol/L | -0.0426 | 0.1156 | .71 | -0.0743 | 0.1267 | .56 | -0.1779 | 0.1114 | .11 |
* ApoA1 = apolipoprotein A1; ApoB = apolipoprotein B; HDL-C = high density lipoprotein cholesterol; HRT = hormone replacement therapy.
† Conditional logistic regression, adjusted for randomization group (intervention, comparison), parity at baseline (parous, nonparous), if smoked ever at baseline (yes, no), if had first-degree relatives with breast cancer at baseline (yes, no), study site (Toronto, London, Hamilton, Windsor, Vancouver, Surrey), age at menarche (years), age at birth of first child (years), number of live births, baseline menopausal status and hormone replacement use, baseline weight (kg). All statistical tests were two-sided.
‡ Conditional logistic regression, adjusted for same factors as in (†), except average weight was used instead of baseline weight.
§ Generalized estimating equations, adjusted for randomization group (intervention, control), parity at baseline (parous, nonparous), if smoked ever at baseline (yes, no), if had first-degree relatives with breast cancer at baseline (yes, no), study site (Toronto, London, Hamilton, Windsor, Vancouver, Surrey), age at menarche (years), age at birth of first child (years), number of live births, subaverage weight (kg), subaverage age (years), date of random assignment and menopausal status and HRT use (three categories). All statistical tests were two-sided.
Figure 2.

Serum lipids (subaverages) and risk of breast cancer: interquartile odds ratio (95% confidence interval). Results are adjusted for study group (low-fat dietary intervention or comparison), parity at baseline (parous, nonparous), if smoked ever at baseline (yes, no), if had first degree relatives with breast cancer at baseline (yes, no), study site (Toronto, London, Hamilton, Windsor, Vancouver, Surrey), age at menarche (years), age at birth of first child (years), number of live births, average weight (kg), average age (years), date of random assignment, and menopausal status and homone replacement therapy use (three categories). Data missing for estrogen receptor status for 13 subjects. The interquartile range for each lipid was determined based on all subaverages for all subjects, and then the odds ratios calculated corresponding to that difference using the beta estimate for each lipid. All statistical tests were two-sided. ApoA1 = apolipoprotein A1; ApoB = apolipoprotein B; HDL-C = high density lipoprotein cholesterol; HRT = hormone replacement therapy.
The subaverages of HDL-C (P = .05) and apoA1 (P = .02) were both statistically significantly and positively associated with risk of all breast cancer (Table 2). HDL-C values at the 75th percentile were associated with a 23% (95% confidence interval [CI] = 1 to 51) higher risk of breast cancer compared with values at the 25th percentile (Figure 2). ApoA1 levels at the 75th percentile were associated with a 28% (95% CI = 3 to 60) higher risk of breast cancer compared with values at the 25th percentile.
The subaverages of non-HDL-C (P = .03) and apoB (P = .01) were both statistically significantly and negatively associated with risk of all breast cancer (Table 2). Non-HDL-C values at the 75th percentile were associated with a 19% (95% CI = 2 to 34) lower risk of breast cancer compared with values at the 25th percentile (Figure 2). ApoB values at the 75th percentile were associated with a 22% (95% CI = 6 to 36) lower risk of breast cancer compared with values at the 25th percentile. Total cholesterol and triglyceride values, and the ratios of HDL-C to apoA1 and non-HDL-C to apoB, were not statistically significantly associated with overall breast cancer risk (Table 2).
There were no statistically significant interactions between lipids and BMI (P ≥ .45). The results stratified by diet study group are shown in Table 3. Overall, the associations tended to be stronger in the comparison group compared with the low-fat dietary intervention group, but the interaction terms were not statistically significant (P = .09 for TG and P > .25 for HDL-C, non-HDL-C, ApoA1, and ApoB).
Table 3.
Lipids and risk of breast cancer: GEE analysis stratified by diet study group*
| Lipid | All subjects† (279 case subjects, 558 control subjects) | Intervention group§ (141 case subjects, 278 control subjects) |
Comparison group§ (138 case subjects, 280 control subjects) |
|||||||
|---|---|---|---|---|---|---|---|---|---|---|
| Beta | SE | P | Group interaction P‡ |
Beta | SE | P | Beta | SE | P | |
| Total cholesterol, mmol/L | -0.1290 | 0.0948 | .17 | .54 | -0.0911 | 0.1325 | .49 | -0.1711 | 0.1400 | .22 |
| HDL-C, mmol/L | 0.4074 | 0.2048 | .05 | .35 | 0.4030 | 0.2956 | .17 | 0.4866 | 0.2904 | .09 |
| Apo A1, g/L | 0.7136 | 0.3181 | .02 | .71 | 0.7350 | 0.4644 | .11 | 0.7429 | 0.4415 | .09 |
| HDL-C / Apo A1ratio | 0.8283 | 0.5308 | .12 | .11 | 0.5391 | 0.7429 | .47 | 1.3489 | 0.7842 | .09 |
| Non-HDL-C, mmol/L | -0.1919 | 0.0874 | .03 | .25 | -0.1472 | 0.1222 | .23 | -0.2598 | 0.1292 | .04 |
| Apo B, g/L | -1.0099 | 0.384 | .01 | .35 | -0.8391 | 0.5284 | .11 | -1.2657 | 0.5650 | .03 |
| Non-HDL-C / Apo B ratio | 0.1730 | 0.2188 | .43 | .30 | 0.3285 | 0.3140 | .30 | 0.0415 | 0.2946 | .89 |
| Triglyceride, mmol/L | -0.1779 | 0.1114 | .11 | .09 | -0.0406 | 0.1663 | .81 | -0.3304 | 0.1723 | .06 |
* ApoA1 = apolipoprotein A1; ApoB = apolipoprotein B; GEE = generalized estimating equation; HDL-C = high density lipoprotein cholesterol; HRT = hormone replacement therapy.
† Adjusted for diet study group (intervention, comparison), parity at baseline (parous, nonparous), if smoked ever at baseline (yes, no), if had first-degree relatives with breast cancer at baseline (yes, no), study site (Toronto, London, Hamilton, Windsor, Vancouver, Surrey), age at menarche (years), age at birth of first child (years), number of live births, subaverage weight (kg), subaverage age (years), date of randomization, and menopausal status and HRT use (three categories).
‡ P value for diet study group x lipid interaction term in GEE model.
§ Adjusted as in (†), except for diet study group.
ApoB showed the most statistically significant association with breast cancer risk (P = .01), and the model with apoB had the lowest QIC (1580.5) among the single lipid models. The model QIC reduced to 1758.1 when apoA1 was added to the model. Although the beta estimates for both apoA1 and B were reduced slightly compared with their single lipid models, these apoproteins appeared to be independently associated with breast cancer risk (P = .07 for apoA1 and P = .02 for apoB) (data not shown).
A small number of patients (4%, 11 case subjects and 24 control subjects) reported taking LDL-lowering statin drugs at some point during the study period. Adjusting for statin use (ever/never) in the main analysis (GEE model) had virtually no effect on the results, and statin use was not associated with breast cancer risk (P ≈ .75) (data not shown).
Analysis according to estrogen receptor status of breast cancer (Figure 2) showed that the associations observed for all invasive cancers were in general similar in direction and magnitude in women with estrogen receptor–positive tumors, although statistical significance was lost for apoA1 in the smaller number of subjects (n = 210 case subjects, 420 control subjects). An inverse association with triglyceride levels (P = .04) and a positive association with the ratio of HDL-C to apoA1, with risk of estrogen receptor–positive tumors, was observed (P = .05) (data not shown). There were no statistically significant associations seen in women with estrogen receptor–negative breast cancer, although there were few patients in this group (n = 56 case subjects, 112 control subjects).
To better understand the effect of HRT and menopausal status on the results, we stratified the analysis of the associations between selected lipid variables and breast cancer risk by menopausal status and HRT use at time of blood collection (Figure 3). The results using samples collected when women were not using HRT (pre- and postmenopausal women) were in general similar to those seen using all samples (Table 2 and Figure 2), although the magnitude of the associations was greater in the stratified analysis. No statistically significant associations between lipid measures and breast cancer risk were seen when lipids were measured when HRT was used. The interaction term for lipid variable with HRT use (yes/no) was statistically significant for HDL-C (P = .04), of borderline significance for non-HDL-C and TG (P = .06 and .11, respectively), but not significant for ApoA1 (P = .24) and ApoB (P = .19).
Figure 3.

Serum lipids (subaverages) and risk of breast cancer stratified by menopausal status and hormone replacement therapy use: interquartile odds ratio (95% confidence interval). Results are adjusted for study group (low-fat dietary intervention or comparison), parity at baseline (parous, nonparous), if smoked ever at baseline (yes, no), if had first degree relatives with breast cancer at baseline (yes, no), study site (Toronto, London, Hamilton, Windsor, Vancouver, Surrey), age at menarche (years), age at birth of first child (years), number of live births, average weight (kg), average age (years), and date of random assignment. The interquartile range for each lipid was determined based on all subaverages for all subjects, and then the odds ratios calculated corresponding to that difference using the beta estimate for each lipid. All statistical tests were two-sided. ApoA1 = apolipoprotein A1; ApoB = apolipoprotein B; HDL-C = high density lipoprotein cholesterol; HRT = hormone replacement therapy.
As a sensitivity analysis, we stratified the analysis of baseline data by the three-level HRT/menopausal status variable (data not shown). The results for the premenopausal no-HRT category (n = 186 case subjects) were qualitatively similar to those from the stratified subaverage analysis of the same group (n = 188 case subjects) (Figure 2), but the baseline effect sizes were 15% to 30% smaller and none of the associations were statistically significant. There were no statistically significant associations for baseline lipid levels in the postmenopausal HRT group (n = 67 case subjects), and the sample size of 18 case subjects for postmenopausal no-HRT was considered too small for reliable results.
Discussion
In a large cohort of women with extensive mammographic density, we observed that higher levels of serum HDL-C and apoA1 and lower levels of non-HDL-C and apoB were associated with a 20% to 30% higher risk of developing estrogen receptor–positive breast cancer, when comparing lipid values across the interquartile range. These associations may appear modest, but their magnitude is in the same range as many accepted breast cancer risk factors, such as age at menarche, parity, and postmenopausal obesity (14), and the lipid associations are independent of these factors. These associations were absent when HRT was used, which suggests that further evaluation of serum lipoprotein/apolipoprotein levels in relation to risk of breast cancer should exclude women taking HRT.
Although some case-control studies have reported a positive association between HDL-C and breast cancer risk (15), prospective studies have reported either no association (16–18) or an inverse association (19–22) with breast cancer risk. Some studies examined the associations of HDL-C by menopausal status, but the results are also inconsistent (17,20,21). Two studies examined LDL-C (similar to non-HDL-C) and reported no association with breast cancer risk (16,22). Only one other prospective study has examined the relationship of apoA1 and apoB with breast cancer risk and found no association (16). Almost all studies of the association of blood lipids with breast cancer risk in the literature have used a single baseline measure of lipids and covariables. These results are consistent with our results using baseline measures only, which showed no statistically significant associations of serum lipids with breast cancer risk.
To our knowledge, there is only one other study that examined the association of serial lipid measures with breast cancer risk (18). No association between average measures of HDL-C and breast cancer risk was observed, but average TG levels were positively associated with breast cancer risk. However, the study included postmenopausal women only, had a small sample size, and adjusted only for ever/never use of HRT at baseline.
In our study, the associations of lipids with breast cancer were larger when we examined the overall average of lipid measures from multiple blood samples compared with baseline. When we accounted for menopausal status and HRT use at the time of collection for each blood sample (using time dependent subaverages), the magnitude of the risk associations increased further and the associations with HDL-C, apoA1, and non-HDL-C levels became statistically significant. The change in risk estimates was larger for HDL-C and TG compared with other lipids, although the association with TG did not attain statistical significance (P = .11). Similarly, when we stratified the baseline lipid results by HRT/menopausal status, the associations of HDL-C and TG in the premenopausal no-HRT group increased compared with overall baseline more than those for other lipids. The reason for the larger effect for HDL-C and TG is not known, but the results suggest that the association of these lipids with breast cancer risk may be more sensitive to the effect of HRT (see below).
The mechanism for an association between blood lipids and breast cancer risk is unknown. The observed lipid profile (higher HDL-C and apoA1, and lower non-HDL-C and apoB) could reflect higher levels of, or greater response to, endogenous estrogens, which are associated with an increased risk of breast cancer, particularly estrogen receptor–positive disease (23). In premenopausal women, plasma HDL-C levels are higher (24) and/or LDL-C levels are lower (25,26) in the luteal phase (higher estrogen) compared with the follicular phase of the menstrual cycle; however, the associations are small and not consistent (27,28). In postmenopausal women not taking HRT, endogenous estrogen levels are positively associated with HDL-C levels and inversely associated with LDL-C levels in some (29,30) but not all studies (31,32).
Alcohol intake, which is associated with higher breast cancer risk (33), and higher blood estrogen (34) and HDL-C levels (35) might also be responsible for the associations seen between HDL-C and breast cancer in this study. However, the association of apoB with breast cancer risk, which was the most statistically significant association among the factors examined, is less likely to be explained by alcohol intake because, in contrast to HDL-C, apoB and LDL-C levels are not consistently associated with alcohol intake (36–39).
Lipoproteins may also have direct effects on breast cancer. For example, in vitro exposure to HDL increases proliferation and migration in some breast cancer cell lines (40), and it has recently been shown that these effects may result from cholesteryl ester uptake from HDL, as well as from the induction of signal transduction via the scavenger receptor B1 (SR-B1) (41).
In the analysis stratified by HRT and menopausal status, we did not see an association between lipids and breast cancer risk when HRT was used. Exogenous (oral) estrogen increases HDL-C and TG levels and reduces LDL-C levels (42); however, combined estrogen and progesterone replacement therapy, the type used by most women in this study, tends to have smaller effects on lipid levels (42,43). The metabolism of exogenous sex hormones, and their effects on lipid and lipoprotein metabolism, differs from that of endogenous hormones (43). The complex hormonal environment created by HRT may obscure the association of lipids with breast cancer that is seen when lipids are measured in women not taking HRT.
We examined women who are at increased risk of breast cancer because they have extensive mammographic density; therefore, our results may not be generalizable to other populations. We have previously reported that premenopausal women with high mammographic density had higher levels of serum HDL-C (8,44) and lower levels of LDL-C, triglyceride, and apoB (8) compared with those with little to no mammographic density. Women from families with familial breast cancer had lower total cholesterol, LDL-C, and apoB levels compared with those from families with sporadic breast cancer (45). Therefore, there may be differences in lipid metabolism in women at increased risk for breast cancer. Further studies are needed to determine whether the association between serum lipids and breast cancer risk varies according to mammographic density. An association of lipids and breast cancer risk that is limited to women with high mammographic density would still be an important finding, because mammographic density is common in the population and has a high attributable risk for breast cancer (7).
In addition to multiple blood samples and careful adjustment for menopausal status and HRT use, the strengths of our study include the prospective nested case-control design, complete documentation of invasive breast cancers, measurement of all lipids at a single laboratory, and the examination of tumor subtypes. A potential limitation of this study is that nonfasting blood samples were collected and we were not able to adjust for time of day or time since food consumption for blood collection. Nonfasting samples may have increased the variation in TG levels and reduced our ability to find a statistically significant association of TG levels with breast cancer risk. However, nonfasting status would have little effect on the other lipid measures, in particular apolipoproteins (46).
We examined the association of several lipid variables with breast cancer risk; however, we did not adjust for multiple comparisons because many of the lipid variables are strongly related to each other. For example, the apolipoproteins ApoA1 and B are highly correlated with their respective lipoprotein particles, HDL and LDL. The consistency of the associations seen for apoA1 and HDL-C, and for apoB and non-HDL-C, strengthens the results. In addition, apoA1 and B–containing lipoproteins tend to be negatively correlated, and as expected their associations with breast cancer risk are in opposite directions.
Several pharmacological and behavioral interventions for cardiovascular disease prevention aim to reduce apoB-containing particles (such as LDL-C) and increase apoA1 particles (such as HDL-C). Our results raise the possibility that these lipid changes may increase breast cancer risk in women at increased risk for the disease, but this potential effect requires further examination.
Body weight and some nutrients were associated with breast cancer risk in the trial cohort examined in this study (10). Because serum lipid levels are influenced by diet, alcohol intake, and body weight, further planned analyses will examine whether lipids mediate the effects of these factors on breast cancer risk. If serum lipids play a role in mediating breast cancer risk, they will have potential application in risk prediction, breast cancer prevention, and in the monitoring of preventive interventions.
Clinical Trial registration: Clinicaltrials.gov identifier: NCT00148057.
Funding
This work was supported by grants from the Ontario Ministry of Health, Medical Research Council of Canada, Canadian Breast Cancer Research Alliance, Canadian Institutes of Health (Grant # 191174), and in part by grants from the American Institute of Cancer Research and the National Institutes of Health (RO1 CA90579-01). Dr. Boyd was supported by the Lau Chair in Breast Cancer Research. Dr. Martin was supported by a Canadian Institutes for Health Research New Investigator Salary Award. This research was also funded in part by the Ontario Ministry of Health and Long Term Care.
Supplementary Material
The views expressed do not necessarily reflect those of the Ontario Ministry of Health and Long Term Care.
References
- 1. Muir C, Waterhouse T, Mack J, Powell S, Whelan S. Cancer Incidence in Five Continents. Volume V 1 ed IARC Scientific Publication; 1992. [Google Scholar]
- 2. Yasui Y, Potter JD. The shape of age-incidence curves of female breast cancer by hormone-receptor status. Cancer Causes Control. 1999;10(5):431–437. [DOI] [PubMed] [Google Scholar]
- 3. Ziegler RG, Hoover RN, Pike MC, et al. Migration patterns and breast cancer risk in Asian-American women. J Natl Cancer Inst. 1993;85(22):1819–1827. [DOI] [PubMed] [Google Scholar]
- 4. Stanford JL, Herrinton LJ, Schwartz SM, Weiss NS. Breast cancer incidence in Asian migrants to the United States and their descendants. Epidemiology. 1995;6(2):181–183. [DOI] [PubMed] [Google Scholar]
- 5. Pike MC, Kolonel LN, Henderson BE, et al. Breast cancer in a multiethnic cohort in Hawaii and Los Angeles: risk factor-adjusted incidence in Japanese equals and in Hawaiians exceeds that in Whites. Cancer Epidemiol Biomarkers Prev. 2002;11(9):795–800. [PubMed] [Google Scholar]
- 6. Armstrong B, Doll R. Environmental factors and cancer incidence and mortality in different countries, with special reference to dietary practices. Int J Cancer. 1975;15(4):617–631. [DOI] [PubMed] [Google Scholar]
- 7. Boyd NF, Guo H, Martin LJ, et al. . Mammographic density and the risk and detection of breast cancer. N Engl J Med. 2007;356(3):227–236. [DOI] [PubMed] [Google Scholar]
- 8. Boyd NF, Connelly P, Byng J, et al. . Plasma lipids, lipoproteins, and mammographic densities. Cancer Epidemiol Biomarkers Prev. 1995;4(7):727–733. [PubMed] [Google Scholar]
- 9. Boyd NF, McGuire V. Evidence of association between plasma high density lipoprotein cholesterol and risk factors for breast cancer. J Natl Cancer Inst. 1990;82(6):460–468. [DOI] [PubMed] [Google Scholar]
- 10. Martin LJ, Li Q, Melnichouk O, et al. . A randomized trial of dietary intervention for breast cancer prevention. Cancer Res. 2011;71(1):123–133. [DOI] [PubMed] [Google Scholar]
- 11. Pan W. Akaike’s Infrormation Criterion in generalized estimating equations. Biometrics. 2001;57(1):120–125. [DOI] [PubMed] [Google Scholar]
- 12. Hardin J, Hilbe J. Generalized Estimating Equations. London: Chapman and Hall/CRC; 2003. [Google Scholar]
- 13. Carroll RJ, Ruppert D, Stefanski LA. Measurement error in nonlinear models. First edition ed Chapman & Hall; 1995. [Google Scholar]
- 14. Key TJ, Verkasalo PK, Banks E. Epidemiology of breast cancer. Lancet Oncol. 2001;2(3):133–140. [DOI] [PubMed] [Google Scholar]
- 15. Ferraroni M, Gerber M, Decarli A, et al. . HDL-cholesterol and breast cancer: A joint study in Northern Italy and Southern France. Int J Epidemiol. 1993;22(5):772–780. [DOI] [PubMed] [Google Scholar]
- 16. Melvin JC, Seth D, Holmberg L, et al. . Lipid profiles and risk of breast and ovarian cancer in the Swedish AMORIS Study. Cancer Epidemiol Biomarkers Prev. 2012;21(8):1381–1384. [DOI] [PubMed] [Google Scholar]
- 17. Moorman PG, Hulka BS, Hiatt RA, et al. . Association between high-density lipoprotein cholesterol and breast cancer varies by menopausal status. Cancer Epidemiol Biomarkers Prev. 1998;7(6):483–488. [PubMed] [Google Scholar]
- 18. Kabat GC, Kim M, Chlebowski RT, et al. . A longitudinal study of the metabolic syndrome and risk of postmenopausal breast cancer. Cancer Epidemiol Biomarkers Prev. 2009;18(7):2046–2053. [DOI] [PMC free article] [PubMed] [Google Scholar]
- 19. Agnoli C, Berrino F, Abagnato CA, et al. . Metabolic syndrome and postmenopausal breast cancer in the ORDET cohort: A nested case-control study. Nutr Metab Cardiovasc Dis. 2010;20(0):41–48. [DOI] [PMC free article] [PubMed] [Google Scholar]
- 20. Kucharska-Newton AM, Rosamond WD, Mink PJ, Alberg AJ, Shahar E, Folsom AR. HDL-cholesterol and incidence of breast cancer in the ARIC cohort study. Ann Epidemiol. 2008;18(9):671–677. [DOI] [PMC free article] [PubMed] [Google Scholar]
- 21. Furberg AS, Veierod MB, Wilsgaard T, Bernstein L, Thune I. Serum high-density lipoprotein cholesterol, metabolic profile, and breast cancer risk. J Natl Cancer Inst. 2004;96(15):1152–1160. [DOI] [PubMed] [Google Scholar]
- 22. Hoyer AP, Engholm G. Serum lipids and breast cancer risk: a cohort study of 5,207 Danish women. Cancer Causes Control. 1992;3(5):403–408. [DOI] [PubMed] [Google Scholar]
- 23. Tamimi RM, Byrne C, Colditz GA, Hankinson SE. Endogenous hormone levels, mammographic density, and subsequent risk of breast cancer in postmenopausal women. J Natl Cancer Inst. 2007;99(15):1178–1187. [DOI] [PubMed] [Google Scholar]
- 24. Reed RG, Kris-Etherton P, Stewart PW, Pearson TA. Variation of lipids and lipoproteins in premenopausal women compared with men and postmenopausal women. DELTA (Dietary Effects on Lipoproteins and Thrombogenic Activity) Investigators. Metabolism. 2000;49(9):1101–1105. [DOI] [PubMed] [Google Scholar]
- 25. Barnett JB, Woods MN, Lamon-Fava S, et al. . Plasma lipid and lipoprotein levels during the follicular and luteal phases of the menstrual cycle. J Clin Endocrinol Metab. 2004;89(2):776–782. [DOI] [PubMed] [Google Scholar]
- 26. Mumford SL, Schisterman EF, Siega-Riz AM, et al. . A longitudinal study of serum lipoproteins in relation to endogenous reproductive hormones during the menstrual cycle: findings from the BioCycle study. J Clin Endocrinol Metab. 2010;95(9):E80–E85. [DOI] [PMC free article] [PubMed] [Google Scholar]
- 27. Elhadd TA, Neary R, Abdu TA, et al. . Influence of the hormonal changes during the normal menstrual cycle in healthy young women on soluble adhesion molecules, plasma homocysteine, free radical markers and lipoprotein fractions. Int Angiol. 2003;22(3):222–228. [PubMed] [Google Scholar]
- 28. Magkos F, Patterson BW, Mittendorfer B. No effect of menstrual cycle phase on basal very-low-density lipoprotein triglyceride and apolipoprotein B-100 kinetics. Am J Physiol Endocrinol Metab. 2006;291(6):E1243–E1249. [DOI] [PubMed] [Google Scholar]
- 29. Shelley JM, Green A, Smith AM, et al. . Relationship of endogenous sex hormones to lipids and blood pressure in mid-aged women. Ann Epidemiol. 1998;8(1):39–45. [DOI] [PubMed] [Google Scholar]
- 30. Derby CA, Crawford SL, Pasternak RC, Sowers M, Sternfeld B, Matthews KA. Lipid changes during the menopause transition in relation to age and weight: the Study of Women’s Health Across the Nation. Am J Epidemiol. 2009;169(11):1352–1361. [DOI] [PMC free article] [PubMed] [Google Scholar]
- 31. Worsley R, Robinson PJ, Bell RJ, Moufarege A, Davis SR. Endogenous estrogen and androgen levels are not independent predictors of lipid levels in postmenopausal women. Menopause. 2013;20(6):640–645. [DOI] [PubMed] [Google Scholar]
- 32. Mudali S, Dobs AS, Ding J, Cauley JA, Szklo M, Golden SH. Endogenous postmenopausal hormones and serum lipids: the atherosclerosis risk in communities study. J Clin Endocrinol Metab. 2005;90(2):1202–1209. [DOI] [PubMed] [Google Scholar]
- 33. Suzuki R, Orsini N, Mignone L, Saji S, Wolk A. Alcohol intake and risk of breast cancer defined by estrogen and progesterone receptor status--a meta-analysis of epidemiological studies. Int J Cancer. 2008;122(8):1832–1841. [DOI] [PubMed] [Google Scholar]
- 34. Hankinson SE, Willett WC, Manson JE, et al. . Alcohol, height, and adiposity in relation to estrogen and prolactin levels in postmenopausal women. J Natl Cancer Inst. 1995;87(17):1297–1302. [DOI] [PubMed] [Google Scholar]
- 35. Williams PT, Vranizan KM, Austin MA, Krauss RM. Associations of age, adiposity, alcohol intake, menstrual status, and estrogen therapy with high-density lipoprotein subclasses. Arterioscler Thromb. 1993;13(11):1654–1661. [DOI] [PubMed] [Google Scholar]
- 36. Volcik KA, Ballantyne CM, Fuchs FD, Sharrett AR, Boerwinkle E. Relationship of alcohol consumption and type of alcoholic beverage consumed with plasma lipid levels: differences between Whites and African Americans of the ARIC study. Ann Epidemiol. 2008;18(2):101–107. [DOI] [PMC free article] [PubMed] [Google Scholar]
- 37. Brinton EA. Effects of ethanol intake on lipoproteins and atherosclerosis. Curr Opin Lipidol. 2010;21(4):346–351. [DOI] [PubMed] [Google Scholar]
- 38. Baer DJ, Judd JT, Clevidence BA, et al. . Moderate alcohol consumption lowers risk factors for cardiovascular disease in postmenopausal women fed a controlled diet. Am J Clin Nutr. 2002;75(3):593–599. [DOI] [PubMed] [Google Scholar]
- 39. Jarvik GP, Wijsman E, Little RE, Albers JJ, Motulsky AG, Brunzell JD. Host and environmental effects on plasma apolipoprotein B. Int J Clin Lab Res. 1993;23(4):215–220. [DOI] [PubMed] [Google Scholar]
- 40. Rotheneder M, Kostner GM. Effects of low- and high density lipoproteins on the proliferation of human breast cancer cell lines in vitro: differences between hormone-dependent and hormone-independent cell lines. Int J Cancer. 1989;43(5):875–879. [DOI] [PubMed] [Google Scholar]
- 41. Danilo C, Gutierriz-Pajares JL, Mainieri MA, Mercier I, Lisanti MP, Frank PG. Scavenger receptor class B type 1 regulates cellular cholesterol metabolism and cell signaling associated with breast cancer development. Breast Cancer Res. 2013;15(0):R87. [DOI] [PMC free article] [PubMed] [Google Scholar]
- 42. Salpeter SR, Walsh JM, Ormiston TM, Greyber E, Buckley NS, Salpeter EE. Meta-analysis: effect of hormone-replacement therapy on components of the metabolic syndrome in postmenopausal women. Diabetes Obes Metab. 2006;8(5):538–554. [DOI] [PubMed] [Google Scholar]
- 43. Wang X, Magkos F, Mittendorfer B. Sex differences in lipid and lipoprotein metabolism: it’s not just about sex hormones. J Clin Endocrinol Metab. 2011;96(4):885–893. [DOI] [PMC free article] [PubMed] [Google Scholar]
- 44. Boyd NF, McGuire V, Fishell E, Kriukov V, Lockwood G, Tritchler D. Plasma lipids in premenopausal women with mammographic dysplasia. Br J Cancer. 1989;59(5):766–771. [DOI] [PMC free article] [PubMed] [Google Scholar]
- 45. Boyd NF, Connelly P, Lynch H, et al. . Plasma lipids, lipoproteins, and familial breast cancer. Cancer Epidemiol Biomarkers Prev. 1995;4(2):117–122. [PubMed] [Google Scholar]
- 46. Langsted A, Freiberg JJ, Nordestgaard BG. Fasting and nonfasting lipid levels: influence of normal food intake on lipids, lipoproteins, apolipoproteins, and cardiovascular risk prediction. Circulation. 2008;118(20):2047–2056. [DOI] [PubMed] [Google Scholar]
Associated Data
This section collects any data citations, data availability statements, or supplementary materials included in this article.