Significance
The brain requires iron for mitochondrial respiration and synthesis of myelin, neurotransmitters, and monoamine oxidases. Iron accumulates in distinct parts of the brain in patients with neurodegenerative diseases, and some have proposed that neurons die because they contain too much iron. Neuronal iron handling is not well understood. We focused on dopaminergic neurons, affected in Parkinson’s disease, and manipulated molecules involve in iron uptake and release. We showed that loss of ferroportin, which exports cellular iron, had no apparent effect. In contrast, loss of transferrin receptor, involved in iron uptake, caused neuronal iron deficiency and neurodegeneration with features similar to Parkinson’s disease. We propose that neuronal iron deficiency may contribute to neurodegeneration in human disease.
Keywords: iron, transferrin receptor, ferroportin, dopaminergic neuron, neurodegeneration
Abstract
Disrupted brain iron homeostasis is a common feature of neurodegenerative disease. To begin to understand how neuronal iron handling might be involved, we focused on dopaminergic neurons and asked how inactivation of transport proteins affected iron homeostasis in vivo in mice. Loss of the cellular iron exporter, ferroportin, had no apparent consequences. However, loss of transferrin receptor 1, involved in iron uptake, caused neuronal iron deficiency, age-progressive degeneration of a subset of dopaminergic neurons, and motor deficits. There was gradual depletion of dopaminergic projections in the striatum followed by death of dopaminergic neurons in the substantia nigra. Damaged mitochondria accumulated, and gene expression signatures indicated attempted axonal regeneration, a metabolic switch to glycolysis, oxidative stress, and the unfolded protein response. We demonstrate that loss of transferrin receptor 1, but not loss of ferroportin, can cause neurodegeneration in a subset of dopaminergic neurons in mice.
In the brain, iron is needed for mitochondrial respiration and synthesis of myelin, neurotransmitters, and monoamine oxidases (1, 2). Transferrin receptor 1 (TFR1) is known to be required for iron uptake by some, but not all, cell types (3–7). Its ligand, transferrin (TF), carries extracellular iron. Fe2-TF/TFR1 is internalized by receptor-mediated endocytosis and trafficked to endosomes, where low pH liberates iron from TF, allowing it to leave the endosome through transmembrane transport. This transport is mediated by divalent metal transporter 1 (DMT1/SLC11A2) in erythroblasts and possibly other cell types (8). Imported iron is used directly, incorporated into heme or Fe-S clusters, or stored in ferritin. It has been widely assumed that neuronal iron uptake depends on TFR1-mediated endocytosis of Fe2-TF (9), but in vivo evidence is scant. Expression of a dominant negative form of Tfr1 was shown to decrease iron uptake by hippocampal CA1 pyramidal neurons (10). However, others noted that iron distribution does not correlate with Tfr1 expression in the brain and suggested that Tfr1 may have roles unrelated to iron uptake (11).
There is only one known mechanism for cellular iron release, involving the transmembrane transporter ferroportin (FPN). FPN exports iron, in collaboration with ceruloplasmin or a related ferroxidase, to be loaded onto TF (8). Intracellular iron homeostasis is controlled by iron-regulatory proteins (IRPs), which recognize iron regulatory elements (IREs) in the untranslated portions of mRNAs encoding proteins important for iron transport or storage (12). In iron deficiency, IRPs bind IREs to block ribosomal entry onto ferritin mRNAs, precluding translation of this iron storage protein, and IRPs stabilize mRNAs encoding TFR1 and SLC11A2, facilitating iron uptake. In iron surfeit, ferritin mRNAs are actively translated to store excess iron and iron import-related mRNAs are degraded. This well-studied homeostatic mechanism allows cells to regulate their iron content and offers a very sensitive approach to detect cellular iron deficiency and surfeit (12).
Iron homeostasis is altered locally, in the affected part of the brain, in most human neurodegenerative disorders (13). Iron accumulates in the substantia nigra (SN) in Parkinson’s disease (PD) (14–16), although it is unsettled whether increased iron is in neuropil (17) or dopaminergic (DA) neurons (18), or both. Excess DA neuron iron has been proposed to contribute to disease pathogenesis (19). Conversely, several reports suggest that systemic iron deficiency, rather than iron overload, may predispose to PD. PD has been associated with a history of anemia years before the onset of motor symptoms (20), with multiple blood donations that deplete iron stores (21), and with low serum iron (22). Genetic predisposition to iron overload appears to be protective (23–25). Thus, iron deposition in the SN may or may not be in DA neurons themselves, and iron overload, iron deficiency, or both might be deleterious to DA neurons.
We used conditional KO mice to study how perturbations of iron transport affect DA neuron survival and function. Others previously suggested that inactivation of FPN results in iron accumulation in DA neurons, causing PD (19). However, it was not clear why DA neurons would require active iron export or why compensatory changes in cellular iron import or storage would not maintain iron homeostasis. Accordingly, we found that mice lacking Fpn in DA neurons had no apparent abnormalities in neuronal iron homeostasis and no evidence of neurodegeneration or DA neuron dysfunction. However, mice lacking Tfr1 in DA neurons developed a severe phenotype characterized by DA neuron iron insufficiency, progressive degeneration of neurons in the SN, decreased motor activity, and early death. We conclude that Tfr1 is important for iron homeostasis in DA neurons of the SN and that Fpn is dispensable.
Results
Deletion of Fpn in DA Neurons Has No Apparent Consequences.
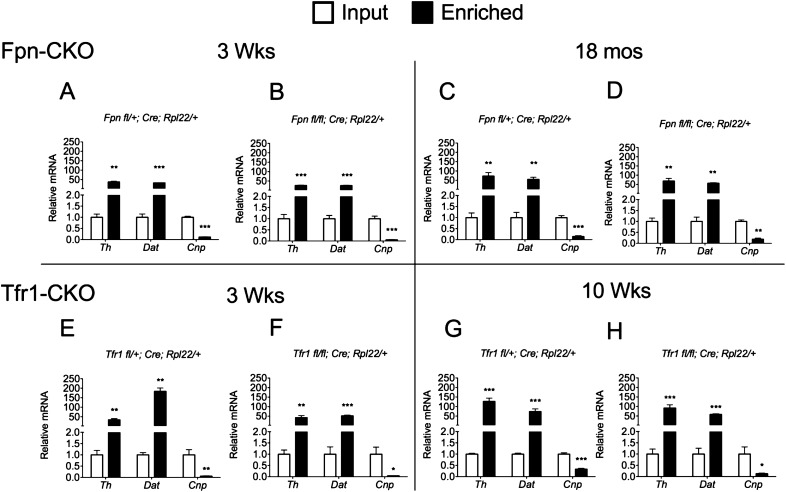
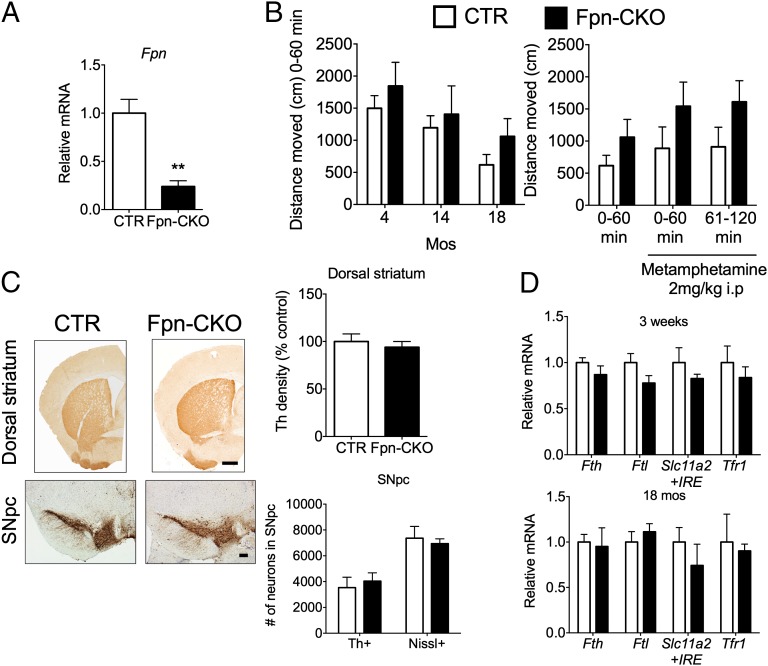
We inactivated Fpn in DA neurons by crossing dopamine transporter (Dat)IRES Cre (26) and Fpnfl/fl mice (27) to obtain Fpn conditional KO (Fpn-CKO) mice. We confirmed Fpn depletion by analyzing polysome-associated mRNAs from ventral midbrain DA neurons. To do this, we bred the floxed Fpn allele and DatIRESCre transgene onto a Ribotag background (28) to allow for Cre-dependent expression of hemagglutinin (HA)-tagged ribosomal protein L22. We used the HA tag to immunoprecipitate polysome-associated mRNA from these mice at 3 wk and 18 mo of age and confirmed that it was highly enriched for DA neuron transcripts and depleted of an oligodendrocyte marker (Fig. S1 A–D). By quantitative RT-PCR (qPCR), we observed a marked decrease in polysome-associated Fpn mRNA at 3 wk of age (Fig. 1A), indicating that most Fpn alleles had been inactivated. Residual Fpn mRNA may have come from contamination by other cell types or incomplete inactivation of the floxed Fpn allele.
Fig. S1.
Enrichment of transcripts expressed in DA neurons from Tfr1-CKO and Fpn-CKO mice using Ribotag technology. (A–D) Fpn-CKO mice. Comparison of the relative abundance of mRNA species from ventral midbrain input and enriched (pellet) fractions of DA neurons in CTR (Fpnfl/+; Cre; Rpl22/+; A and C) and Fpn-CKO (Fpnfl/fl; Cre; Rpl22/+; B and D) samples prepared from 3-wk- and 18-mo-old mice, respectively (3 wk: CTR n = 4, Fpn-CKO n = 7; 18 mo: CTR n = 4, Fpn-CKO n = 3). Relative input mRNA levels were adjusted to 1. Data are presented as means ± SEM; Student’s t test, **P < 0.01; ***P < 0.001. (E–H) Tfr1-CKO mice. Comparison of the relative abundance of mRNA species from ventral midbrain (input) and enriched fractions (pellet) of DA neurons in CTR (Tfr1fl/+; Cre; Rpl22/+; E and G) and Tfr1-CKO (Tfr1fl/fl; Cre; Rpl22/+; F and H) samples at 3 (E and F) and 10 wk (G and H) of age. Specific DA neuronal markers (Th and Dat) were enriched in the pellet fraction compared with the input. Conversely, an oligodendrocyte marker, 2′,3′-cyclic-nucleotide 3′-phosphodiesterase (Cnp), was markedly less abundant in the pellet fraction. Relative input mRNA levels were adjusted to 1. At 3 wk, CTR n = 4, Tfr1-CKO n = 3; at 10 wk, CTR n = 3, Tfr1-CKO n = 4. Data are presented as means ± SEM; Student’s t test, *P < 0.05; **P < 0.01; ***P < 0.001.
Fig. 1.
Deletion of Fpn in DA neurons. White bars, control (CTR); black bars, Fpn-CKO. (A) QPCR analysis of Fpn after immunoprecipitation of HA-tagged polysomes from CTR;Ribotag and Fpn-CKO;Ribotag ventral midbrain homogenates, relative to CTR = 1 (CTR n = 4; Fpn-CKO n = 5; mice 3 wk of age); Student’s t test, **P < 0.01. (B) Locomotor activity in OF. (Left) Basal cumulative distance traveled in the same cohort of mice at 4, 14, and 18 mo of age (mos) (n ≥ 8 for both genotypes/all time points). Repeated measures analyses of variance (RMANOVA) found a significant effect of age [F(2,28) = 27.452, P < 0.001] but not genotype; (Right) 19 mo mice were treated with 2 mg/kg i.p. metamphetamine 60 min postacclimatization in the OF. RMANOVA revealed a significant time effect [F(2,28) = 4.871, P < 0.015], but other comparisons were not significant. Bonferroni comparisons showed that, compared with baseline, all animals displayed increased activity to metamphetamine that was significant 2 h postinjection (P < 0.046). Data are represented as mean ± SEM distance traveled in 1-h blocks of time (n = 8 for both genotypes). (C) Anti-Th immunostaining of the dorsal striatum and SN at 19 mos. (Upper) Representative images from the dorsal striatum and quantification of terminal density; (Lower) representative images from SNpc. Th+ and Nissl+ cell numbers were determined using stereology. Terminal density was quantified using ImageJ (rsbweb.nih.gov/ij/). (Scale bars: 200 μm.) Student’s t test indicated no significant differences in terminal densities or cell numbers between genotypes. (CTR n = 5; Fpn-CKO n = 5.) (D) Relative polysome-associated mRNA for iron-related genes in DA neurons of CTR and Fpn-CKO mice at 3 wk and 18 mos of age. CTR mRNA expression was adjusted to 1. At 3 wk CTR n = 4, Fpn-CKO n = 5; at 18 mos CTR n = 4, Fpn-CKO n = 3. Student’s t test indicated no significant differences between genotypes. All data are presented as means ± SEM.
Fpn-CKO mice appeared similar to control (CTR) mice. There were no significant differences in basal activity in an open field (OF) at 4, 14, or 18 mo or response to metamphetamine at 18 mo (Fig. 1B). Neurophysiological and behavioral tests (29) showed no differences at 16 mo. Th staining in the dorsal striatum and cell counts in the SN pars compacta (SNpc) were also indistinguishable at 19 mo (Fig. 1C).
Because the ventral midbrain contains multiple cell types, we could not use tissue to examine the iron content of DA neurons. We attempted to quantify iron content of DA neurons isolated from the ventral midbrain by FACS followed by inductively coupled plasma MS (ICP-MS), but the amounts were too low. Similarly, there was too little iron to visualize with Perls stain. As an alternative approach, we examined polysome-associated DA neuron mRNA for evidence of posttranscriptional regulation by the IRE/IRP system. Cellular iron surfeit should result in increased Fth and Ftl and decreased Slc11a2 and Tfr1 mRNAs, but we observed no significant differences between Fpn-CKO and CTR mice at 3 wk and 18 mo (Fig. 1D). We conclude that Fpn was not essential for DA neuron survival or function and Fpn-CKO DA neurons did not accumulate excess iron.
Tfr1 Is Critical for DA Neuron Iron Homeostasis, Function, and Survival.
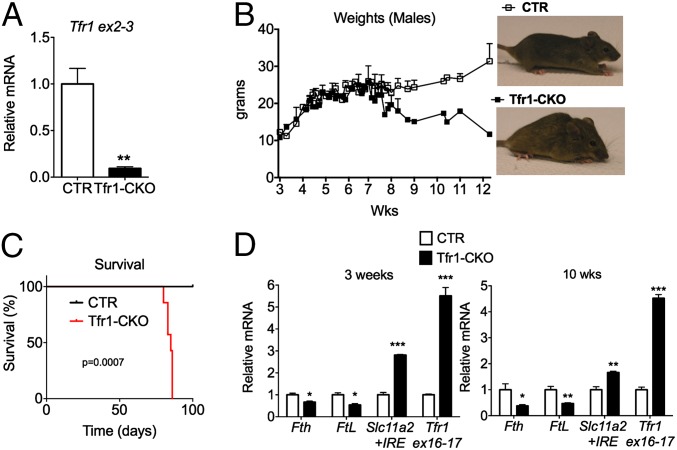
To determine whether Tfr1 was involved in DA neuron iron assimilation, we crossed Tfr1fl/fl and DatIRES Cre mice to obtain Tfr1-CKO animals. Ribotag polysome-associated mRNA from ventral midbrain at 3 and 10 wk was highly enriched for DA neuron transcripts (Fig. S1 E–H) and depleted of Tfr1 mRNA (Fig. 2A). Tfr1-CKO mice were grossly indistinguishable from CTR littermates until 7 wk of age when they began to lose weight (Fig. 2B) and died by wk 12 (Fig. 2C). Polysome-associated mRNA at 3 and 10 wk (Fig. 2D) revealed decreased Fth and Ftl mRNAs and increased Tfr1 (primers spanning retained exons 16 and 17) and Slc11a2+IRE mRNAs in Tfr1-CKO ventral midbrain DA neurons, indicating that they were iron deficient.
Fig. 2.
DA neuron Tfr1 is critical for survival and iron homeostasis. (A) Relative levels of Tfr1 mRNA in DA neurons (CTR n = 4, Tfr1-CKO n = 3); unpaired Student’s t test, **P < 0.01. (B) Body weights over time and representative images at 12 wk. (C) Survival curve (CTR n = 6, Tfr1-CKO n = 7); P = 0.0007. (D) Relative polysome-associated mRNA for iron-related genes at 3 and 10 wk of age; Tfr1 sequences were from exons 16 and 17 which were not deleted. CTR mean adjusted to 1. At 3 wk CTR n = 4, Tfr1-CKO n = 3; at 10 wk CTR n = 3, Tfr1-CKO n = 4. Data are presented as means ± SEM; Student’s t test, *P < 0.05; **P < 0.01; ***P < 0.001.
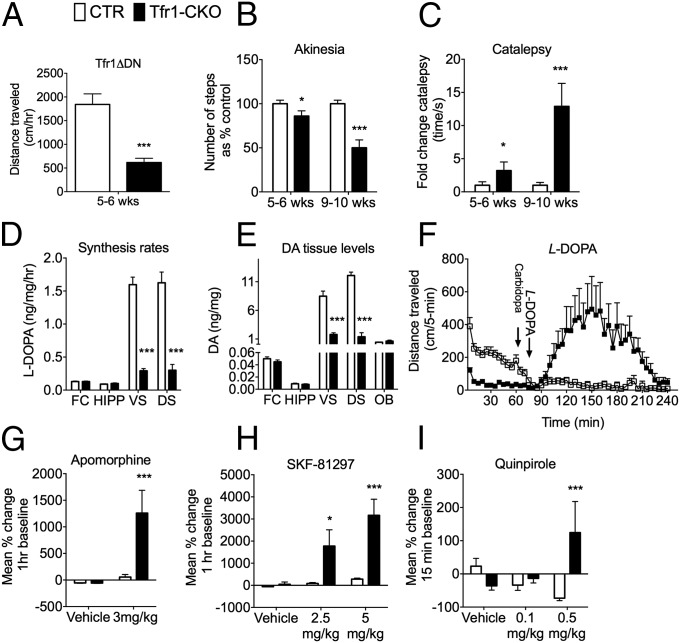
At 10 wk, Tfr1-CKO mice had hunched posture, low pelvis, attenuated response to visual stimuli, and reduced reflexive behavior (Fig. 2B and Table S1). Earlier they showed decreased locomotor activity in an OF (Fig. 3A), age-progressive reduction in steps taken with their front legs when their rear legs were suspended (Fig. 3B), and delayed removal of forepaws placed on a bar (Fig. 3C). These latter behaviors are considered analogous to human akinesia and catalepsy, respectively.
Table S1.
Neurophysiological screen
| Feature evaluated | 5–6 wk Tfr1-CKO | 9–10 wk Tfr1-CKO |
| Skin color/hair loss | Normal | Normal |
| Body tone | Hunched (25%)* | Hunched (83%)* |
| Pelvic elevation | Low (100%)† | Low (83%)† |
| Lacrimation/palpebral closure | Normal/normal | Dry/normal (50%)‡ |
| Muscle/fat | Reduced (66.7%)§ | Reduced (83%)§ |
| Exophthalmos | Normal (33%)¶ | Sunken (67%)¶ |
| Convulsions/tremor | Absent | Absent |
| Heart rate | Normal | Slow (83%)# |
| Respiration rate | Normal | Slow (50%)|| |
| Piloerection | Normal | Normal |
| Barbering (% expressing) | None | None |
| Visual orientation to object | 11.1% orientation to stimuli vs. 96% in CTR** | 5.5% orientation to stimuli vs. 81% in CTR** |
| Visual placement | Reach at 1.3 vs. 2.3 cm in CTR | Reach at 1 vs. 1.64 in CTR†† |
| Whisker stop | Normal | Normal |
| Eye reflex | Normal | Normal |
| Pinna (ear) reflex | Normal | Normal |
χ2 analyses compared with CTRs, χ2(1,43) = 24.840, P < 0.001: Tfr1-CKO mice are more likely to exhibit a hunched posture, only 25% at early age, and this increases to 83% at an advanced age. CTR did not exhibit hunched postures at either age group.
χ2 analyses compared with CTRs, χ2(1,43) = 37.130, P < 0.001: Tfr1-CKO mice are more likely to exhibit reduced pelvic elevation, which remains stable over time: 100% at early age, and this remains relatively stable at 83% at an advanced age. The small reduction from 100% in age group 2 for the Tfr1-CKO mice may be secondary to a large sample size at this advanced age. CTRs did not exhibit reduced pelvic elevations at either age group.
χ2 analyses compared with CTRs, χ2(1,43) = 7.791, P < 0.005: at a young age, no effects in lacrimation were found, but 50% of older Tfr1-CKO mice showed changes in this phenotype. CTRs did not exhibit abnormalities in lacrimation at either age group.
χ2 analyses compared with CTRs, χ2(1,43) = 22.994, P < 0.001: at a young age, 66% exhibited reduced body fat (lean composition) and this increases to 83%. CTRs did not exhibit abnormalities in body composition at either age group (balanced fat:muscle ratio).
χ2 analyses compared with CTRs, χ2(1,43) = 16.408, P < 0.001: at a young age, 33% exhibited exophthalmos (sunken eyes) and this increases to 66.7%. CTRs did not exhibit abnormalities in exopthalamus at either age group.
χ2 analyses compared with CTRs, χ2(1,43) = 21.374, P < 0.001: at an early age, all mice show relatively normal heart rate, and this increases to 83% with reduced heart rate at an advanced age. CTRs did not exhibit abnormalities in heart rate at either age group.
χ2 analyses compared with CTRs, χ2(1,43) = 12.183, P < 0.001: at an early age, all mice show relatively normal RR, and this increases to 50% with reduced RR at an advanced age. CTRs did not exhibit abnormalities in RR at either age group.
ANOVA – genotype × age group = % orientation to a moving object; FGenotype(1,39) = 84.481, P < 0.001; age F(1,39) = 1.371, P = not significant; genotype × age F(1,39) = 0.288, P = not significant.
ANOVA – genotype × age group = reaching for platform when lowered; FGenotype(1,39) = 7.887, P < 0.008; marginal age F(1,39) = 3.091, P < 0.087; genotype × age F(1,39) = 0.380, P = not significant. Tfr1-CKO mice have poorer eye sight; there was a small decrease with age overall (all mice) but not statistically significant.
Fig. 3.
Loss of Tfr1 in DA neurons leads to abnormal behavior. White bars, CTR; black bars, Tfr1-CKO. (A) Overall distance traveled by CTR and Tfr1-CKO mice over 60 min in the OF [CTR n = 14; Tfr1-CKO n = 13; t(1,25) = 4.959, P < 0.001]. (B and C) Akinesia and catalepsy in mice at 5–6 and 9–10 wk of age, two-way ANOVA. For akinesia, we observed a significant main effect of age [F(1,44) = 10.410, P < 0.02] and genotype [F(1,44) = 32.568, P < 0.001]; the age by genotype interaction was also significant [F(1,44) = 10.413, P < 0.002]. Bonferroni test showed a significant decrease in steps in Tfr1-CKO mice over time (both P < 0.05). When assessed for catalepsy, we also observed a significant age [F(1,42) = 36.137, P < 0.001] and genotype effect [F(1,42) = 27.55, P < 0.001] and age by genotype interaction [F(1,42) = 31.064, P < 0.001]. Bonferroni test showed a significant increase in catalepsy in the Tfr1-CKO mice that worsened in severity over time (P < 0.001). In both experiments CTR n = 5; Tfr1-CKO n = 6 at 5–6 wk and CTR n = 12; Tfr1-CKO n = 7 at 9–10 wk. (D) L-DOPA in vivo synthesis rates in the frontal cortex (FC) at 7 wk, hippocampus (HIPP), ventral striatum (VS), and dorsal striatum (DS). Data are presented as ng/mg/hr (CTR n = 12; Tfr1-CKO n = 14); Student’s t test, ***P < 0.001. (E) Tissue levels of dopamine in the FC, HIPP, VS, DS, and olfactory bulb (OB). Data are presented as ng/mg (CTR n = 14; Tfr1-CKO n = 16); Student’s t test, ***P < 0.001. (F) After habituation to the OF for 1 h, mice were given 5 mg/kg carbidopa, returned to the OF for 10 min, administered 20 mg/kg L-DOPA, and placed into the OF for 170 min (CTR n = 12; Tfr1-CKO n = 9). Before administration of carbidopa, RMANOVA confirmed a significant effect of time [F(11,209) = 19.699, P < 0.001], and treatment by genotype interaction [F(11,209) = 4.347, P < 0.001]. Bonferroni tests found, as expected, that the locomotion for Tfr1-CKO mice was lower than that for CTRs at all preinjection time-points (P < 0.008). Post–l-DOPA injection, RMANOVA revealed a significant effect of time [F(29,551) = 5.382, P < 0.006], genotype [F(1,19) = 9.894, P < 0.005], and time by genotype interaction [F(29,551) = 4.766, P < 0.001]. Bonferroni post hoc comparison confirmed that Tfr1-CKO mice dramatically increased their locomotor responses to L-DOPA beginning at 100 min and lasting until 220 min postinjection (P < 0.043). (G–I) OF locomotor activity following i.p. injection of dopamine receptor agonists. (G) 3 mg/kg apomorphine (CTR n = 14; Tfr1-CKO n = 13). A two-way ANOVA revealed the effects of genotype [F(1,50) = 8.288, P < 0.006] and treatment [F(1,50) = 11.717, P < 0.01] and the treatment by genotype interaction [F(1,50) = 8.375, P < 0.001] to be significant. Bonferroni tests showed that apomorphine exerted a pronounced effect on Tfr1-CKO activity (P < 0.001). (H) 2.5 or 5 mg/kg SKF-81297 (CTR n ≥ 5; Tfr1-CKO n ≥ 8 across all treatments). A two-way ANOVA for SKF-81297 determined the effects of genotype [F(1,51) = 8.717, P < 0.005] and treatment [F(2,51) = 3.561, P < 0.036]; genotype by treatment interaction was not significant. Bonferroni corrections showed that locomotor responses to 2.5 and 5 mg/kg SKF-81297 were greatly stimulated in Tfr1-CKO mice (ps < 0.05). (I) 0.1 or 0.5 mg/kg quinpirole (D2 receptor agonist; CTR n ≥ 6; Tfr1-CKO n ≥ 8 across all treatments). Two-way ANOVA discerned only the genotype by treatment interaction to be significant [F(2,51) = 5.522, P < 0.007]. Tfr1-CKO mice showed a potentiated response to 0.5 mg/kg quinpirole relative to CTR animals (P < 0.001). All data are presented as means ± SEM; ***P < 0.001, CTR versus Tfr1-CKO mice.
At 7 wk, we observed a marked decrease in L-dihydroxyphenylalanine (L-DOPA) synthesis rates (Fig. 3D) and tissue dopamine levels (Fig. 3E) in the dorsal and ventral striata of Tfr1-CKO mice, although there was no significant difference in Th mRNA. Other brain regions were not affected. Dopamine metabolites 3,4-dihydroxyphenylacetic acid (DOPAC) and homovanillic acid (HVA) were also decreased in the ventral and dorsal striata of Tfr1-CKO mice (Table S2). Tfr1-CKO and CTR mice were habituated to an OF for 1 h, treated with carbidopa, and given L-DOPA 10 min later (Fig. 3F). After L-DOPA, we observed a marked increase in locomotion in Tfr1-CKO mice relative to CTRs. We treated with the mixed D1 and D2 receptor agonist apomorphine and found that Tfr1-CKO animals were hyperresponsive (Fig. 3G). Tfr1-CKO mice had increased locomotion in response to 2.5 and 5 mg/kg SKF-81297, a D1 agonist (Fig. 3H), and a potentiated response to 0.5 mg/kg quinpirole, a D2 agonist (Fig. 3I).
Table S2.
Dopamine metabolites
| Regions | Genotype | N | DOPAC | HVA | ||||
| Mean | SE | P value | Mean | SE | P value | |||
| Frontal cortex | CTR | 14 | 0.062 | 0.006 | <0.001 | 0.103 | 0.007 | 0.572 |
| Tfr1-CKO | 16 | 0.031 | 0.004 | 0.098 | 0.005 | |||
| Ventral striatum | CTR | 14 | 1.143 | 0.101 | <0.001 | 1.119 | 0.146 | <0.001 |
| Tfr1-CKO | 16 | 0.343 | 0.087 | 0.424 | 0.082 | |||
| Hippocampus | CTR | 14 | 0.014 | 0.001 | 0.001 | Not detected | ||
| Tfr1-CKO | 16 | 0.009 | 0.001 | Not detected | ||||
| Olfactory bulb | CTR | 13 | 0.116 | 0.011 | 0.237 | 0.156 | 0.008 | 0.454 |
| Tfr1-CKO | 15 | 0.165 | 0.037 | 0.139 | 0.005 | |||
| Dorsal striatum | CTR | 14 | 1.234 | 0.070 | <0.001 | 1.163 | 0.125 | <0.001 |
| Tfr1-CKO | 16 | 0.212 | 0.050 | 0.235 | 0.048 | |||
Data are presented as ng/mg of wet tissue.
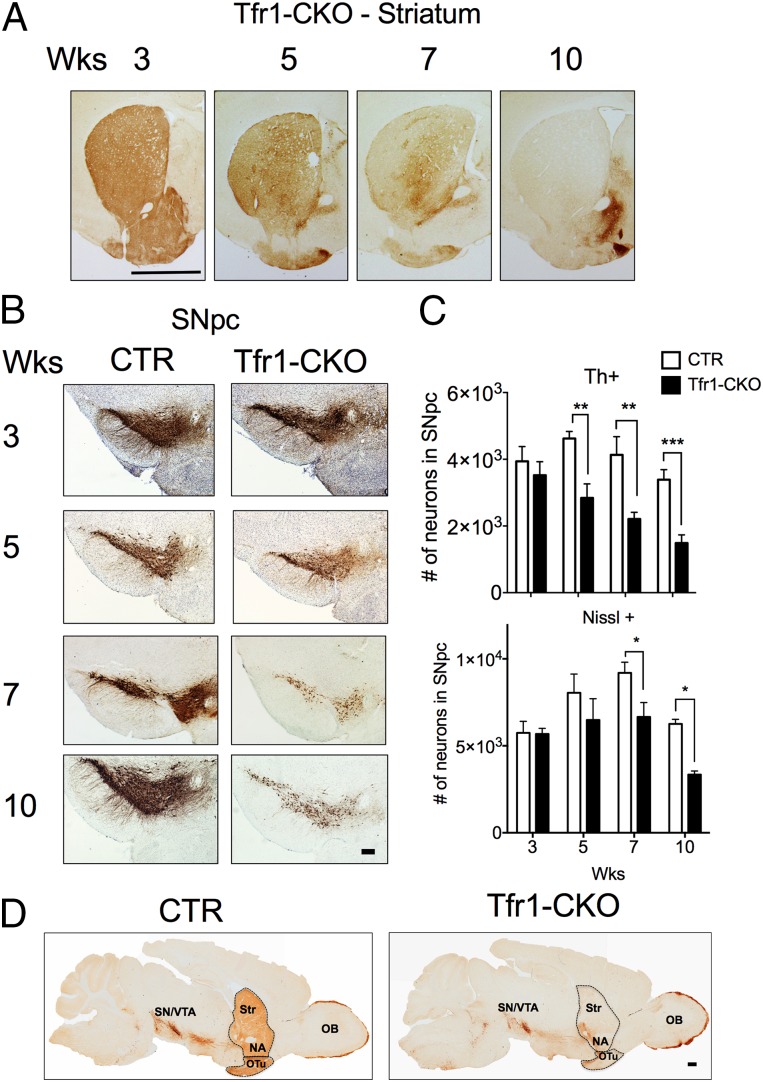
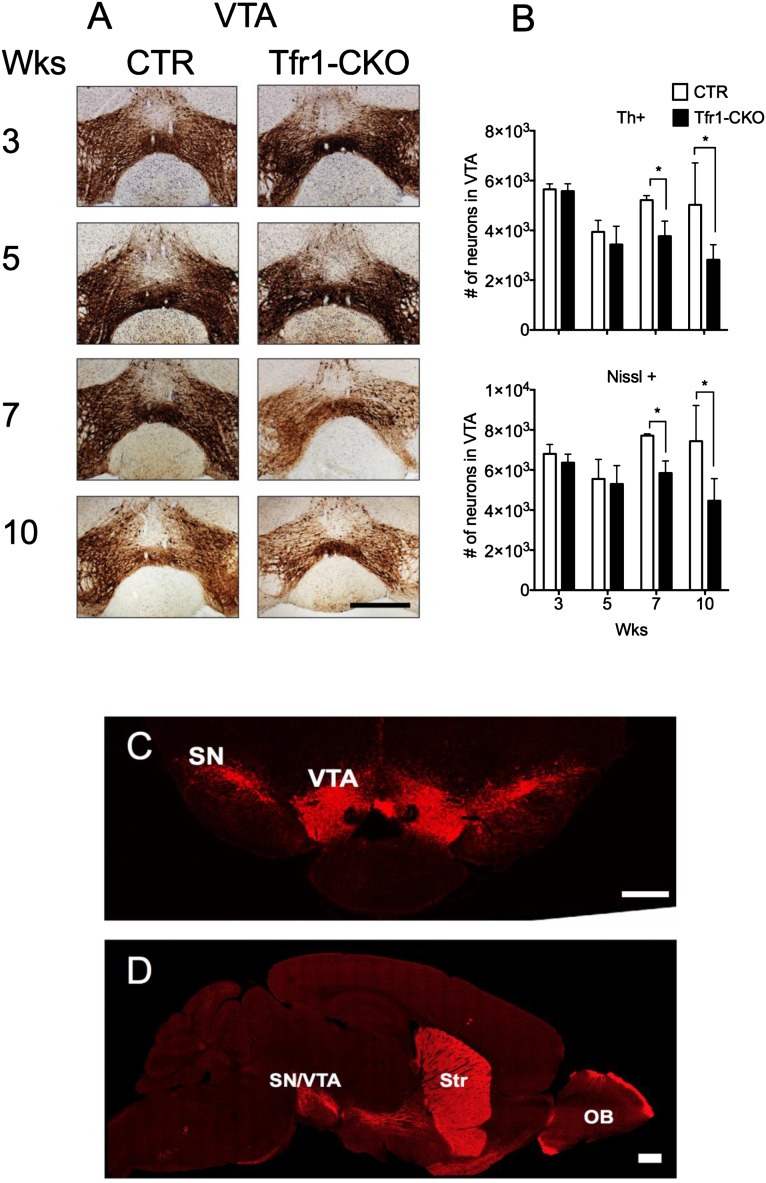
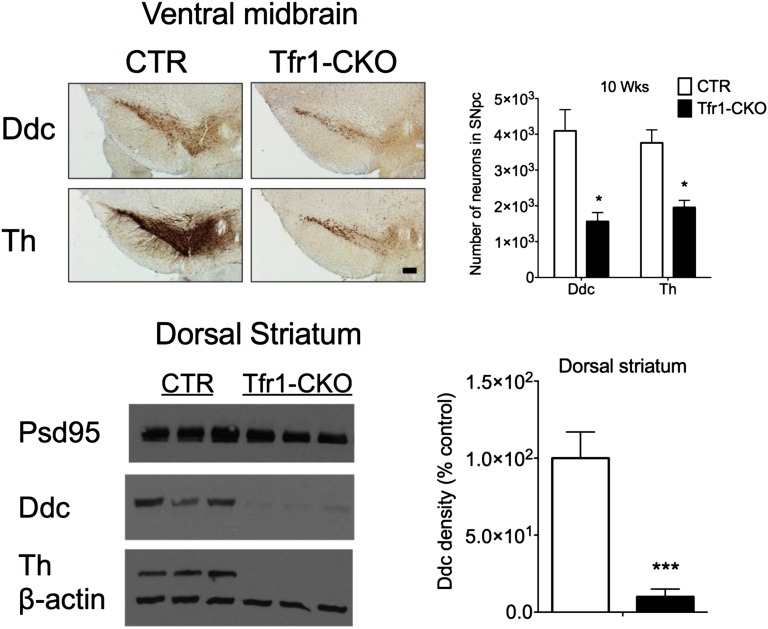
Th staining in the dorsal striatum was similar in CTR and Tfr1-CKO mice at 3 wk, but progressively decreased in Tfr1-CKO animals thereafter (Fig. 4A). Th+ cell counts in the SNpc of Tfr1-CKO mice similarly decreased at 5, 7, and 10 wk (Fig. 4 B and C). SNpc Nissl+ neuron counts were similar at 3 and 5 wk, but significantly decreased at 7 and 10 wk in Tfr1-CKO mice. We observed later cell loss in the ventral tegmental area (VTA), despite efficient Cre expression there and in other DA neurons (Fig. S2 A–D). Terminals and DA neurons in the nucleus accumbens and olfactory bulb appeared to be relatively spared even at 10 wk (Fig. 4D). We stained for DOPA decarboxylase (Ddc) and obtained similar results (Fig. S3). In summary, we observed a selective, progressive loss of nigrostriatal DA projections in the dorsal striatum and a later loss of DA neurons in the SNpc and then the VTA. Th staining in the ventral striatum was similar between genotypes. These data are consistent with the behavioral abnormalities we observed in Tfr1-CKO mice.
Fig. 4.
Age-progressive neurodegeneration. (A) Representative images from dorsal striatum of Tfr1-CKO mice (3, 5, 7, and 10 wk of age). (B) Representative SN images from 3, 5, 7, and 10 wk CTR and Tfr1-CKO mice. (C) Numbers of Th+ neurons (Upper) and Nissl+ cells (Lower) in the SNpc at 3, 5, 7, and 10 wk. SNpc cells were quantified with StereoInvestigator by immunolabeling with anti-Th and counterstaining with Nissl (n ≥ 4 for each genotype and timepoint); for Th+ neurons, two-way ANOVA indicated a significant genotype [F(1,38) = 35.910, P < 0.01] and age [F(3,38) = 6.812, P < 0.01] effect, whereas Bonferroni showed a highly significant decrease in Tfr1-CKO mice at 5, 7, and 10 wk compared with CTRs (P < 0.02). For Nissl+ neurons, two-way ANOVA indicated a significant genotype [F(1,38) = 13.682, P < 0.01] and age [F(3,38) = 9.067, P < 0.01] effect. Bonferroni showed a trend toward a decrease in Tfr1-CKO mice relative to CTRs at 5 wk and a highly significant decrease at 7 and 10 wk (P < 0.02). (D) Representative sagittal sections from 10 wk CTR and Tfr1-CKO mice immunolabeled with anti-Th antibody. NA, nucleus accumbens; OB, olfactory bulb; OTu, olfactory tubercule; SN, substantia nigra; Str, striatum; VTA, ventral tegmental area. All quantitative data are presented as means ± SEM. (Scale bars: A, 2 mm; B, 200 μm; and D, 100 μm.)
Fig. S2.
Delayed Tfr1-null DA neurodegeneration in the VTA including immunostaining of DA neurons in RFP transgenic mice. (A) Representative images from the VTA of 3-, 5-, 7-, and 10-wk-old CTR and Tfr1-CKO mice immunolabeled with anti-Th antibody (Bregma, −3.16 mm). (Scale bar: 100 μm.) (B) Number of Th+ and Nissl+ neurons in the VTA at 3, 5, 7, and 10 wk. DA neurons in the VTA were quantified with StereoInvestigator by immunolabeling with anti-Th and counterstaining with Nissl (n ≥ 4 for each genotype). For Th staining, two-way ANOVA indicated significant age [F(3,18) = 5.612, P < 0.007], genotype [F(1,18) = 8.658, P < 0.009], and age × genotype [F(1,18) = 4.233, P < 0.02] interactions. Bonferroni showed, in Tfr1-CKO mice relative to CTRs, no differences at 3 and 5 wk, but significant decreases at 7 and 10 wk (P < 0.046). For Nissl staining, two-way ANOVA indicated a significant genotype effect [F(1,18) = 12.45, P < 0.03]; Bonferroni showed, in Tfr1-CKO mice relative to CTRs, no differences at 3 and 5 wk, but significant decreases at 7 and 10 wk (P < 0.046). Data are presented as means ± SEM; Student’s t test or two-way ANOVA, *P < 0.05. (C) Representative images displaying expression of Cre-dependent RFP in DA neurons of the VTA and SN. (Bregma, −3.08 mm). (D) Representative sagittal section showing the expression of Cre-dependent RFP in DA neurons of the VTA, SN, Str, and OB. Tissues were obtained from a Tfr1fl/+; Cre; RFP+/− mouse aged 7 wk. (Scale bars: C, 500 μm; and D, 100 μm.)
Fig. S3.
Immunostaining of SN and striatum using anti-Ddc antibody. (Upper Left) Representative images from the SN of 10-wk-old CTR and Tfr1-CKO mice immunolabeled for DOPA decarboxylase (Ddc) or Th. (Scale bar: 200 μm.) (Upper Right) Number of Ddc+ and Th+ neurons in the SN in CTR and Tfr1-CKO mice (n = 3 for each genotype); Student’s t test, *P < 0.05. (Lower Left) Protein lysates were obtained from the dorsal striatum of CTR and Tfr1-CKO mice at 10 wk of age. Representative immunoblots for postsynaptic marker Psd95, Ddc, and Th; β-actin was used as a loading control. (Lower Right) Density of anti-Ddc staining in the dorsal striatum was quantified with ImageJ (n ≥ 3 for each genotype and time point). Data are presented as means ± SEM; Student’s t test, ***P < 0.001.
Characterization of Tfr1-CKO DA Neurons.
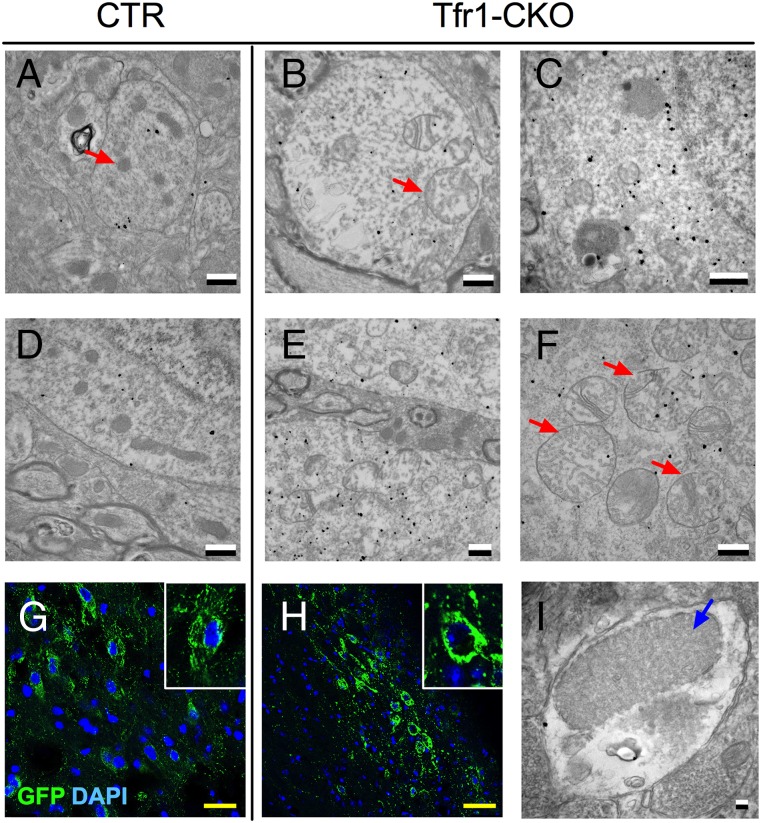
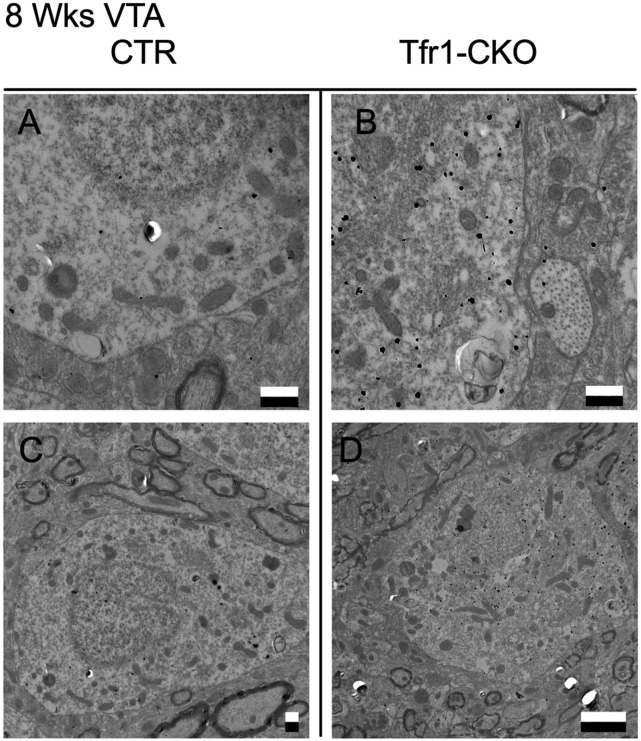
Because neurons require iron for mitochondrial biogenesis (30) and respiration (31), we examined mitochondrial morphology by electron microscopy, identifying DA neurons by immunogold localization of DAT. Although SNpc mitochondria appeared normal in 6-wk Tfr1-CKO mice, at 8 wk, they were enlarged with abnormal cristae (Fig. 5 A–F). In contrast, mitochondria in VTA DA neurons of 8-wk Tfr1-CKO mice appeared similar to CTRs (Fig. S4). We crossed Tfr1-CKO mice with mtYFP transgenic mice that express a mitochondria-targeted GFP in the presence of Cre recombinase (32). Tfr1-CKO mitochondria appeared fused or aggregated in SNpc DA neurons (Fig. 5 G and H). Using stereology at 8 wk, we counted GFP aggregates in SNpc DA neurons. In CTR mice, 4 ± 0.03% of cells contained GFP aggregates (n = 4 mice); in Tfr1-CKO mice, 73 ± 0.84% of cells contained GFP aggregates (n = 3 mice; P < 0.0001). We also observed proteinaceous inclusions in SNpc DA dendrites of Tfr1-CKO but not CTR mice (Fig. 5I).
Fig. 5.
Abnormal mitochondria in Tfr1-CKO DA neurons. Representative EM images of CTR (A and D) and Tfr1-CKO DA neurons (B, C, E, and F) in the SNpc. DA neurons are distinguished by Dat immunogold labeling (black dots). Examples of mitochondria are indicated by red arrows. (G and H) Representative images of CTR;YFP+/− and Tfr1-CKO;YFP+/− DA neurons from 8 wk mice. Green, GFP; blue, DAPI. (Magnification: 200×.) Insets show enlargement for detail. (I) Blue arrow, example of a proteinaceous inclusion. (Scale bars: A–F, 500 nm; G, 25 μm; H, 50 μm; and I, 100 nm.)
Fig. S4.
Representative transmission electron microscopy (EM) images of mitochondria in the VTA from CTR and Tfr1-CKO mice at 8 wk of age. Representative EM images of VTA from CTR (A and C) and Tfr1-CKO (B and D) mice. DA neurons were distinguished by Dat immunogold labeling (black dots). In contrast to the abnormal mitochondria in SN DA neurons from Tfr1-CKO mice at 8 wk of age (Fig. 5), VTA DA neuron mitochondria appeared morphologically similar to CTRs. (Scale bars: A–C, 500 nm; and D, 2 μm.]
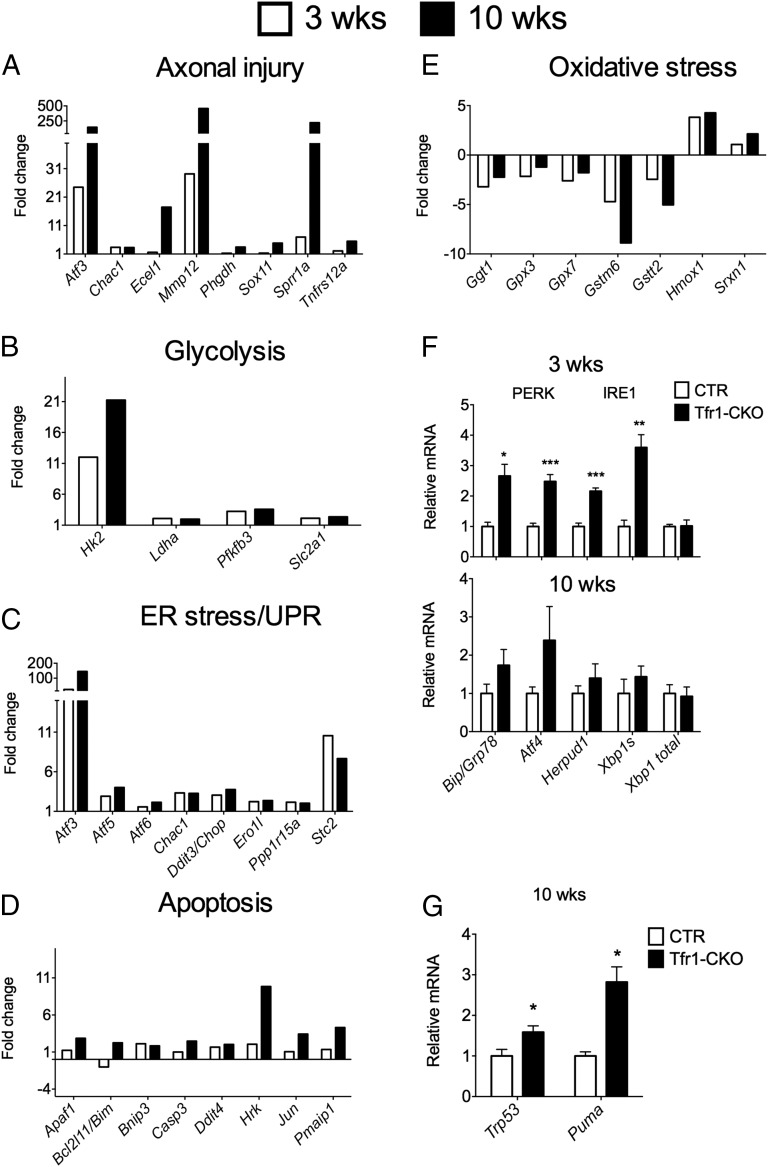
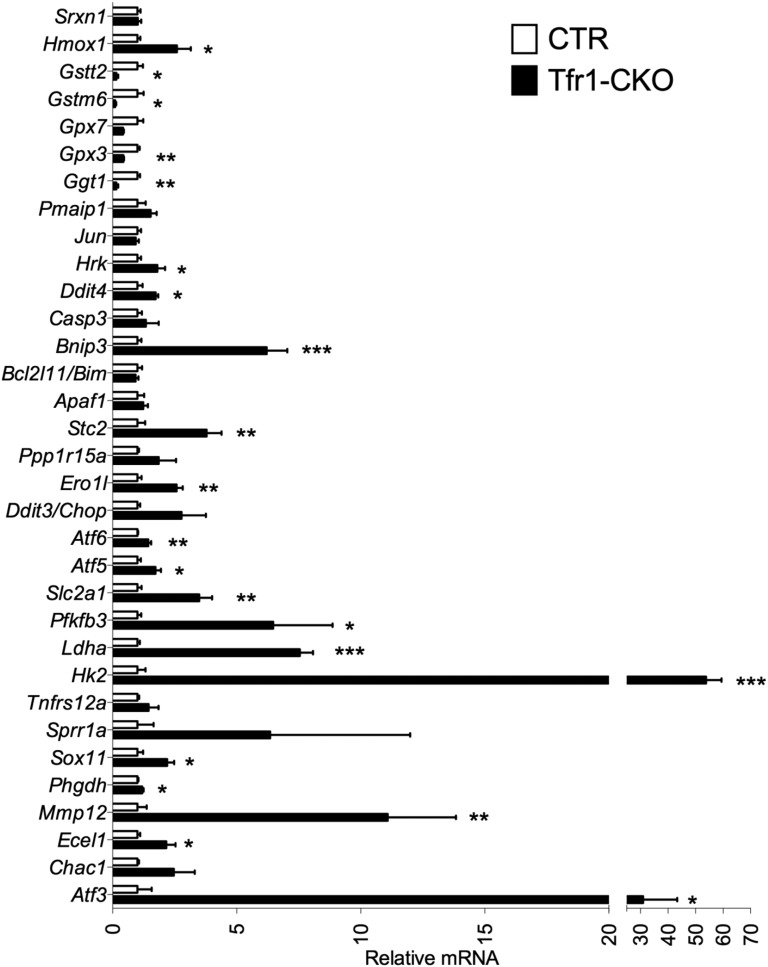
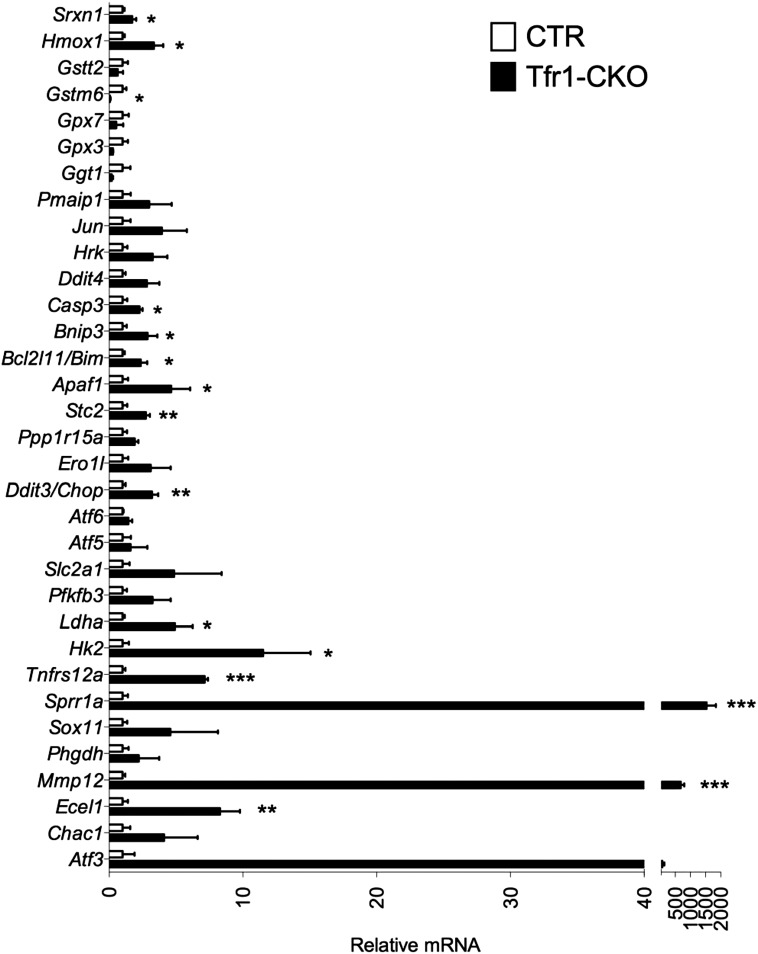
We evaluated gene expression in ventral midbrain DA neurons using Ribotag polysome-associated mRNA to probe Affymetrix microarrays. Data have been deposited online (NCBI accession no. GSE66730). Pertinent results, shown as calculated fold-change, are shown in Fig. 6 A–E. We validated gene expression by qPCR in separate biological replicates (Figs. S5 and S6). Genes with more than twofold change were subjected to Gene Set Enrichment Analysis [(GSEA/MSigDB) (33, 34)]. GSEA revealed induction of several pathways previously associated with neurodegeneration (35)—hypoxia, mTorc1 signaling, the p53 pathway, the unfolded protein response (UPR), and glycolysis—at both 3 and 10 wk. Genes associated with apoptosis were induced at both ages, but more strikingly at 10 wk.
Fig. 6.
Molecular signatures of neurodegeneration. (A–E) Polysome-associated mRNA levels from microarray analysis from mice at 3 and 10 wk. At 3 wk CTR n = 4, Tfr1-CKO n = 3; at 10 wk CTR n = 3, Tfr1-CKO n = 4. Microarray data are represented in bar graph format as calculated fold-change for Tfr1-CKO relative to CTR. Changes of P < 0.05 were regarded as significant with a fold-change threshold of 2. Results are organized by biological pathway; (F) relative mRNA levels measured by QPCR of additional genes encoding components of ER/UPR pathways at 3 and 10 wk of age; gene identifications are shown at the bottom; (G) relative mRNA levels measured by QPCR of Trp53 and Puma at 10 wk. For F and G, at 3 wk CTR n = 4, Tfr1-CKO n = 3; at 10 wk CTR n = 3, Tfr1-CKO n = 4. Data are presented as means ± SEM; Student’s t test, *P < 0.05, **P < 0.01, ***P < 0.001.
Fig. S5.
Validation of microarray results by qPCR in separate biological samples; gene expression from 3-wk samples. mRNA levels from CTR mice were adjusted to 1. CTR n = 4, Tfr1-CKO n = 3. Data are presented as means ± SEM; unpaired Student’s t test, *P < 0.05; **P < 0.01; ***P < 0.001.
Fig. S6.
Validation of microarray results by qPCR in separate biological samples; gene expression from 10-wk samples. mRNA levels from CTR mice were adjusted to 1. CTR n = 5, Tfr1-CKO n = 4. Data are presented as means ± SEM; unpaired Student’s t test, *P < 0.05; **P < 0.01; ***P < 0.001.
Chung et al. identified 52 genes that were expressed at higher levels in SN neurons than VTA neurons (36). Of these, 19 were down-regulated in 10-wk Tfr1-CKO mice compared with controls: Anxa1, Aldh1a7, Sncg, Atp2a3, Srpx2, Tyrp1, Rerg, Grin2c, Cd24a, Trhr, Sox6, Pvrl3, Lix1, Satb1, Igf1, Nrip3, Sox6, Vav3, and Fgf1. No genes classified as specific to the SN were up-regulated in Tfr1-CKO mice, and no genes specific to the VTA were down-regulated. Thus, gene expression was consistent with other observations suggesting that VTA neurons were relatively spared.
The most strongly up-regulated genes in Tfr1-CKO DA neurons were characteristic of axonal injury (37) and were similarly induced in rats after intrastriatal 6-hydroxydopamine treatment (38) (Fig. 6A). There was evidence of an attempted switch to glycolysis, with increased polysome-associated mRNAs encoding Pfkfb3 and glycolytic proteins Hk2, Slc2a1, and Ldha (Fig. 6B). Normal neurons preferentially use the pentose phosphate pathway, suppressing glycolysis through inhibition of Pfkfb3 (39). Increased Pfkfb3 activity and a switch to glycolysis contribute to neurodegeneration (40).
Neurodegeneration is characterized by endoplasmic reticulum (ER) stress and induction of the UPR (41). We observed increased mRNAs encoding proteins involved in the protein kinase RNA-like endoplasmic reticulum (PERK) UPR pathway and proteins induced by PERK activation (Fig. 6C). Assessed by qPCR, there was increased Grp78/Bip, which triggers the UPR, as well as Atf4 and Herpud1, at 3 wk (Fig. 6F). We also found evidence of the inositol-requiring enzyme 1 (IRE1) UPR pathway at 3 wk by qPCR: Xbp1 spliced isoform (Xbp1s) was increased without change in total Xbp1 mRNA (Fig. 6F). Finally, there was induction of Atf6, indicative of the third (ATF6) UPR pathway (Fig. 6C).
Polysome-associated mRNAs involved in glutathione synthesis were decreased (Fig. 6E), and heme oxygenase 1 (Hmox1) and sulfiredoxin 1 (Srxn1) were increased, indicative of oxidative stress (42). Prolonged UPR activation and oxidative stress can lead to apoptosis, consistent with overrepresentation of Ddit3/Chop, a mediator of apoptotic death in SN DA neurons (43). We observed increased translation of mRNAs associated with p53 and Jnk apoptotic pathways, particularly at 10 wk (Fig. 6 D and G). In sum, our results suggest that Tfr1-CKO DA neurons attempted to overcome axonal loss and cellular stress at 3 wk, but by 10 wk they committed to cell death.
Discussion
DA neurons offered a tractable and well-characterized system to investigate neuronal iron transport and how it might be involved in neurodegeneration. We used CKO mice to examine the roles of Fpn and Tfr1 in vivo. Others had proposed that inhibition of Fpn had a pathogenic role in PD (19), but DA neurons lacking Fpn did not show evidence of iron overload or dysfunction. Accordingly, many patients with FPN mutations have been identified (44) but have not been reported to have an increased frequency of neurodegenerative diseases.
Iron exported by FPN must be oxidized, generally by ceruloplasmin, to be loaded onto extracellular TF (8). Interestingly, patients deficient in ceruloplasmin have increased brain iron and neurological symptoms including parkinsonism (45). Importantly, iron accumulates in astrocytes in this disease and, at least early, neurons may be iron-starved, similar to ceruloplasmin-deficient mice (46). This observation suggests that sequestered iron is not available to neurons, even though it is increased locally. Iron insufficiency may also cause neurodegeneration in mice lacking iron regulatory protein 2 (IRP2) (47). Considering these observations suggesting that neuronal iron deficiency might be detrimental, we developed CKO mice lacking Tfr1 exclusively in DA neurons.
Tfr1-CKO mice failed to thrive after 7 wk and died by 12 wk, likely from inadequate oral intake similar to dopamine-deficient mice (48), although we did not exclude involvement of enteric DA neurons. Although 3-wk Tfr1-CKO mice were similar to CTR mice, they subsequently developed SNpc neurodegeneration. Dorsal striatal terminals disappeared first, followed by SNpc cell bodies and, later, VTA cell bodies. DA neurons elsewhere in the brain appeared to be spared. Tfr1-CKO mice had decreased dopamine synthesis rates and tissue monoamine levels in the dorsal and ventral striata and a heightened response to dopamine receptor agonists including l-DOPA. Our results suggested abnormalities in presynaptic and postsynaptic dopamine receptor responses consistent with selective nigrostriatal neurodegeneration and “murine parkinsonism” (29).
The polysome-associated RNA profile of ventral midbrain Tfr1-CKO DA neurons indicated that they were iron deficient. Preservation of Tfr1-CKO DA neurons outside the SNpc suggested that SN DA neurons were more dependent on Tfr1 for iron uptake or were particularly sensitive to iron deficiency, perhaps due to their unusually large metabolic needs (49). At 8 wk, mitochondria in SN DA neurons were enlarged and disrupted, similar to those observed in iron-deficient cardiomyocytes lacking Tfr1 (7). Mitochondrial autophagy appeared to be ineffective, because abnormal mitochondria were abundant, even though neurons should eliminate them promptly (50, 51). At the same age, VTA DA mitochondria appeared normal, suggesting that they suffered less damage or abnormal mitochondrial were effectively removed. We observed proteinaceous inclusions in processes of Tfr1-CKO DA neurons, similar to those reported in DA neurons lacking autophagy protein Atg7 (52) or mitochondrial transcription factor Tfam (53). We speculate that the inclusions might have arisen from damaged and aggregated mitochondria that were not cleared by mitophagy.
The most strongly up-regulated genes from Tfr1-CKO DA neurons were associated with axonal injury, consistent with distal to proximal degeneration, possibly due to metabolic failure in long processes. There was marked up-regulation of Pfkfb3, which is normally inhibited in neurons, and Hk2, which commits cells to glycolysis. However, neurons are unable to rely on glycolysis, and oxidative stress and neurodegeneration ensue (40, 54). Polysome-associated mRNAs encoding components of all UPR pathways were up-regulated in 3-wk Tfr1-CKO DA neurons, consistent with a cytoprotective response. However, by 10 wk, it appeared that Tfr1-CKO DA neurons had committed to cell death, likely due to prolonged ER and oxidative stress. We observed increased mRNA encoding BH3-only proteins activated downstream of Jnk and Jun in the initiation of neuronal apoptosis (55). This pathway is induced by axonal damage (56). We also observed increased p53, Puma, and Pmaip1/Noxa mRNAs, consistent with induction of that pathway (57), increased Foxo1, encoding a proapoptotic transcription factor implicated in neuronal loss (58), and Casp3, an effector of DA neuron death (59). Redd1/Ddit4, which is increased in postmortem samples from PD patients (60), was also increased at 10 wk in Tfr1-CKO DA neurons. Thus, cell death appeared to be characteristic of neurodegeneration.
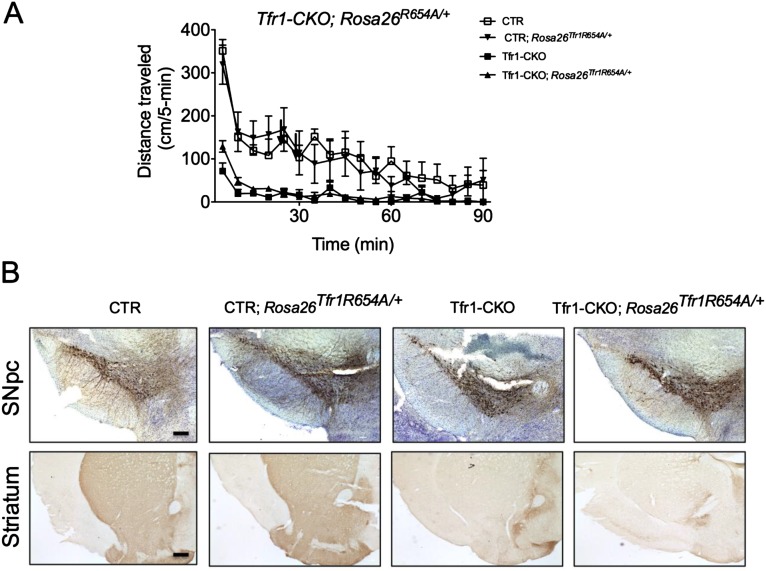
In a previous study, murine hippocampal neurons expressing dominant negative Tfr1 had markedly decreased iron associated with altered dendrite structure and delayed GABAergic maturation, but the authors did not report an increase in cell death (10). Mice lacking IRP2 developed lower motor neuron degeneration, raising the possibility that a lack of utilizable iron can cause the death of some types of neurons (47). However, other investigators have seen less severe (61) or no neurological phenotypes (62) in independent IRP2 KO strains. Thus, we could not conclude from the literature that iron deficiency causes neuronal cell death. Although our results indicate that loss of Tfr1 caused iron deficiency in ventral midbrain DA neurons, iron deficiency per se may not lead to the death of SNpc DA neurons. It remains possible that some other function of Tfr1 might also be involved. We (5) and others (63) have recently described roles of Tfr1 that do not involve iron uptake. However, transgenic expression of a missense mutant form of Tfr1 that cannot bind Tf (5, 64) did not rescue Tfr1-CKO mice (Fig. S7), indicating that the ability of Tfr1 to take up Tf is necessary for DA neuron survival.
Fig. S7.
Attempted rescue of Tfr1-CKO phenotype. (A) We observed no rescue of Tfr1-CKO locomotion when crossed with mice carrying a single Rosa26Tfr1R654A allele. We took advantage of Rosa26Tfr1R654A/+ mice that ubiquitously express an allele of Tfr1 carrying a missense mutation that precludes Tf binding (64). We bred to generate Tfr1-CKO mice carrying a single Rosa26Tfr1R654A allele (Tfr1-CKO; Rosa26Tfr1R654A/+). We performed OF testing at 7 wk of age. RM univariate comparison between genotypes was found to be highly significant [F(3,19) = 12.980, P < 0.001]. Examination of Bonferroni comparisons revealed that the Tfr1-CKO and Tfr1-CKO; Rosa26Tfr1R654A/+ results were significantly different compared from CTR and CTR; Rosa26Tfr1R654A/+ results (P < 0.006). However, neither CTR and CTR; Rosa26Tfr1R654A/+ results, nor Tfr1-CKO and Tfr1-CKO; Rosa26Tfr1R654A/+ results differed significantly between each other, respectively (P = 1). Tfr1-CKO n = 10, Tfr1-CKO; Rosa26Tfr1R654A/+ n = 14, CTR n = 11, CTR; Rosa26Tfr1R654A/+ n = 7. (B) Anti-Th immunostaining of the SN and striatum at 8 wk of age. (Upper) Representative images from SNpc. Nissl staining was used to visualize cell bodies. (Lower) Representative images from the striatum. (Scale bars, 100 μm.)
Taking into account reports suggesting that iron deficiency predisposes to human PD (20–22) and that iron overload is protective (23–25), we speculate that iron deficiency in DA neurons might contribute to PD pathogenesis. Functional iron deficiency in SNpc neurons could result from impaired iron uptake, as in our mice, or from trapping of iron in damaged mitochondria or protein aggregates, making it unavailable for use. Cellular iron deficiency can lead to loss of activity of oxidative phosphorylation complexes I to IV in cells that are highly dependent on mitochondrial respiration (7), and impaired oxidative phosphorylation may contribute to PD (65). Oxidative stress, defective mitochondrial quality control, impaired proteostasis, and the UPR, all observed in our mice, also appear to be important in PD. Interestingly, TFR1 has been identified in computational interaction networks for PD (66, 67).
Exposure to high levels of manganese causes a disorder similar to PD (68). Manganese can substitute for iron in holo-TF (69), and neurons can take up Mn-TF through receptor-mediated endocytosis (70). Manganese perturbs cellular iron homeostasis, resulting in an iron-deficient cellular phenotype (71), but it is not known whether this contributes to the clinical picture of manganism.
Considering that TFR1 is essential for the survival of and iron assimilation into DA neurons, one might expect to observe variants in TFR1 in patients with DA neurodegeneration. However, severe loss-of-function mutations are likely to be lethal before birth (3) and have not been described in humans. Interestingly, SNCA and DNAJC13, mutated in patients with PD, modulate TFR1 trafficking (72–74). VPS35, another PD disease gene, helps sort TFR1 to recycling endosomes, and insufficiency of its retromer complex causes cellular iron deficiency (75). RAB5B, which interacts with PD protein LRRK2, is also involved in endosomal trafficking of TFR1 (76, 77).
Tfr1-CKO mice, lacking Tfr1 exclusively in DA neurons, represent an extreme situation that would not occur naturally. However, insights from our studies may be relevant to PD and other neurodegenerative diseases characterized by disrupted iron homeostasis. Decreased activity of TFR1 may contribute to neurodegeneration in Huntington’s disease (78). Creuztfeldt-Jakob disease was recently reported to involve neuronal iron deficiency, apparently due to sequestration of the iron storage protein ferritin in prion aggregates (79). Additional work will be needed to better understand the possible role of iron deficiency in neurodegenerative disorders. However, our results already suggest that therapeutic chelation strategies should be used with caution in PD until their consequences are better understood.
Materials and Methods
Animals.
Experiments were performed on F2 mice of similar mixed backgrounds. Floxed 129Sv Fpn (27) or Tfr1 (5) mice were crossed with C57BL/6 DatIRESCre mice (26) to generate Fpn-CKO and Tfr1-CKO mice. Littermates were used to control for the mixed background. No differences were seen between sexes, and both were used. Fpn-CKO and Tfr1-CKO mice were born in Mendelian ratios. Ribotag transgenic mice (B6N.129-Rpl22tm1.1Psam/J; stock no: 011029) (28) were obtained from Jackson Laboratory. mtYFP mice were kindly provided by Nils-Göran Larsson (Max Planck Institute, Cologne, Germany) (32). The Duke Institutional Animal Care and Use Committee approved all animal studies.
Stereology.
Immunolabeling with anti-Th or anti-Ddc antibody and cresyl violet (Nissl) counterstaining was performed on every fourth 30-μm section through the SNpc [stereotaxic coordinates Bregma, −3.88 to −2.54 mm (80)] as previously described (81). At least seven tissue sections were counted per mouse. Four tissue sections were used to count DA neurons in the VTA (Bregma, −3.52 to −3.08 mm). Four or more mice were used per genotype at each time point. Unbiased stereological analysis was performed using the optical fractionator method with Stereo Investigator software 11 (MBF Bioscience) on a Zeiss AxioImager2 microscope. Counting was performed at 63× by an investigator blinded to genotypes. Additional parameters are detailed in SI Materials and Methods.
Immunoprecipitation of Polysomes from DA Neurons.
Immunoprecipitation of polysomes from DA neurons in ventral midbrain homogenates was performed as previously described (28) and as detailed in SI Materials and Methods. We used 20–50 ng enriched RNA for microarray analysis and 20 ng for cDNA synthesis for qPCR analysis.
Immunohistochemistry.
Anesthetized mice were transcardially perfused with 0.1 M PBS/4% (vol/vol) paraformaldehyde [32% (wt/vol) stock]. Tissues were postfixed for 12–16 h and cryoprotected in 30% (wt/vol) sucrose-PBS. Frozen tissue sections were cut serially to 30-μm thickness. Free-floating sections were washed with TBS (0.1 M Tris HCl, pH 7.4, and 0.1 M NaCl). To block endogenous peroxidase activity, tissues were washed with TBS/10% (vol/vol) hydrogen peroxide/10% (vol/vol) methanol and blocked in PBS/5% (vol/vol) normal goat serum/0.25% Triton X-100. Sections were then incubated for 48 h with anti-Th antibody, (1:1,000 striatum, 1:2,000 SN; Calbiotech 657012). Following incubation, the sections were washed twice with TBS, incubated for 2 h with biotinylated anti-rabbit secondary antibody and ABC reagent (Vecta Shield Kit; Vector Labs), and then washed three times in TBS before development with DAB and mounting. Nissl staining was performed using standard procedures. The density of Th immunostaining in the striatum was quantified using ImageJ (rsbweb.nih.gov/ij/). Every fourth section across the striatum from Bregma 1.18 to 0.70 mm was processed. At least four mice were used per genotype at each time point. Images were taken on a Zeiss Axio Imager microscope at the Duke Microscopy Core Facility.
For immunofluorescence imaging in Fig. 5 G and H, free-floating sections were blocked for 1 h at room temperature in 10% (vol/vol) donkey serum and 0.1% Triton X-100 and then incubated with anti-GFP antibody (1:400; Calbiochem) for 2 h at room temperature. Sections were then washed with a PBS-0.1% Triton X-100 solution for 5 min and subjected to three 5-min washes with PBS, followed by 1-h incubation (1:1,000) at room temperature with Alexa 488 secondary antibody (Jackson Immuno Research Labs). Tissues were mounted on glass slides and fixed with DAPI-containing Fluoro Shield solution (Calbiochem). Images were taken on a Leica SP5 confocal microscope at 200× magnification.
Electron Microscopy and Immunogold Labeling.
Anesthetized mice were transcardially perfused with 1 g/kg of diethyl-dithiocarbamate followed by 5% (vol/vol) glutaraldehyde [25% (wt/vol) stock] and 0.4% sodium metabisulfite in 0.1 M sodium phosphate buffer. Brains were postfixed in 2% (vol/vol) paraformaldehyde [32% (wt/vol) stock] and sectioned on a vibratome at 50 nm. Sections were treated with 1% sodium borohydride and blocked with 3% (vol/vol) normal goat serum. Sections were treated overnight at 4 °C with rat anti-DAT antibody (Millipore) and processed by a pre-embedding immunogold-silver method. Sections were prepared for electron microscopy using standard methods (82), examined on an FEI Morgagni transmission electron microscope, and photographed using an XP-60 digital camera (Advanced Microscopy Techniques). Detailed methods are described in SI Materials and Methods.
qPCR.
cDNA was prepared using High Capacity cDNA RT (Applied Biosciences) from 20 to 50 ng RNA either from input or enriched samples. qPCR was performed using SYBR green (IQ SYBR green Supermix; Biorad) on a Biorad C1000 Touch Thermal Cycler using primers shown in Table S3. mRNA expression was calculated using the ΔΔCt method and normalized to β-actin.
Table S3.
PCR primers (sequences are 5′ to 3′ by convention)
| Gene | 5′ | 3′ |
| Fpn | TTG CAG GAG TCA TTG CTG CTA | TGG AGT TCT GCA CAC CAT TGA T |
| Fth | CCA TCA ACC GCC AGA TCA AC | GCC ACA TCA TCT CGG TCA AA |
| Ftl | GGG CCT CCT ACA CCT ACC TC | CTC CTG GGT TTT ACC CCA TT |
| Slc11a2+IRE | TGT TTG ATT GCA TTG GGT CTG | CGC TCA GCA GGA CTT TCG AG |
| Tfr1 ex2,3 | TCA AGC CAG ATC AGC ATT CTC | AGC CAG TTT CAT CTC CAC ATG |
| Tfr1 ex16,17 | GCT GCA TAT CCT TTC CTT GC | ACC ATT TGG TTG AGC TGA GG |
| Bip/Grp78 | TCA TCG GAC GCA CTT GGA A | CAA CCA CCT TGA ATG GCA AGA |
| Atf4 | GAG CTT CCT GAA CAG CGA AGT G | TGG CCA CCT CCA GAT AGT CAT C |
| Herpud1 | CAT GTA CCT GCA CCA CGTCG | GAG GAC CAC CAT CAT CCG G |
| Xbps1 | AAG AAC ACG CTT GGG AAT GG | CTG CAC CTG CTG CGG AC |
| Xbp1 total | GAC AGA GAG TCA AAC TAA CGT GG | GTC CAG CAG GCA AGA AGG T |
| Trp53 | AAC AGA TCG TCC ATG CAG TG | TCT CCG AAG ACT GGA TGA CT |
| Puma | AGA GAT TGT ACA TGA CCC TCC A | GAC CTC AAC GCG CAG TA |
| β-actin | AGT GTG ACG TTG ACA TCC GTA | GCC AGA GCA GTA ATC TCC TTC T |
| Th | CAG AGT TGG ATA AGT GTC ACC AC | GGG TAG CAT AGA GGC CCT TCA |
| Dat | CGG GCA GTT CAA CAG AGA AGG | GCC CAC GTA GAA AGA GAT GAG G |
| Cnp | ACG AGT GCA AGA CGC TAT TC | CCG CTC GTG GTT GGT ATC |
| Gstm4 | GTC TTC ATG TAA GCA GAG ATC CTC | ACC TGC ACC TTA TAT TCG AAC C |
| Hmox1 | GTC AAG CAC AGG GTG ACA GA | ATC ACC TGC AGC TCC TCA AA |
| Srxn1 | TGA TCC AGA GGA CGT CGA T | GCA CAA CGT ACC AAT CGC |
| Glut1 | GGG CAT GTG CTT CCA GTA TGT | ACG AGG AGC ACC GTG AAG AT |
| Hk2 | ATC TGT AGC TTG TCC ATG AAG T | GAA CCA GAT CTA CGC CAT TCC |
| Pfkfb3 | TCA TGG CTT CCT CAT TGT CAG | ACT CGC TAC CTC AAC TGG ATA |
| Sprr1a | GGA CTC ATA AGC AGG ATA GAC AG | AGC AGA AGA CAA AGC AGA AGT |
| Ecel1 | TCT TCT CAC TCT CCT CGT CTT | CGC TCT TCT CGC TTA CAG TC |
| Mmp12 | GCT CCT GCC TCA CAT CAT AC | GGC TTC TCT GCA TCT GTG AA |
| Atf3 | CGA AGA CTG GAG CAA AAT GAT G | CAG GTT AGC AAA ATC CTC AAA TAC |
| Chac1 | GTA CGG CTC CCT AGT GTG GA | GCT CCC CTC GAA CTT GGT AT |
| Phgdh | CAT AGC CTA CAG TCT TCA TTC CA | AGC TTC GAT GAA AGA TGG CA |
| Sox11 | CCA TCA AAG AAA CCA AAG CCA T | CAA TGA GAT ACG AGT GGA GAG G |
| Ldha | CCC TTG AGT TTG TCT TCC ATG A | CTC CCC AGA ACA AGA TTA CAG T |
| Atf5 | TCC ACC CGC TCA GTC AT | GCT CGT AGA CTA TGG GAA ACT C |
| Atf6 | CTT TAT CAT CCG CTG CTG TCT | CCG TGA CTA AAC CTG TTC TAC A |
| Ddit3/Chop | GAC TCA GCT GCC ATG ACT G | GCG ACA GAG CCA GAA TAA CAG |
| Ero1l | CTC AGA ATA CTT GTA GCT CGC A | GTG TGG AAG AAG AGA CTG TGC |
| Ppp1r15a | GGA CAG GAG ATA GAA GTT GTG G | GAT CGC TTT TGG CAA CCA G |
| Stc2 | CTG CCT CCT TCA CAT CTT CC | GCT ATC TGA AGC ATG ACC TGT |
| Apaf1 | TTT CCT CTC GTT TGC TGA TCT | CAC GAA CTC AGT CAA CCA CT |
| Bcl2l11/Bim | CCA TAC CAG ACG GAA GAT AAA GC | GAC GAG TTC AAC GAA ACT TAC AC |
| Bnip3 | CCA ATC CCA TAT CCA ATC TGA GT | ACC ACA AGA TAC CAA CAG AGC |
| Casp3 | GGA CTG GAT GAA CCA CGA C | GAC TGA TGA GGA GAT GGC TTG |
| Ddit4 | GAG GAA GAG GAG GAC GAG AA | TTG TCC GCA ATC TTC GCT |
| Hrk | CCA TCA GCT CTT TAC AAT TCT GC | GGA CCG AGC AAC AGG TT |
| Jun | GAG CAC TAC AGA AGC AAT CTA CA | GCA TGG ACC TAA CAT TCG ATC T |
| Pmaip1 | CCC AGA TTG GGG ACC TTA GT | AGT TAT GTC CGG TGC ACT CC |
| Ggt1 | CCA GCT CAT AAC CAC GGA TT | GCC AAT ACC ACC ATG TTC AAC |
| Gpx3 | CCC AGA ATG ACC AAG CCA A | GCA GTA TGC AGG CAA ATA TAT CC |
| Gpx7 | GGT CCA CTA GGT ACT TCC AGA | CAT GTT TAG CAA GAT CGC AGT C |
| Gstm6 | CGG CTG GTC TTC ATA TAG GC | TGT CCT TGA TCA GCA TCG AAT |
| Gstt2 | TCA GGT AAA TCA AGA TGG CTG T | GCA TCC CCT TCC AGA CG |
| Tnfrs12a | TCT CCA CCA GTC TCC TCT ATG | CTT AGT CTG GTC CTG GTT TTG G |
Microarray Analysis.
RNA was extracted using an RNA isolation kit (Qiagen) according to the manufacturer’s instructions. Samples were treated with DNase I (Qiagen) to remove genomic DNA. Microarray analysis was performed using Mouse Expression Array 430A 2.0 (Affymetrix). RNA quality control, hybridization, and data analysis were performed by the Duke University Microarray Shared Resource. Data were analyzed using Partek Genomics Suite 6.5 (Partek). Robust multichip analysis (RMA) normalization was done on the entire dataset. Multiway ANOVA and fold-change were assessed to identify genes differentially expressed between CTR-Ribotag (Tfr1fl/+ CRE; Rpl22+/−) and Tfr1-CKO Ribotag (Tfr1fl/fl CRE; Rpl22+/−) mice. Differentially expressed genes were selected with a P value cutoff of 0.05 based on the ANOVA test and a fold-change cutoff of 2. The full microarray dataset has been deposited online (NCBI accession no. GSE66730).
Statistical Analysis.
Data are presented as means ± SEM and were analyzed with GraphPad Prism 6 for Student’s t test and by repeated-measures ANOVA (RMANOVA) using the IBM SPSS Statistics programs. Further details are provided in Table S1. A log-rank test was used for survival curve comparisons. P < 0.05 was considered significant.
SI Materials and Methods
Animals.
Red fluorescent protein (RFP; B6;129S6-GtROSA26Sortm14(CAG-tdTomato)Hze/J; stock no: 007908) transgenic mice were obtained from Jackson Labs. Rosa26Tfr1R654A/+ mice, which ubiquitously express an allele of Tfr1 carrying a missense mutation that precludes Tf binding, were developed in our laboratory (5, 64).
Behavioral testing and neurochemistry were performed in the Duke Mouse Behavioral and Neuroendocrine Analysis Core Facility. Mice were placed into an OF (AccuScan Instruments), and their locomotor activities were monitored for more than 1 h under 350-lx illumination using VersaMax software (AccuScan Instruments). In experiments with methamphetamine, apomorphine, or SKF-81297 (Sigma-Aldrich), baseline activity was monitored for 1 h, and mice were injected intraperitoneally with the drug and were returned immediately to the OF for 2 h. To examine responses to L-DOPA, mice were given carbidopa to block peripheral metabolism of L-DOPA and then were administered this monoamine 10 min later. For quinpirole assessment, mice were placed into the OF and given the drug 15 min later. Neurophysiological screening of mice and additional behavioral testing for akinesia and catalepsy have been previously described (29).
Catecholamine and Metabolite Measurements.
The frontal cortex, dorsal striatum, ventral striatum, hippocampus, and olfactory bulb were dissected and were stored at −80 °C until analyzed using modified previously reported methods (83). Tissue lysates were prepared in ice-cold 0.1 M HClO4 with 100 pg/μL isoproterenol, an internal standard, and were passed through 0.22-μm filters (Millipore). The Coulochem III HPLC system with 5014B analytical and 5020 guard cells (ESA) was used for analysis. Potential for guard cell and first analytical and second analytical electrodes were set at +0.380, −0.15, and +0.35 mV, respectively. Separation was achieved at 22 °C on a MD-150 C18 150 × 3.2-mm column with a 0.55-mL/min mobile phase containing 90 mM sodium dihydrogen phosphate, 50 mM citric acid, 1.7 mM 1-octane sulfonic acid sodium salt, 50 μM EDTA, and 9.5% (vol/vol) acetonitrile (pH 3). Peak areas were measured using EZChrom Elite Version 3.2 (Agilent Technologies).
l-DOPA Synthesis Rates.
l-DOPA synthesis rates were determined as previously described (84) by measuring accumulation of L-DOPA following i.p. administration of 100 mg/kg 3-hydroxybenzylhydrazine (NSD-1015; Sigma-Aldrich). Tissue samples were obtained 60 min after injection, and L-DOPA was measured using HLPC-electrochemical detection (see above).
Immunoprecipitation of Polysomes from DA Neurons.
Approximately 20 mg ventral midbrain was homogenized at 4 °C using a 7-mL Dounce homogenizer with 1 mL supplemented homogenization buffer until no large pieces remained. The foam was allowed to settle for ∼10 min, and the homogenate was then transferred into a microcentrifuge tube and centrifuged for 10 min at 10,000 rpm at 4 °C (Eppendorf 5430 R, rotor FA-45-30-11). Fifty microliters of supernatant was collected for the input sample, snap-frozen with liquid N2, and stored at −80 °C; 3.5 μL anti-HA antibody (Covance MMS-101R) was added to 800 μL lysate and rotated for 4 h at 4 °C, and 200 μL magnetic bead slurry was used per sample (Dynabeads Protein G; Life Technologies; 10004D). Magnetic beads were first washed twice with homogenization buffer at 4 °C, and then 800 μL antibody-tissue lysate was added to the beads. Samples were incubated for 21 h at 4 °C on a rotator. Next, the supernatant was removed, and beads were washed with 800 μL high salt buffer three times at 4 °C on a rotator for 5 min. Thirty microliters of RNA lysis buffer was added to the beads, and the mixture was vortexed for 30 s (RNeasy Plus Micro Kit). Samples were snap frozen in liquid N2 and stored at −80 °C until assayed.
Immunohistochemistry.
For immunofluorescence imaging in Fig. S5, tissue sections from a 7-wk CTR mouse were first incubated with a primary anti-RFP antibody (Rockland) at 1:1,000 for 6 h at 4 °C and then an Alexa 594 secondary antibody (Jackson Immuno Research Labs) was applied at 1:800 for 2 h at room temperature.
Immunoblots.
Immunoblots were performed using standard methods under reducing conditions using the following antibodies: anti-DOPA decarboxylase (ab3905, 1:1,000; Abcam), anti-Th (T1299, 1:1,000; Sigma), anti-PSD95 (ab12093, 1:1,000; Abcam), and anti–β-actin (A5316, 1:10,000; Sigma). Protein concentrations were determined by BCA assay (Thermo Scientific).
Stereology.
The average coefficient of error (Genderson m + 1) was 0.1. Additional stereology parameters were as follows: contour objective, 10×; counting objective, 63×/1.40 oil; cut thickness, 30 mm; average mounted thickness, 20 mm; guard zones, 2 mm; counting frame dimensions, 75 × 75 mm; dissector height, 16 mm; SRS grid (X), 394 mm; SRS grid (Y), 346 mm.
Electron Microscopy and Immunogold Labeling.
Anesthetized mice were transcardially perfused with 1 g/kg of diethyl-dithiocarbamate to chelate zinc (85), and then perfused through the aorta with heparinized saline and finally perfused with 5% (vol/vol) glutaraldehyde and 0.4% sodium metabisulfite in 0.1 M sodium phosphate buffer. Brains were postfixed in 2% (vol/vol) paraformaldehyde and sectioned on a vibratome at 50 nm. Sections were treated with 1% sodium borohydride to reduce excess aldehydes, rinsed in buffer (0.05 M Tris-buffered saline and 0.4% sodium metabisulfite, pH 7.6), and then placed in blocking solution to minimize nonspecific antibody binding: 3% (vol/vol) normal goat serum, 1% BSA in 0.1 M TBS (pH 7.6), and 0.04% Triton X-100. Sections were treated overnight at 4 °C with rat anti-DAT antibody (Millipore) diluted 1:1,000 in blocking solution. Tissue sections were processed by a pre-embedding immunogold-silver method. Tissue was rinsed with 0.01 M PBS after primary antibody incubation and then placed in a secondary blocking solution containing 0.8% BSA and 0.1% fish gelatin in 0.01 M PBS (pH 7.4). Sections were then placed overnight in 1-nm gold-conjugated goat anti-rat IgG (Amersham, GE Healthcare; RPN491) diluted 1:50. Sections were rinsed extensively in PBS, postfixed in 2% (vol/vol) glutaraldehyde for 10 min, and then rinsed again in PBS followed by 0.2 M sodium citrate buffer (pH 7.4). The size of bound gold particles was enhanced by a 15-min exposure to silver solution (Amersham, GE Healthcare). Sections were then prepared for electron microscopy using standard methods (82). Sections through the dorsal striatum were cut at 60 nm in serial order, collected on copper mesh grids, and counterstained with uranyl acetate and lead citrate. They were examined on an FEI Morgagni transmission electron microscope and photographed using an XP-60 digital camera (Advanced Microscopy Techniques). Micrographic images were adjusted in Adobe Photoshop CS5.1 for optimal brightness and contrast.
qPCR.
cDNA was prepared using High Capacity cDNA RT (Applied Biosciences) from 20 to 50 ng RNA either from input or enriched samples. qPCR was performed using SYBR green (IQ SYBR green Supermix; Biorad) on a Biorad C1000 Touch Thermal Cycler. mRNA expression was calculated using the ΔΔCt method and normalized to the relative expression of β-actin. Primers are shown in Table S3.
Acknowledgments
We thank Ramona Rodriguez for help with behavioral data analysis and statistics; the Duke Microarray Core facility (supported by National Institutes of Health Grant P30 CA014236) for microarray data ascertainment, management, and analysis; Neil Medvitz for electron microscopy; Kingshuk Roy Choudhury for statistical analysis; Nils-Göran Larsson for mtYFP mice; Tomasa Barrientos, Kristina Roberts, Karin Finberg, and Blake Stagg for assistance early in this project; Miquel Vila and Celine Perier for reviewing electron micrographs; Jim McNamara and Serge Przedborski for reviewing the manuscript; and the N.C.A. laboratory for helpful discussions. Some equipment and software was purchased with a grant from the North Carolina Biotechnology Center. This work was supported by National Institutes of Health Grant R01 DK089705 (to N.C.A.).
Footnotes
The authors declare no conflict of interest.
Data deposition: The microarray data reported in this paper have been deposited in the Gene Expression Omnibus (GEO) database, www.ncbi.nlm.nih.gov/geo (accession no. GSE66730).
See Commentary on page 3417.
This article contains supporting information online at www.pnas.org/lookup/suppl/doi:10.1073/pnas.1519473113/-/DCSupplemental.
References
- 1.Crichton RR, Dexter DT, Ward RJ. Brain iron metabolism and its perturbation in neurological diseases. J Neural Transm (Vienna) 2011;118(3):301–314. doi: 10.1007/s00702-010-0470-z. [DOI] [PubMed] [Google Scholar]
- 2.Snyder AM, Connor JR. Iron, the substantia nigra and related neurological disorders. Biochim Biophys Acta. 2009;1790(7):606–614. doi: 10.1016/j.bbagen.2008.08.005. [DOI] [PubMed] [Google Scholar]
- 3.Levy JE, Jin O, Fujiwara Y, Kuo F, Andrews NC. Transferrin receptor is necessary for development of erythrocytes and the nervous system. Nat Genet. 1999;21(4):396–399. doi: 10.1038/7727. [DOI] [PubMed] [Google Scholar]
- 4.Ned RM, Swat W, Andrews NC. Transferrin receptor 1 is differentially required in lymphocyte development. Blood. 2003;102(10):3711–3718. doi: 10.1182/blood-2003-04-1086. [DOI] [PubMed] [Google Scholar]
- 5.Chen AC, Donovan A, Ned-Sykes R, Andrews NC. Noncanonical role of transferrin receptor 1 is essential for intestinal homeostasis. Proc Natl Acad Sci USA. 2015;112(37):11714–11719. doi: 10.1073/pnas.1511701112. [DOI] [PMC free article] [PubMed] [Google Scholar]
- 6.Barrientos T, et al. Metabolic catastrophe in mice lacking transferrin receptor in muscle. EBioMedicine. 2015;2(11):1705–1717. doi: 10.1016/j.ebiom.2015.09.041. [DOI] [PMC free article] [PubMed] [Google Scholar]
- 7.Xu W, et al. Lethal cardiomyopathy in mice lacking transferrin receptor in the heart. Cell Reports. 2015;13(3):533–545. doi: 10.1016/j.celrep.2015.09.023. [DOI] [PMC free article] [PubMed] [Google Scholar]
- 8.Hentze MW, Muckenthaler MU, Andrews NC. Balancing acts: Molecular control of mammalian iron metabolism. Cell. 2004;117(3):285–297. doi: 10.1016/s0092-8674(04)00343-5. [DOI] [PubMed] [Google Scholar]
- 9.Rouault TA. Iron metabolism in the CNS: Implications for neurodegenerative diseases. Nat Rev Neurosci. 2013;14(8):551–564. doi: 10.1038/nrn3453. [DOI] [PubMed] [Google Scholar]
- 10.Fretham SJ, et al. Temporal manipulation of transferrin-receptor-1-dependent iron uptake identifies a sensitive period in mouse hippocampal neurodevelopment. Hippocampus. 2012;22(8):1691–1702. doi: 10.1002/hipo.22004. [DOI] [PMC free article] [PubMed] [Google Scholar]
- 11.Hill JM, Ruff MR, Weber RJ, Pert CB. Transferrin receptors in rat brain: Neuropeptide-like pattern and relationship to iron distribution. Proc Natl Acad Sci USA. 1985;82(13):4553–4557. doi: 10.1073/pnas.82.13.4553. [DOI] [PMC free article] [PubMed] [Google Scholar]
- 12.Hentze MW, Muckenthaler MU, Galy B, Camaschella C. Two to tango: Regulation of mammalian iron metabolism. Cell. 2010;142(1):24–38. doi: 10.1016/j.cell.2010.06.028. [DOI] [PubMed] [Google Scholar]
- 13.Schneider SA, Bhatia KP. Syndromes of neurodegeneration with brain iron accumulation. Semin Pediatr Neurol. 2012;19(2):57–66. doi: 10.1016/j.spen.2012.03.005. [DOI] [PubMed] [Google Scholar]
- 14.Dexter DT, et al. Increased nigral iron content and alterations in other metal ions occurring in brain in Parkinson’s disease. J Neurochem. 1989;52(6):1830–1836. doi: 10.1111/j.1471-4159.1989.tb07264.x. [DOI] [PubMed] [Google Scholar]
- 15.Gorell JM, et al. Increased iron-related MRI contrast in the substantia nigra in Parkinson’s disease. Neurology. 1995;45(6):1138–1143. doi: 10.1212/wnl.45.6.1138. [DOI] [PubMed] [Google Scholar]
- 16.Riederer P, et al. Transition metals, ferritin, glutathione, and ascorbic acid in parkinsonian brains. J Neurochem. 1989;52(2):515–520. doi: 10.1111/j.1471-4159.1989.tb09150.x. [DOI] [PubMed] [Google Scholar]
- 17.Morris CM, Edwardson JA. Iron histochemistry of the substantia nigra in Parkinson’s disease. Neurodegeneration. 1994;3(4):277–282. [PubMed] [Google Scholar]
- 18.Oakley AE, et al. Individual dopaminergic neurons show raised iron levels in Parkinson disease. Neurology. 2007;68(21):1820–1825. doi: 10.1212/01.wnl.0000262033.01945.9a. [DOI] [PubMed] [Google Scholar]
- 19.Lei P, et al. Tau deficiency induces parkinsonism with dementia by impairing APP-mediated iron export. Nat Med. 2012;18(2):291–295. doi: 10.1038/nm.2613. [DOI] [PubMed] [Google Scholar]
- 20.Savica R, et al. Anemia or low hemoglobin levels preceding Parkinson disease: A case-control study. Neurology. 2009;73(17):1381–1387. doi: 10.1212/WNL.0b013e3181bd80c1. [DOI] [PMC free article] [PubMed] [Google Scholar]
- 21.Logroscino G, Chen H, Wing A, Ascherio A. Blood donations, iron stores, and risk of Parkinson’s disease. Mov Disord. 2006;21(6):835–838. doi: 10.1002/mds.20826. [DOI] [PubMed] [Google Scholar]
- 22.Mariani S, et al. Association between sex, systemic iron variation and probability of Parkinson’s disease. Int J Neurosci. 2016;126(4):354–360. doi: 10.3109/00207454.2015.1020113. [DOI] [PubMed] [Google Scholar]
- 23.Buchanan DD, Silburn PA, Chalk JB, Le Couteur DG, Mellick GD. The Cys282Tyr polymorphism in the HFE gene in Australian Parkinson’s disease patients. Neurosci Lett. 2002;327(2):91–94. doi: 10.1016/s0304-3940(02)00398-1. [DOI] [PubMed] [Google Scholar]
- 24.Pichler I, et al. PD GWAS Consortium International Parkinson’s Disease Genomics Consortium Wellcome Trust Case Control Consortium 2 Genetics of Iron Status Consortium Serum iron levels and the risk of Parkinson disease: A Mendelian randomization study. PLoS Med. 2013;10(6):e1001462. doi: 10.1371/journal.pmed.1001462. [DOI] [PMC free article] [PubMed] [Google Scholar]
- 25.Xia J, Xu H, Jiang H, Xie J. The association between the C282Y and H63D polymorphisms of HFE gene and the risk of Parkinson’s disease: A meta-analysis. Neurosci Lett. 2015;595:99–103. doi: 10.1016/j.neulet.2015.04.010. [DOI] [PubMed] [Google Scholar]
- 26.Bäckman CM, et al. Characterization of a mouse strain expressing Cre recombinase from the 3′ untranslated region of the dopamine transporter locus. Genesis. 2006;44(8):383–390. doi: 10.1002/dvg.20228. [DOI] [PubMed] [Google Scholar]
- 27.Donovan A, et al. The iron exporter ferroportin/Slc40a1 is essential for iron homeostasis. Cell Metab. 2005;1(3):191–200. doi: 10.1016/j.cmet.2005.01.003. [DOI] [PubMed] [Google Scholar]
- 28.Sanz E, et al. Cell-type-specific isolation of ribosome-associated mRNA from complex tissues. Proc Natl Acad Sci USA. 2009;106(33):13939–13944. doi: 10.1073/pnas.0907143106. [DOI] [PMC free article] [PubMed] [Google Scholar]
- 29.Sotnikova TD, et al. Dopamine-independent locomotor actions of amphetamines in a novel acute mouse model of Parkinson disease. PLoS Biol. 2005;3(8):e271. doi: 10.1371/journal.pbio.0030271. [DOI] [PMC free article] [PubMed] [Google Scholar]
- 30.Rensvold JW, et al. Complementary RNA and protein profiling identifies iron as a key regulator of mitochondrial biogenesis. Cell Reports. 2013;3(1):237–245. doi: 10.1016/j.celrep.2012.11.029. [DOI] [PMC free article] [PubMed] [Google Scholar]
- 31.Xu W, Barrientos T, Andrews NC. Iron and copper in mitochondrial diseases. Cell Metab. 2013;17(3):319–328. doi: 10.1016/j.cmet.2013.02.004. [DOI] [PMC free article] [PubMed] [Google Scholar]
- 32.Sterky FH, Lee S, Wibom R, Olson L, Larsson NG. Impaired mitochondrial transport and Parkin-independent degeneration of respiratory chain-deficient dopamine neurons in vivo. Proc Natl Acad Sci USA. 2011;108(31):12937–12942. doi: 10.1073/pnas.1103295108. [DOI] [PMC free article] [PubMed] [Google Scholar]
- 33.Mootha VK, et al. PGC-1alpha-responsive genes involved in oxidative phosphorylation are coordinately downregulated in human diabetes. Nat Genet. 2003;34(3):267–273. doi: 10.1038/ng1180. [DOI] [PubMed] [Google Scholar]
- 34.Subramanian A, et al. Gene set enrichment analysis: A knowledge-based approach for interpreting genome-wide expression profiles. Proc Natl Acad Sci USA. 2005;102(43):15545–15550. doi: 10.1073/pnas.0506580102. [DOI] [PMC free article] [PubMed] [Google Scholar]
- 35.Laplante M, Sabatini DM. mTOR signaling in growth control and disease. Cell. 2012;149(2):274–293. doi: 10.1016/j.cell.2012.03.017. [DOI] [PMC free article] [PubMed] [Google Scholar]
- 36.Chung CY, et al. Cell type-specific gene expression of midbrain dopaminergic neurons reveals molecules involved in their vulnerability and protection. Hum Mol Genet. 2005;14(13):1709–1725. doi: 10.1093/hmg/ddi178. [DOI] [PMC free article] [PubMed] [Google Scholar]
- 37.Yasuda M, Tanaka Y, Ryu M, Tsuda S, Nakazawa T. RNA sequence reveals mouse retinal transcriptome changes early after axonal injury. PLoS One. 2014;9(3):e93258. doi: 10.1371/journal.pone.0093258. [DOI] [PMC free article] [PubMed] [Google Scholar]
- 38.Kanaan NM, et al. The longitudinal transcriptomic response of the substantia nigra to intrastriatal 6-hydroxydopamine reveals significant upregulation of regeneration-associated genes. PLoS One. 2015;10(5):e0127768. doi: 10.1371/journal.pone.0127768. [DOI] [PMC free article] [PubMed] [Google Scholar]
- 39.Herrero-Mendez A, et al. The bioenergetic and antioxidant status of neurons is controlled by continuous degradation of a key glycolytic enzyme by APC/C-Cdh1. Nat Cell Biol. 2009;11(6):747–752. doi: 10.1038/ncb1881. [DOI] [PubMed] [Google Scholar]
- 40.Rodriguez-Rodriguez P, Fernandez E, Almeida A, Bolaños JP. Excitotoxic stimulus stabilizes PFKFB3 causing pentose-phosphate pathway to glycolysis switch and neurodegeneration. Cell Death Differ. 2012;19(10):1582–1589. doi: 10.1038/cdd.2012.33. [DOI] [PMC free article] [PubMed] [Google Scholar]
- 41.Hetz C, Mollereau B. Disturbance of endoplasmic reticulum proteostasis in neurodegenerative diseases. Nat Rev Neurosci. 2014;15(4):233–249. doi: 10.1038/nrn3689. [DOI] [PubMed] [Google Scholar]
- 42.Hauser DN, Hastings TG. Mitochondrial dysfunction and oxidative stress in Parkinson’s disease and monogenic parkinsonism. Neurobiol Dis. 2013;51:35–42. doi: 10.1016/j.nbd.2012.10.011. [DOI] [PMC free article] [PubMed] [Google Scholar]
- 43.Silva RM, et al. CHOP/GADD153 is a mediator of apoptotic death in substantia nigra dopamine neurons in an in vivo neurotoxin model of parkinsonism. J Neurochem. 2005;95(4):974–986. doi: 10.1111/j.1471-4159.2005.03428.x. [DOI] [PMC free article] [PubMed] [Google Scholar]
- 44.Pietrangelo A, Caleffi A, Corradini E. Non-HFE hepatic iron overload. Semin Liver Dis. 2011;31(3):302–318. doi: 10.1055/s-0031-1286061. [DOI] [PubMed] [Google Scholar]
- 45.Miyajima H. 2015. Aceruloplasminemia. Neuropathology 35(1):83–90.
- 46.Jeong SY, David S. Age-related changes in iron homeostasis and cell death in the cerebellum of ceruloplasmin-deficient mice. J Neurosci. 2006;26(38):9810–9819. doi: 10.1523/JNEUROSCI.2922-06.2006. [DOI] [PMC free article] [PubMed] [Google Scholar]
- 47.Jeong SY, et al. Iron insufficiency compromises motor neurons and their mitochondrial function in Irp2-null mice. PLoS One. 2011;6(10):e25404. doi: 10.1371/journal.pone.0025404. [DOI] [PMC free article] [PubMed] [Google Scholar]
- 48.Zhou QY, Palmiter RD. Dopamine-deficient mice are severely hypoactive, adipsic, and aphagic. Cell. 1995;83(7):1197–1209. doi: 10.1016/0092-8674(95)90145-0. [DOI] [PubMed] [Google Scholar]
- 49.Pacelli C, et al. Elevated mitochondrial bioenergetics and axonal arborization size are key contributors to the vulnerability of dopamine neurons. Curr Biol. 2015;25(18):2349–2360. doi: 10.1016/j.cub.2015.07.050. [DOI] [PubMed] [Google Scholar]
- 50.Youle RJ, van der Bliek AM. Mitochondrial fission, fusion, and stress. Science. 2012;337(6098):1062–1065. doi: 10.1126/science.1219855. [DOI] [PMC free article] [PubMed] [Google Scholar]
- 51.Batlevi Y, La Spada AR. Mitochondrial autophagy in neural function, neurodegenerative disease, neuron cell death, and aging. Neurobiol Dis. 2011;43(1):46–51. doi: 10.1016/j.nbd.2010.09.009. [DOI] [PMC free article] [PubMed] [Google Scholar]
- 52.Friedman LG, et al. Disrupted autophagy leads to dopaminergic axon and dendrite degeneration and promotes presynaptic accumulation of α-synuclein and LRRK2 in the brain. J Neurosci. 2012;32(22):7585–7593. doi: 10.1523/JNEUROSCI.5809-11.2012. [DOI] [PMC free article] [PubMed] [Google Scholar]
- 53.Ekstrand MI, et al. Progressive parkinsonism in mice with respiratory-chain-deficient dopamine neurons. Proc Natl Acad Sci USA. 2007;104(4):1325–1330. doi: 10.1073/pnas.0605208103. [DOI] [PMC free article] [PubMed] [Google Scholar]
- 54.Bolaños JP, Almeida A, Moncada S. Glycolysis: A bioenergetic or a survival pathway? Trends Biochem Sci. 2010;35(3):145–149. doi: 10.1016/j.tibs.2009.10.006. [DOI] [PubMed] [Google Scholar]
- 55.Young JE, et al. Polyglutamine-expanded androgen receptor truncation fragments activate a Bax-dependent apoptotic cascade mediated by DP5/Hrk. J Neurosci. 2009;29(7):1987–1997. doi: 10.1523/JNEUROSCI.4072-08.2009. [DOI] [PMC free article] [PubMed] [Google Scholar]
- 56.Fernandes KA, Harder JM, Kim J, Libby RT. JUN regulates early transcriptional responses to axonal injury in retinal ganglion cells. Exp Eye Res. 2013;112:106–117. doi: 10.1016/j.exer.2013.04.021. [DOI] [PMC free article] [PubMed] [Google Scholar]
- 57.Perier C, et al. Two molecular pathways initiate mitochondria-dependent dopaminergic neurodegeneration in experimental Parkinson’s disease. Proc Natl Acad Sci USA. 2007;104(19):8161–8166. doi: 10.1073/pnas.0609874104. [DOI] [PMC free article] [PubMed] [Google Scholar]
- 58.Chuang CL, Lu YN, Wang HC, Chang HY. Genetic dissection reveals that Akt is the critical kinase downstream of LRRK2 to phosphorylate and inhibit FOXO1, and promotes neuron survival. Hum Mol Genet. 2014;23(21):5649–5658. doi: 10.1093/hmg/ddu281. [DOI] [PubMed] [Google Scholar]
- 59.Yamada M, Kida K, Amutuhaire W, Ichinose F, Kaneki M. Gene disruption of caspase-3 prevents MPTP-induced Parkinson’s disease in mice. Biochem Biophys Res Commun. 2010;402(2):312–318. doi: 10.1016/j.bbrc.2010.10.023. [DOI] [PMC free article] [PubMed] [Google Scholar]
- 60.Malagelada C, Jin ZH, Greene LA. RTP801 is induced in Parkinson’s disease and mediates neuron death by inhibiting Akt phosphorylation/activation. J Neurosci. 2008;28(53):14363–14371. doi: 10.1523/JNEUROSCI.3928-08.2008. [DOI] [PMC free article] [PubMed] [Google Scholar]
- 61.Zumbrennen-Bullough KB, et al. Abnormal brain iron metabolism in Irp2 deficient mice is associated with mild neurological and behavioral impairments. PLoS One. 2014;9(6):e98072. doi: 10.1371/journal.pone.0098072. [DOI] [PMC free article] [PubMed] [Google Scholar]
- 62.Galy B, et al. Altered body iron distribution and microcytosis in mice deficient in iron regulatory protein 2 (IRP2) Blood. 2005;106(7):2580–2589. doi: 10.1182/blood-2005-04-1365. [DOI] [PubMed] [Google Scholar]
- 63.Senyilmaz D, et al. 2015. Regulation of mitochondrial morphology and function by stearoylation of TFR1. Nature 525(7567):124–128.
- 64.Schmidt PJ, Toran PT, Giannetti AM, Bjorkman PJ, Andrews NC. The transferrin receptor modulates Hfe-dependent regulation of hepcidin expression. Cell Metab. 2008;7(3):205–214. doi: 10.1016/j.cmet.2007.11.016. [DOI] [PMC free article] [PubMed] [Google Scholar]
- 65.Shoffner JM, Watts RL, Juncos JL, Torroni A, Wallace DC. Mitochondrial oxidative phosphorylation defects in Parkinson’s disease. Ann Neurol. 1991;30(3):332–339. doi: 10.1002/ana.410300304. [DOI] [PubMed] [Google Scholar]
- 66.Liu Y, Koyutürk M, Maxwell S, Zhao Z, Chance MR. Integrative analysis of common neurodegenerative diseases using gene association, interaction networks and mRNA expression data. AMIA Jt Summits Transl Sci Proc. 2012;2012:62–71. [PMC free article] [PubMed] [Google Scholar]
- 67.Rakshit H, Rathi N, Roy D. Construction and analysis of the protein-protein interaction networks based on gene expression profiles of Parkinson’s disease. PLoS One. 2014;9(8):e103047. doi: 10.1371/journal.pone.0103047. [DOI] [PMC free article] [PubMed] [Google Scholar]
- 68.Racette BA. Manganism in the 21st century: The Hanninen lecture. Neurotoxicology. 2014;45:201–207. doi: 10.1016/j.neuro.2013.09.007. [DOI] [PMC free article] [PubMed] [Google Scholar]
- 69.Aisen P, Aasa R, Redfield AG. The chromium, manganese, and cobalt complexes of transferrin. J Biol Chem. 1969;244(17):4628–4633. [PubMed] [Google Scholar]
- 70.Suárez N, Eriksson H. Receptor-mediated endocytosis of a manganese complex of transferrin into neuroblastoma (SHSY5Y) cells in culture. J Neurochem. 1993;61(1):127–131. doi: 10.1111/j.1471-4159.1993.tb03546.x. [DOI] [PubMed] [Google Scholar]
- 71.Crooks DR, Ghosh MC, Braun-Sommargren M, Rouault TA, Smith DR. Manganese targets m-aconitase and activates iron regulatory protein 2 in AF5 GABAergic cells. J Neurosci Res. 2007;85(8):1797–1809. doi: 10.1002/jnr.21321. [DOI] [PubMed] [Google Scholar]
- 72.Ben Gedalya T, et al. Alpha-synuclein and polyunsaturated fatty acids promote clathrin-mediated endocytosis and synaptic vesicle recycling. Traffic. 2009;10(2):218–234. doi: 10.1111/j.1600-0854.2008.00853.x. [DOI] [PMC free article] [PubMed] [Google Scholar]
- 73.Chai YJ, et al. The secreted oligomeric form of α-synuclein affects multiple steps of membrane trafficking. FEBS Lett. 2013;587(5):452–459. doi: 10.1016/j.febslet.2013.01.008. [DOI] [PubMed] [Google Scholar]
- 74.Fujibayashi A, et al. Human RME-8 is involved in membrane trafficking through early endosomes. Cell Struct Funct. 2008;33(1):35–50. doi: 10.1247/csf.07045. [DOI] [PubMed] [Google Scholar]
- 75.Chen C, et al. Snx3 regulates recycling of the transferrin receptor and iron assimilation. Cell Metab. 2013;17(3):343–352. doi: 10.1016/j.cmet.2013.01.013. [DOI] [PMC free article] [PubMed] [Google Scholar]
- 76.Bucci C, et al. Co-operative regulation of endocytosis by three Rab5 isoforms. FEBS Lett. 1995;366(1):65–71. doi: 10.1016/0014-5793(95)00477-q. [DOI] [PubMed] [Google Scholar]
- 77.Trischler M, Stoorvogel W, Ullrich O. Biochemical analysis of distinct Rab5- and Rab11-positive endosomes along the transferrin pathway. J Cell Sci. 1999;112(Pt 24):4773–4783. doi: 10.1242/jcs.112.24.4773. [DOI] [PubMed] [Google Scholar]
- 78.Lumsden AL, Henshall TL, Dayan S, Lardelli MT, Richards RI. Huntingtin-deficient zebrafish exhibit defects in iron utilization and development. Hum Mol Genet. 2007;16(16):1905–1920. doi: 10.1093/hmg/ddm138. [DOI] [PubMed] [Google Scholar]
- 79.Singh A, Qing L, Kong Q, Singh N. Change in the characteristics of ferritin induces iron imbalance in prion disease affected brains. Neurobiol Dis. 2012;45(3):930–938. doi: 10.1016/j.nbd.2011.12.012. [DOI] [PMC free article] [PubMed] [Google Scholar]
- 80.Franklin BJ, Paxinos G. The Mouse Brain in Stereotaxic Coordinates. 3rd Ed Elsevier; San Diego: 2007. [Google Scholar]
- 81.Benner EJ, et al. Therapeutic immunization protects dopaminergic neurons in a mouse model of Parkinson’s disease. Proc Natl Acad Sci USA. 2004;101(25):9435–9440. doi: 10.1073/pnas.0400569101. [DOI] [PMC free article] [PubMed] [Google Scholar]
- 82.Sesack SR, Hawrylak VA, Matus C, Guido MA, Levey AI. Dopamine axon varicosities in the prelimbic division of the rat prefrontal cortex exhibit sparse immunoreactivity for the dopamine transporter. J Neurosci. 1998;18(7):2697–2708. doi: 10.1523/JNEUROSCI.18-07-02697.1998. [DOI] [PMC free article] [PubMed] [Google Scholar]
- 83.Gaier ED, et al. Peptidylglycine α-amidating monooxygenase heterozygosity alters brain copper handling with region specificity. J Neurochem. 2013;127(5):605–619. doi: 10.1111/jnc.12438. [DOI] [PMC free article] [PubMed] [Google Scholar]
- 84.Jones SR, et al. Profound neuronal plasticity in response to inactivation of the dopamine transporter. Proc Natl Acad Sci USA. 1998;95(7):4029–4034. doi: 10.1073/pnas.95.7.4029. [DOI] [PMC free article] [PubMed] [Google Scholar]
- 85.Veznedaroglu E, Milner TA. Elimination of artifactual labeling of hippocampal mossy fibers seen following pre-embedding immunogold-silver technique by pretreatment with zinc chelator. Microsc Res Tech. 1992;23(1):100–101. doi: 10.1002/jemt.1070230110. [DOI] [PubMed] [Google Scholar]


