Significance
The microbial community in the human gut represents one of the densest known ecosystems. Community composition has broad impacts on health, and metabolic competition and host selection have both been implicated in shaping these communities. Here, we report that contact-dependent bacterial antagonism also determines the ability of human gut symbionts to persist in the microbiome. Simplified microbiomes, assembled in gnotobiotic mice, reveal effector transmission rates exceeding 1 billion events per minute per gram of colonic contents. Together, these results suggest that human gut symbionts define their closest competitors not only metabolically but also spatially. Moreover, strains within a single species can encode diverse effectors that may provide new avenues for shaping the microbiome to improve human health.
Keywords: gut microbiome, microbial ecology, type VI secretion, symbiosis
Abstract
The human gut microbiome is a dynamic and densely populated microbial community that can provide important benefits to its host. Cooperation and competition for nutrients among its constituents only partially explain community composition and interpersonal variation. Notably, certain human-associated Bacteroidetes—one of two major phyla in the gut—also encode machinery for contact-dependent interbacterial antagonism, but its impact within gut microbial communities remains unknown. Here we report that prominent human gut symbionts persist in the gut through continuous attack on their immediate neighbors. Our analysis of just one of the hundreds of species in these communities reveals 12 candidate antibacterial effector loci that can exist in 32 combinations. Through the use of secretome studies, in vitro bacterial interaction assays and multiple mouse models, we uncover strain-specific effector/immunity repertoires that can predict interbacterial interactions in vitro and in vivo, and find that some of these strains avoid contact-dependent killing by accumulating immunity genes to effectors that they do not encode. Effector transmission rates in live animals can exceed 1 billion events per minute per gram of colonic contents, and multiphylum communities of human gut commensals can partially protect sensitive strains from these attacks. Together, these results suggest that gut microbes can determine their interactions through direct contact. An understanding of the strategies human gut symbionts have evolved to target other members of this community may provide new approaches for microbiome manipulation.
Interpersonal variation in gut microbial community composition, even at the species or strain level, can determine the contribution of these communities to cancer risk, drug metabolism, caloric extraction from diet, infectious disease resistance, and other responses (1–5). However, the rules that determine community membership, especially at the species or strain level, are largely undefined. The gut environment is characterized by constant peristalsis and extensive niche heterogeneity, and factors previously implicated in shaping these communities (metabolites, vitamins, dietary polysaccharides, host IgA, bacteriocins) are freely diffusible (6–8). In this context, the recent identification of genes encoding type VI secretion systems (T6SSs) in the genomes of many prominent human gut symbionts was unexpected because the ability of these dynamic machines to inject toxic effectors into adjacent cells is strictly dependent on direct cell-to-cell contact (9–12).
The T6SSs of Bacteroidetes share many subunits with those of Proteobacteria; these include the Hcp and TssB–TssC proteins, which interact and assemble into a contractile bacteriophage tail-like structure that is required for effector translocation from donor to recipient cells (9, 10). Bacteria with T6SSs lack a means for self-/non–self-discrimination; thus, sister cells inject one another with effectors. To nullify the antibacterial properties of these toxins, T6SS+ strains produce immunity proteins that directly bind cognate effectors. Despite our growing understanding of the mechanism and activity of T6S in vitro, little is known about the ecological role of this pathway in natural environments where direct encounters between microorganisms occur.
Here we report that the human gut symbiont Bacteroides fragilis NCTC 9343 (B. fragilisN) targets other members of the microbiome in a species- and strain-specific manner in the mammalian gut. We identify strain-specific effector/immunity (E/I) repertoires and show that the presence or absence of these genes can accurately predict interstrain dynamics in the gut. Furthermore, we combine microbial genetics, mathematical modeling, and gnotobiotic studies to determine the frequency of T6S-mediated events in live animals. Together, these results define a significant role for contact-mediated bacterial antagonism between human gut symbionts.
Results
Human Gut Symbionts Can Target Other Members of the Microbiome in Vivo.
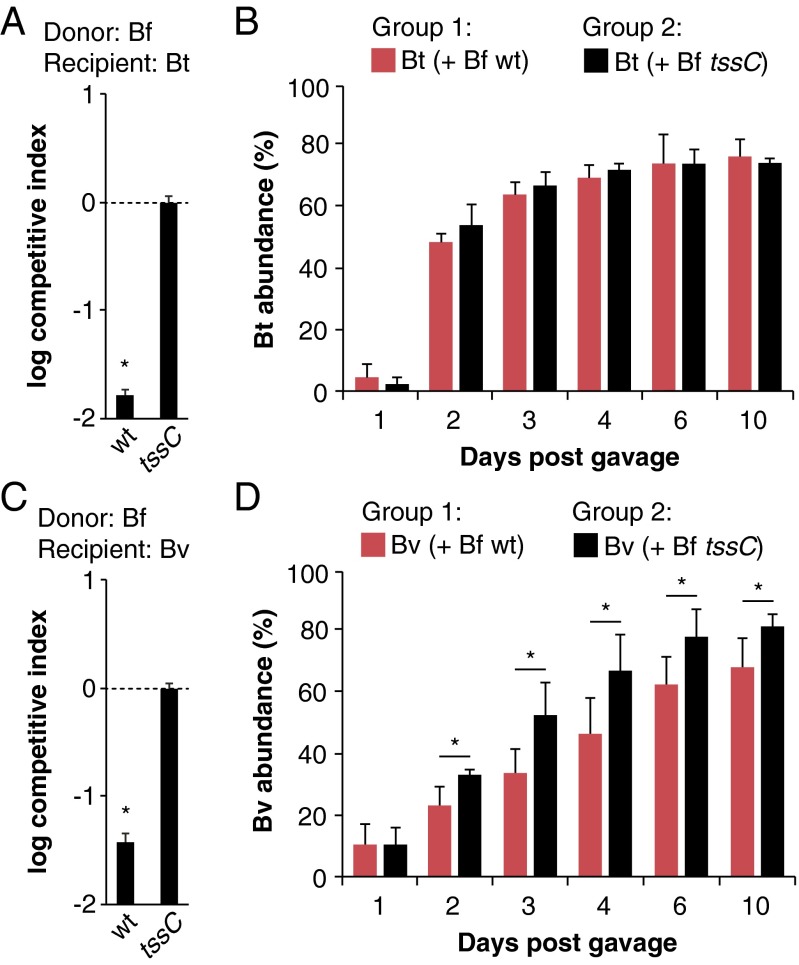
The human gut symbiont B. fragilisN (13) effectively kills the T6SS– human gut commensal Bacteroides thetaiotaomicron in a T6S-dependent manner in vitro (11). Whether B. fragilisN also targets B. thetaiotaomicron in the gut is unknown. To test this, we introduced B. fragilisN (wild type or a T6S-defective control lacking the gene encoding the T6SS sheath component TssC) and B. thetaiotaomicron into germ-free mice by oral gavage, and monitored the abundance of each strain in feces over time. Surprisingly, B. thetaiotaomicron colonization was not dependent on B. fragilisN T6SS status despite its susceptibility in vitro (Fig. 1 A and B). By contrast, the T6SS– human gut symbiont Bacteroides vulgatus, which is more closely related to B. fragilis based on whole-genome phylogeny (14), shows a moderate but significant degree of susceptibility to B. fragilisN T6S attacks in vivo that mirrors its susceptibility in vitro (Fig. 1 C and D). Together, these data demonstrate that different species within the human microbiome can engage in T6S-dependent antagonism in the mammalian gut, and suggest that certain susceptible species can avoid killing in vivo.
Fig. 1.
T6S antagonism in the gut is species-dependent. (A and B) B. thetaiotaomicron (Bt) is susceptible to B. fragilisN (Bf) T6S in vitro (A) but not in vivo (B). (C and D) B. vulgatus (Bv) is susceptible to B. fragilisN T6S both in vitro (C) and in vivo (D). For in vitro competitions (A and C), competitive index calculations are normalized to tssC controls and *P < 0.05. Error bars indicate ± SD (n = 2; representative of four independent trials). For gnotobiotic mouse studies (B and D), B. thetaiotaomicron or B. vulgatus was introduced into germ-free mice with WT (red bars) or tssC (black bars) B. fragilisN, and the abundance of each strain was determined by quantitative PCR using gDNA from fecal samples collected over time. *P < 0.05 between recipient populations in each group (n = 5 mice per group; representative of two independent trials); error bars indicate ± SD.
B. fragilis Strains Encode Extensive Variation in Effector/Immunity Repertoires.
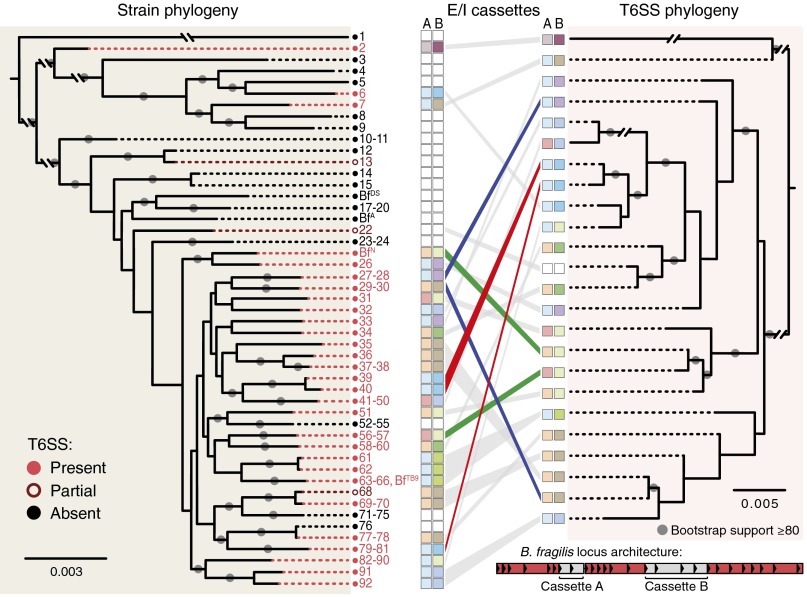
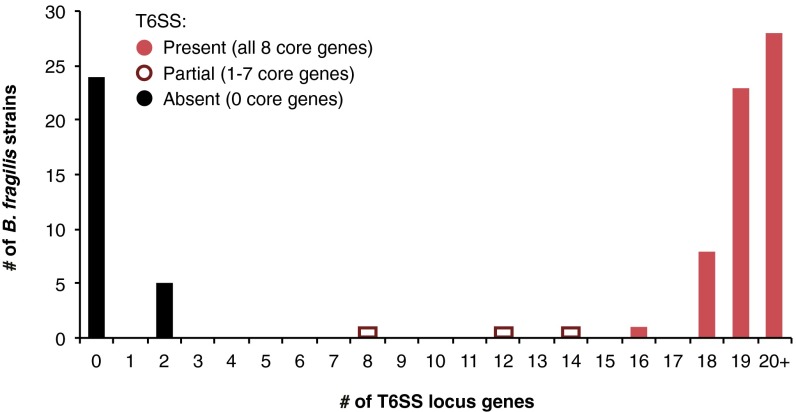
Based on these results, we reasoned that an important role for T6S in the gut could be to mediate interactions between close evolutionary relatives that share the same niche. We searched draft and complete genomes of all 92 sequenced strains of B. fragilis for homologs of eight core T6SS genes (Dataset S1, Tables S1 and S2). Notably, the distribution of T6SS machinery is highly variable within this species: only 60 of the 92 strains encode all eight core genes. Moreover, strain genome phylogeny is not congruent with T6SS core gene phylogeny, indicating limited ancestral inheritance and extensive horizontal gene transfer of T6SS variants across strains (Fig. 2 and Fig. S1). These core genes are located in ∼30-kb islands that are syntenic except for two variable regions (cassette A and cassette B) that encode Hcp proteins, PAAR-containing adaptor proteins, proteins with T6SS effector-like domains, and numerous hypothetical proteins (Fig. 2, Inset; Dataset S1, Table S3). Collectively, these B. fragilis strains harbor four distinct versions of cassette A and eight distinct versions of cassette B, which could exist in 32 possible combinations. The 60 T6SS-positive strains that have been sequenced represent 24 of these configurations (Fig. 2; Dataset S1, Table S3). Computational analysis of other Bacteroides genomes suggests these features are general (15).
Fig. 2.
Comparative genomic analysis of B. fragilis strains reveals multiple independent acquisitions of T6SS loci and numerous putative effector/immunity cassettes. Whole-genome phylogeny (Left) of all 92 sequenced B. fragilis strains (Dataset S1, Table S1) is linked to T6SS locus phylogeny (Right) by gray and colored lines. T6SS locus architecture is conserved across T6SS+ B. fragilis strains, revealing three conserved, syntenic regions (red shading) and two variable, nonsyntenic regions (gray shading) within each T6SS locus (Inset). Putative effector/immunity repertoires of nonsyntenic regions are depicted with colored boxes (Dataset S1, Table S3). The incongruence between the strain and T6SS phylogenetic trees indicate that most B. fragilis strains have acquired their T6SS through recent and independent horizontal transfer events. Examples of closely related strains acquiring distinct T6SSs (blue lines), distantly related strains acquiring similar T6SSs (red lines), and similar T6SSs encoding distinct putative E/I pairs (green lines) are shown.
Fig. S1.
B. fragilis strains carrying partial T6SS loci are rare. The presence of homologs of BF9343_1943-18 (excluding bte1/bti1 and bte2/bti2ab) in each of 92 sequenced B. fragilis genomes was determined using an E-value cutoff of 0.0001, a percent identity cutoff of 50, and a percent coverage cutoff of 50 (SI Materials and Methods). The paucity of genomes carrying partial T6SSs suggests that once an essential T6SS gene is mutated or lost, the rest of the locus is no longer maintained.
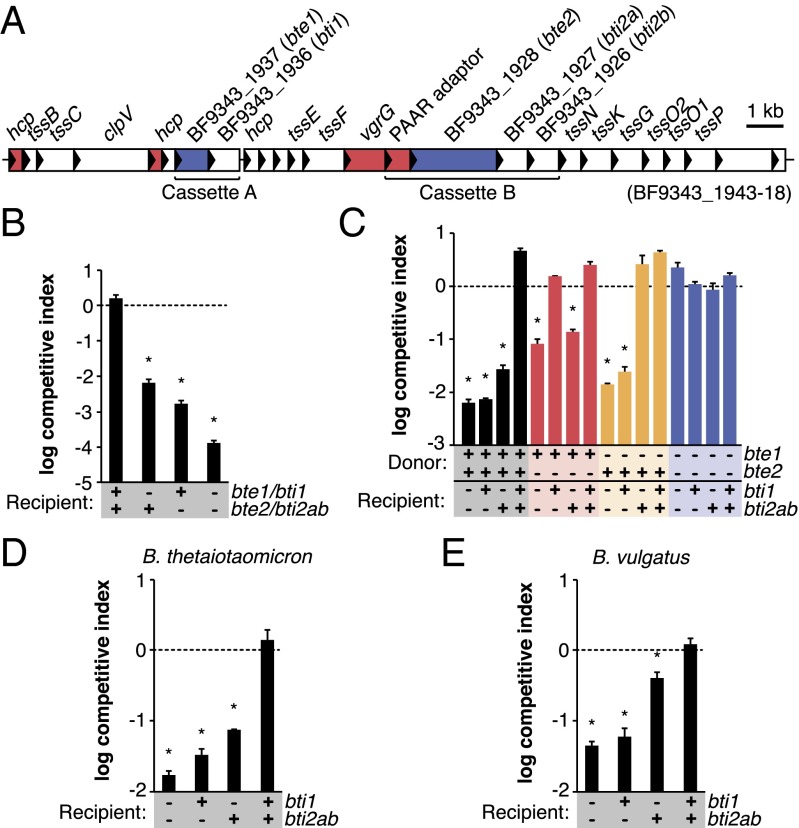
Based on the presence of genes encoding putative effector and adaptor proteins, we hypothesized that these cassettes might encode E/I pairs that mediate cytotoxicity against recipient cells. Indeed, secretome analysis of B. fragilisN revealed six proteins that are present specifically in the secretome of the wild-type strain but not the tssC control strain (Fig. 3A; Dataset S1, Table S4). Three of these proteins are homologs of the secreted proteobacterial T6SS structural proteins Hcp [also observed in a recent study (16)] and VgrG, and the fourth contains a PAAR-repeat domain typical of T6SS adaptors (9, 10). Of the two remaining proteins, BF9343_1937 lacks any known T6S effector domains, and BF9343_1928 contains a MIX domain found in other T6SS effectors (17). These proteins have no previously known function and are encoded, along with the PAAR adaptor, within cassettes A and B of B. fragilisN (Fig. 3A).
Fig. 3.
Identification of T6S-dependent antibacterial effectors and cognate immunity proteins in B. fragilisN. (A) Secretome profiling reveals two candidate effectors in B. fragilisN. Proteins secreted by B. fragilisN in a T6S-dependent manner (Dataset S1, Table S4) are mapped onto its T6SS locus (red, known T6SS components; blue, candidate effectors). (B) Candidate E/I pairs protect against T6S-mediated killing. B. fragilisN donor cells were grown in contact with B. fragilisN tssC recipient cells carrying deletions of genes encoding the E/I pairs. (C) Expression of effector genes causes T6S-mediated killing of recipient cells lacking cognate immunity genes. B. fragilisN donor cells were grown in contact with E/I mutant recipient cells expressing immunity genes or carrying an empty vector. (D and E) B. thetaiotaomicron (D) and B. vulgatus (E) are protected from B. fragilisN T6S by heterologous expression of immunity genes. Recipient species carry an empty vector or constitutively express B. fragilisN immunity genes. In all graphs, *P < 0.05. Error bars indicate ± SD (n = 2; representative of three independent trials).
T6S effectors are typically encoded in tandem with their cognate immunity genes (10). To test whether BF9343_1936 and BF9343_1927-6 (homologs) function as immunity genes, we examined the ability of B. fragilisN to kill isogenic tssC recipient cells missing one or both of these loci. Indeed, deletion of either candidate E/I pair increases recipient sensitivity to killing by wild-type (but not tssC) donor cells by orders of magnitude (Fig. 3B). In-frame deletion of the candidate E/I pairs from the wild-type strain, and constitutive expression of the candidate immunity genes in a tssC recipient strain lacking both E/I pairs, confirmed that each immunity protein confers protection against T6S-mediated cell killing in an effector-specific manner (Fig. 3C). Based on these observations, we assigned BF9343_1937 and BF9343_1928 the names bte1 (B. fragilis T6S effector 1) and bte2, and the cognate immunity genes BF9343_1936 and BF9343_1927-26 the names bti1 (B. fragilis T6S immunity 1), bti2a, and bti2b, respectively. Bte1 and Bte2 fully account for the in vitro killing of both B. thetaiotaomicron and B. vulgatus (Fig. 1 A and C), because constitutive expression of bti1 and bti2ab in either symbiont conferred complete protection against wild-type B. fragilisN (Fig. 3 D and E); this suggests that the effector repertoire of B. fragilisN is encoded within cassettes A and B, although B. thetaiotaomicron and B. vulgatus could potentially be resistant to other B. fragilisN effectors.
T6SS+ B. fragilis Strains Target Susceptible Members of Their Species Both in Vitro and in Vivo.
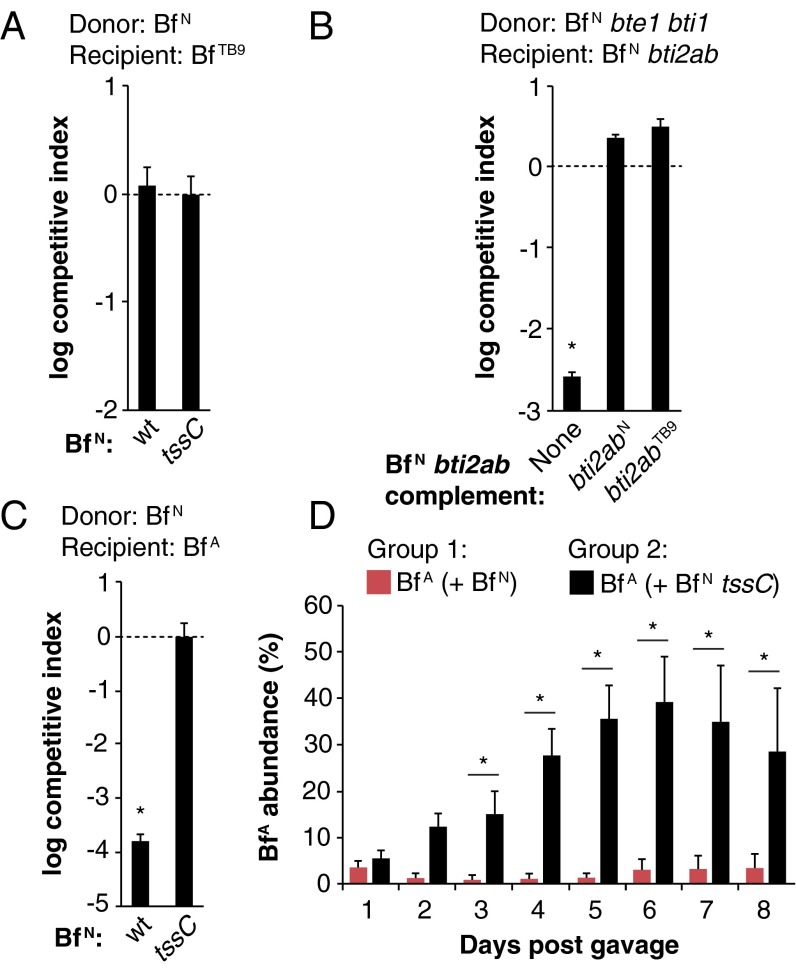
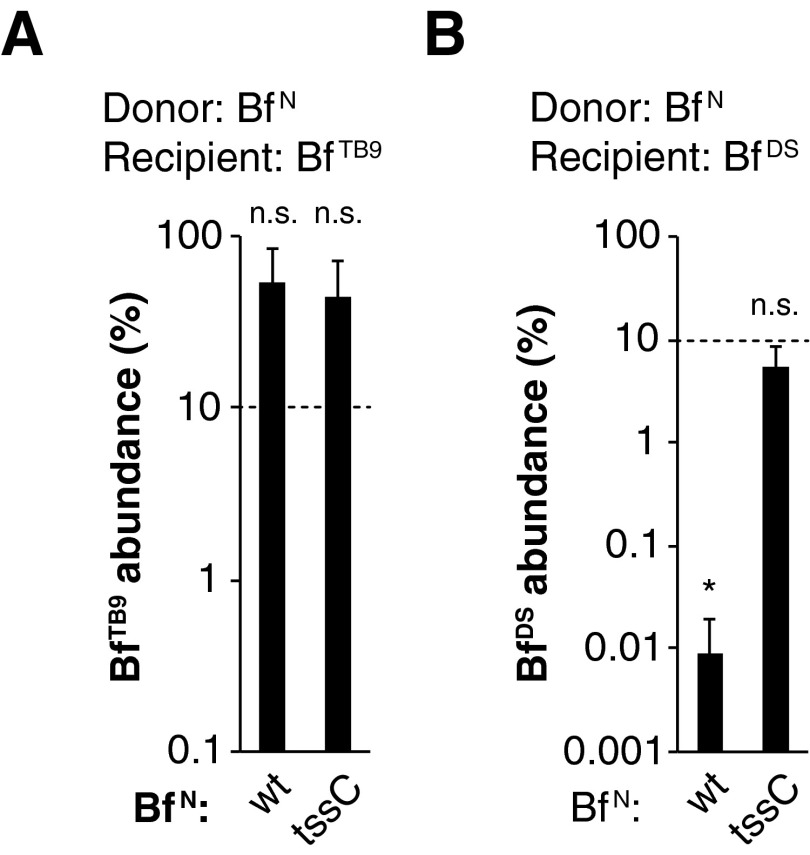
Our comparative genomic analysis revealed that several other strains, such as B. fragilis 3986 T(B)9 (B. fragilisTB9), lack bte1 and bte2 yet encode orphan homologs of bti1 and/or bti2ab, either outside of their T6SS locus or in the absence of a T6SS entirely. Indeed, B. fragilisTB9 is fully resistant to B. fragilisN T6S activity in vitro and in vivo (Fig. 4A; Fig. S2A). Moreover, the B. fragilisTB9 bti2ab homologs protect an otherwise sensitive B. fragilisN recipient strain (lacking tssC and both E/I pairs) against B. fragilisN Bte2 activity, demonstrating that these orphan immunity homologs are functional (Fig. 4B).
Fig. 4.
Interstrain dynamics are determined by T6S antagonism in vitro and in vivo. (A) B. fragilis 3986 T(B)9 (BfTB9) is resistant to B. fragilisN (BfN) T6S in vitro. (B) B. fragilisTB9 T6S immunity homologs are functional. Expression of B. fragilisN or B. fragilisTB9 bti2ab homologs confers immunity to a B. fragilisN tssC mutant lacking its own E/I pairs. (C and D) Interactions between B. fragilisN (BfN) and B. fragilis ATCC 43859 (BfA) are determined by T6S in vitro (C) and in vivo (D). For all in vitro experiments: *P < 0.05. Error bars indicate ± SD (n = 2; representative of three independent trials). For D, *P < 0.05 between recipient populations in each group (n = 5 mice per group; representative of two independent trials). Error bars indicate ± SD.
Fig. S2.
In vivo T6S antagonism is strain-dependent. Recipient strains B. fragilisTB9 (A) or B. fragilisDS (B) were introduced into germ-free mice with either B. fragilisN WT or tssC mutant strains. Dotted lines indicate abundance of recipient strains on day 0 based on cfu counts. Strain abundances were determined by qPCR from fecal gDNA on day 14 post-gavage. *P < 0.05 between day 0 and day 14 time points; n.s., not significant (n = 3 mice per group); error bars indicate ± SD.
Like most bacterial species, B. fragilis strains can vary by hundreds to thousands of genes whose functions are largely unknown. To investigate whether T6S can determine the ecological balance between strains in vivo in the context of all of these other factors, we examined B. fragilis ATCC 43859 (B. fragilisA), whose genome differs from B. fragilisN by 608 genes (including a lack of a T6SS and orphan immunity homologs). As expected, B. fragilisA was susceptible to T6S attacks in vitro (Fig. 4C). We then gavaged germ-free mice with a mixture of both strains and assessed strain abundances in feces over time. Indeed, B. fragilisA was suppressed to less than 5% of the microbiome in the presence of wild-type B. fragilisN, but represented nearly half of the microbiome in the presence of the tssC control (Fig. 4D). Similarly, T6S also determines the ecological balance between the T6SS– strain B. fragilis DS-208 (B. fragilisDS) and B. fragilisN in vivo (Fig. S2B).
Measuring Gut Symbiont T6S-Mediated Killing Rates in Live Animals.
Collectively, our data suggest that these contact-based bacterial interactions could play a significant role in shaping gut microbial ecology and highlight strains and species that share an ecological niche. However, the frequency of T6S effector transmission from donor cells to sensitive or resistant recipient cells has never been studied in a natural habitat. The gnotobiotic mouse model, combined with precise genetic manipulation of T6S activity in human symbionts, provides the opportunity to quantify effector transmission rates in the mammalian gut. To this end, we applied a special case of the generalized Lotka–Volterra model (5, 18), which relates experimentally measured changes in the ratio of donor and recipient cells to the abundance of donor cells in the community and the effector transmission rate β:
where D is the concentration of donor cells, r is the ratio of susceptible recipient (S) to donor cells, t is time, and β is a transmission coefficient that quantifies the rate at which donor cells encounter sensitive cells multiplied by the probability that an encounter will lead to successful killing event. This model provides several testable predictions. First, if β = 0 (no T6SS activity), the ratio between isogenic donor and recipient cells will not change over time. Second, time-series measurements of D and S are sufficient to provide a solution for β.
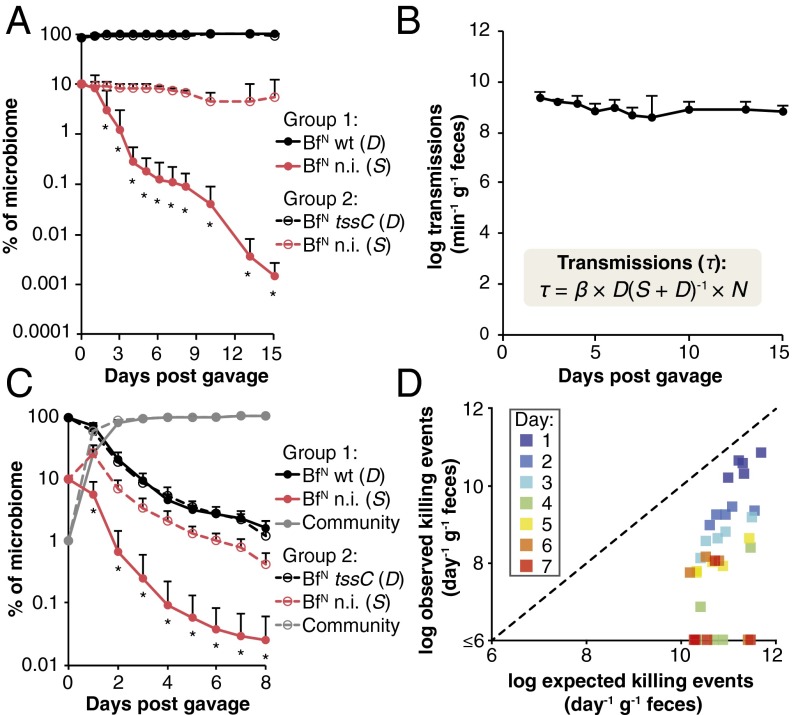
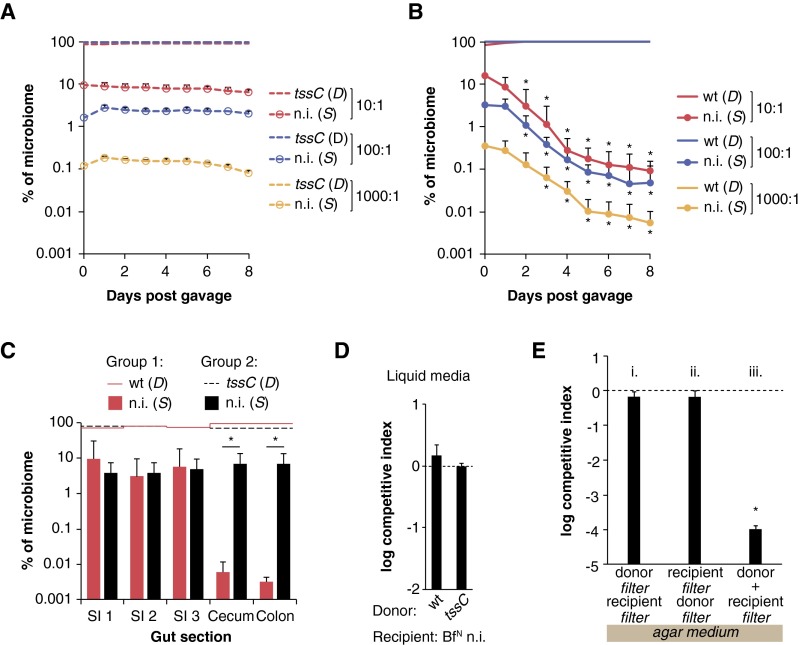
To test if these populations are in fact stable in the absence of T6S-dependent interactions, we first colonized germ-free mice with B. fragilisN tssC (representing a D population, where β = 0) and an isogenic nonimmune derivative lacking the E/I pairs identified above (representing an S population). As expected, the susceptible population remained stable over time, indicating that birth and immigration (by coprophagy) rates are equivalent to death and emigration (loss in feces) rates in this ecosystem at multiple starting ratios of D and S (Fig. 5A and Fig. S3A). By contrast, the same susceptible population is rapidly and continually depleted when cocolonized with wild-type B. fragilisN, at multiple starting ratios of D and S (Fig. 5A and Fig. S3B). As expected, T6S activity is evident throughout the densely populated large intestine, but not in the small intestine where bacterial colonization densities are orders of magnitude lower (Fig. S3C). Consistently, an otherwise susceptible strain is fully protected from T6S-mediated killing in liquid culture where cell-to-cell contact is transient and limited in frequency, and also on solid surfaces if cell contact is blocked by a 0.2-µm filter (Fig. S3 D and E). Based on over 100 direct measurements of D and S in these animals, a transmission coefficient β of 0.62 ± 0.15 effector transmission events per D cell per day is sufficient to produce the population dynamics observed in vivo (Fig. S4). This transmission rate is equivalent to over 109 effector transmission events per minute per gram of colonic contents and is stable over time (Fig. 5B).
Fig. 5.
B. fragilis transmits T6S effectors in gnotobiotic mice at rates exceeding 109 events per minute per gram of colonic contents. (A) Human gut symbiont T6S activity rapidly and continually removes T6S-sensitive cells from the gut. A B. fragilisN tssC strain lacking both E/I pairs [nonimmune (n.i.); BfN n.i.] was introduced as a susceptible (S) recipient into germ-free mice with either wild-type B. fragilisN (BfN WT) or B. fragilisN tssC (BfN tssC) as T6S-positive or -negative donor (D) strains, respectively, at a 1:10 starting ratio of S to D populations. *P < 0.05. Error bars indicate ± SD between nonimmune populations in each group (n = 5 mice per group; representative of two independent trials). (B) Population-level effector transmission rates (τ) exceeding 109 events per minute per gram of colonic contents are stable and sufficient to drive the population dynamics observed in Fig. 5A. N = total population size (SI Materials and Methods). Error bars indicate ± SD; see also Fig. S4. (C) T6S-mediated killing of a susceptible (S) population is modulated by the relative population size of a representative human microbiome. Germ-free mice were colonized with nonimmune B. fragilisN (S), WT or tssC B. fragilisN (D), and a 14-species human gut commensal community (Dataset S1, Table S5). *P < 0.05 between nonimmune populations in each group (n = 5 mice per group, representative of two independent trials); error bars indicate ± SD (Fig. S5). (D) The presence of the community reduces T6S attacks on susceptible cells in the gut. For each time interval, expected T6S killing events (calculated from the measured S to D ratios at the beginning of the interval and β quantified from Fig. 5A) are compared with observed T6S-dependent killing events in Fig. 5C.
Fig. S3.
T6S-dependent strain dynamics in vivo. (A and B) A B. fragilisN tssC strain lacking both E/I pairs [nonimmune (n.i.)] was introduced into germ-free mice in the presence of B. fragilisN tssC (A) or WT (B) B. fragilisN at the indicated starting ratios of D to S cells. *P < 0.05 between nonimmune populations in each group (n = 5 mice per group; representative of two independent trials); error bars indicate ± SD. (C) B. fragilisN targets susceptible cells in the large intestine but not the small intestine. Luminal contents from small intestine (SI) or large intestine segments of mice in Fig. 5A were collected for analysis by qPCR on day 15 of the experiment (Dataset S1, Table S5). *P < 0.05 between nonimmune populations in each group (n = 5 mice per group; representative of two independent trials); error bars indicate ± SD. (D) Nonimmune B. fragilisN (BfN n.i.) is not effectively killed by WT B. fragilisN in liquid culture. (E) B. fragilis T6S activity requires cell contact. B. fragilisN WT or tssC donor strains were cocultured on solid media with a nonimmune mutant B. fragilisN recipient on a 0.2-µm filter. In i and ii, a second 0.2-µm filter was placed between donor and recipient strains, whereas in iii, the second filter was omitted. Cocultures with WT B. fragilisN are shown, and data were normalized to coculture experiments with the T6S-deficient tssC mutant B. fragilisN (dotted line). *P < 0.05 between WT and tssC competitions.
Fig. S4.
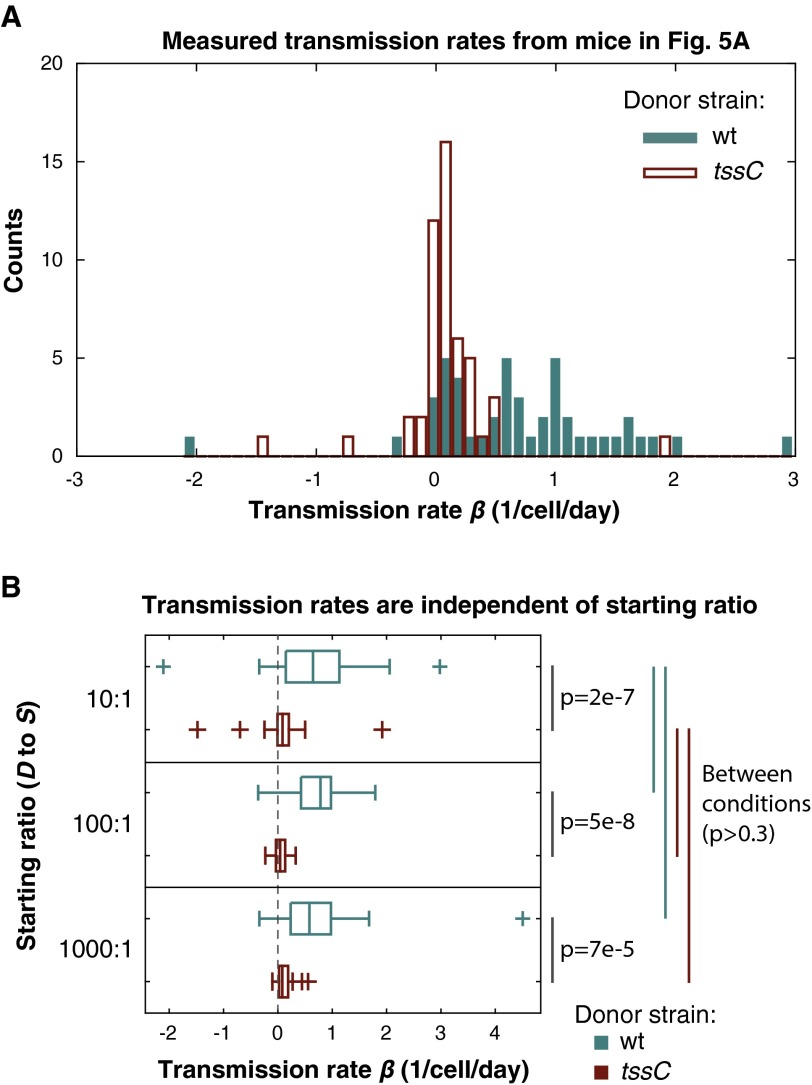
Quantification of T6S effector transmission rates in gnotobiotic mice. (A) Individual time points from each mouse in Fig. 5A are plotted according to their calculated transmission rate coefficient β. (B) Transmission rates for each group in Fig. 5A and Fig. S3 A and B plotted for each starting ratio of D to S cells. P values were determined using the Mann–Whitney U test (SI Materials and Methods).
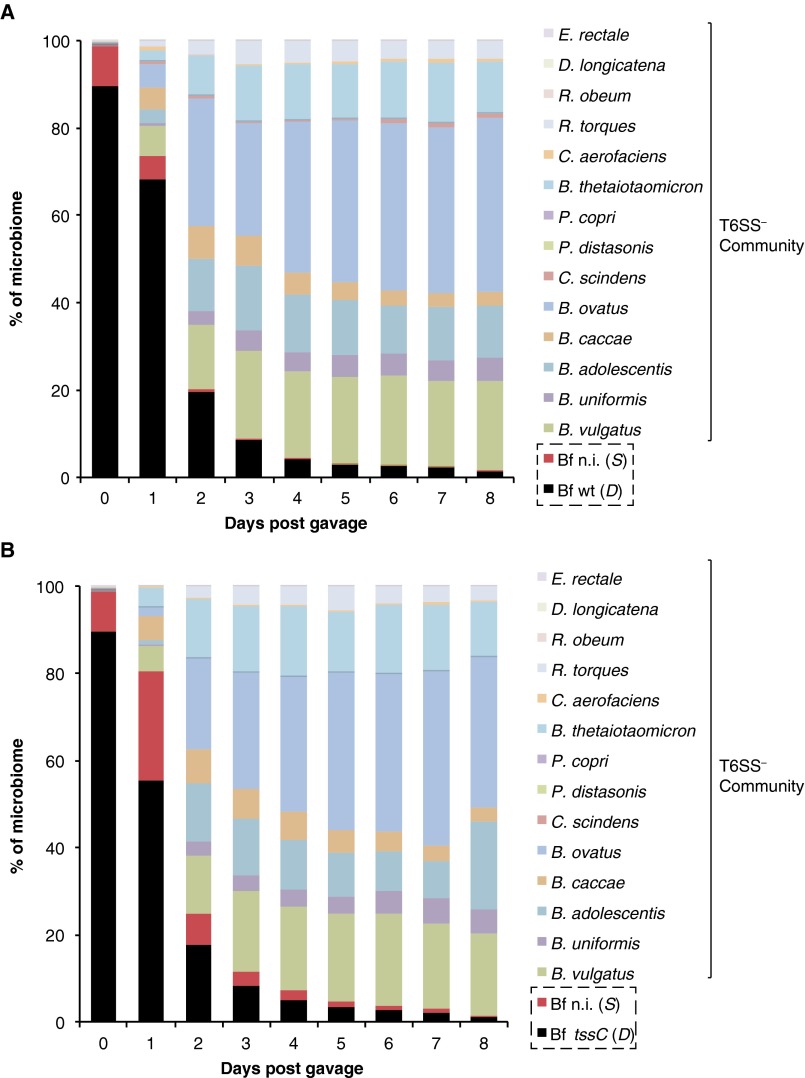
In humans, B. fragilis typically represents 0.1–1% of the microbiome (19); the rest of the community represents a mixture of D, S (other Bacteroides are T6SS+ or T6SS− and constitute up to 80% of the microbiome), and resistant populations. To determine the impact of a multiphylum community of human gut commensals on the dynamics of D and S B. fragilisN populations across varying abundances, we colonized germ-free mice with either wild-type or tssC B. fragilisN (D populations), a nonimmune B. fragilisN lacking tssC and both E/I pairs (S population), and a 14-species, T6SS– human gut community representing three major phyla found in the gut (Dataset S1, Table S5). In these animals, the D and S B. fragilisN populations initially represent 99% of the microbiome and stabilize over time to ∼1% of the community, approximating B. fragilis levels in humans (Fig. 5C; Fig. S5). Quantification of each species and the B. fragilisN populations over time revealed significant T6S-dependent killing (>107 killing events/gram/day) throughout the experiment, even when B. fragilisN populations approach 1% of the entire community (Fig. 5D). Notably, T6S-dependent killing of the susceptible S population decreases over time as the 14-species T6SS– community increases in relative abundance. To determine whether the observed decrease in T6S-dependent killing could be fully explained by the smaller D and S populations or also required community protection, we calculated expected killing rates in each time interval, based on the initial measured ratio of D and S in that interval and the β value determined above. Observed killing rates in the presence of the community were significantly lower than these expected values, and these differences increased in proportion to community abundance (Fig. 5 C and D), which suggests that the presence of a diverse community enables susceptible individuals to persist despite antagonism by T6S.
Fig. S5.
T6S-mediated antagonism is impacted by the presence of other commensals. (A and B) A B. fragilisN tssC strain lacking both E/I pairs (Bf n.i.) was introduced into germ-free mice in the presence of wild-type B. fragilisN (Bf WT) (A) or B. fragilisN tssC (Bf tssC) (B), along with a 14-species community of human gut commensals. Input (day 0) ratios are based on cfu counts from glycerol stocks of individual species quantified at the time of gavage. Abundance of each community member from day 1 to day 8 was measured from fecal samples using species- or strain-specific qPCR (Dataset S1, Table S5) (n = 5 mice per group).
Discussion
Genome sequencing of strains isolated from individual human gut microbiomes over time has revealed that individual strains within these communities, particularly Bacteroidetes, can persist for years or decades in humans without significant strain replacement (20). Though metagenomic sequencing highlights broad (i.e., phylum-level) microbiome changes in response to diet, antibiotics, and other factors, the mechanisms that determine community membership at the species- or strain-level are largely unexplored. The human gut and its microbiome is one of the densest known ecosystems, and bacteria that occupy this habitat face stringent competition for dietary and host-derived nutrients localized to food particles or mucus (21); at the same time, they benefit from diffusible vitamins, metabolic by-products, and public goods produced by other species or strains (22, 23). Mechanisms for contact-dependent antagonism, including T6S, could allow cells to minimize local nutritional competition without impacting the fitness of spatially distant bacteria that provide these beneficial compounds. The distribution of T6SS+ strains within (and outside) the Bacteroidetes is not easily predicted due to extensive horizontal gene transfer (Fig. 2). Given that members of this phylum constitute 50–80% of the microbiome in many individuals (19), our results and others (15) suggest that contact-dependent antagonism is a general feature that shapes interbacterial interactions between human gut microbes.
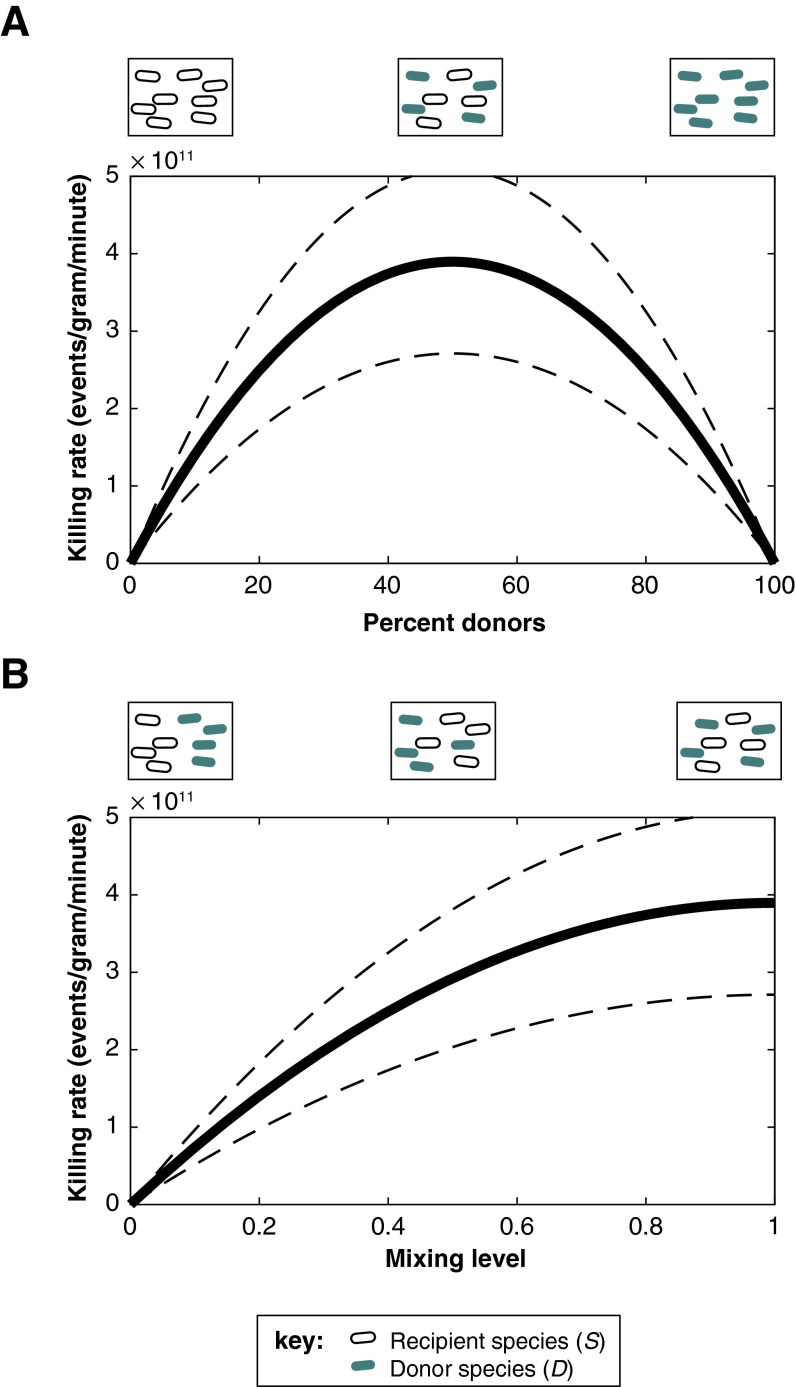
As expected from the contact-dependent nature of these interactions, mathematical modeling predicts that the frequency of T6S-mediated killing events reaches a maximum under conditions in which all cells are evenly mixed and donor and recipient cells each constitute half of the community (Fig. S6). Our experiments using defined microbial communities in germ-free mice support these predictions: B. fragilisN significantly reduces B. vulgatus abundance via T6S when the T6S-positive and -negative cells each represent ∼50% of the community (Fig. 1D), but this does not occur when the T6S-positive cells represent only 1% (Fig. S5). Similar dynamics may explain the discrepancy between in vitro and in vivo dynamics of T6S-mediated killing of B. thetaiotaomicron. Moreover, our model suggests that the decrease in the observed killing rate of B. fragilisN in a multispecies community (Fig. 5D) does not require an intrinsic reduction in the transmission rate (i.e., decreased β), but instead can be explained by changes in the population dynamics of the microbiome (e.g., altered ratios of donors and recipients over time, uneven mixing of species). Together, these studies highlight the importance of in vivo experiments for understanding the role of contact-mediated interactions between bacteria. Long-term studies could also reveal more subtle or indirect T6S interactions that manifest over one or more host generations.
Fig. S6.
Predicting the impact of evenness and mixing on T6S-mediated killing in vivo. (A) A mathematical model parameterized using time-series measurements from gnotobiotic mice predicts that the number of killing events peaks when donors and recipients each make up 50% of the community, maximizing the likelihood of encounters between the two cell types. (B) If the D and S populations each constitute 50% of the microbiome, the rate of killing is highest when there is complete spatial mixing, because this also maximizes encounters between donors and recipients. In A and B, the thick line is the model prediction based on the mean transmission rate β, and the dashed lines represent the 95% confidence intervals of the mean.
Identification and genetic manipulation of E/I pairs in B. fragilis strains, combined with gnotobiotic animal models in which community composition can be controlled and measured, allows for the calculation of a transmission coefficient (β = 0.62 per D cell per day) for T6S activity in the gut. This calculation represents a lower bound for this activity in vivo for at least three reasons. First, uneven mixing would increase the number of transmission events required to mediate the observed killing rates (Fig. S6B). Second, the model assumes that a single effector transmission event into an S individual results in the death and subsequent removal of that individual from the population. However, if some proportion of transmission events into S cells does not result in the death of the recipient, then those individuals will not be removed from the population, representing transmission events that do not produce an observable change in S. Indeed, in vitro studies of the opportunistic proteobacterial pathogen Pseudomonas aeruginosa suggest that its T6SS kills recipient cells at rates of ∼5% or less per hour of contact (24). Third, our experiments used T6S-negative recipient populations. P. aeruginosa cells display an elevated propensity to activate T6S in response to a T6S attack (24, 25). Although this phenomenon has not been investigated in Bacteroides, the S strain and 14-species community in these experiments are T6S-negative and would not induce this increased transmission rate that may occur between T6S-positive (D) individuals.
From our calculation of effector transmission rates between bacteria, we can predict that humans carrying B. fragilis at typical levels (19) host 60–600 billion effector transmission events per day from this species alone. A deeper understanding of the E/I repertoires present among human symbiont strains within an individual microbiome will help to predict the impact of T6S on other community members. Interestingly, our data show that human symbionts can accumulate immunity genes throughout their genomes that protect against T6S effectors that they do not encode, suggesting a selective advantage to maintaining the ability to evade contact-mediated antagonism. Because immunity genes are difficult to recognize by sequence alone (9, 10), many more may exist in the genomes of commensal bacteria. Unlike the immunity genes, B. fragilis effectors appear to be encoded in stereotyped positions inside the T6SS locus (Fig. 2). Because numerous human gut Bacteroidetes besides B. fragilis carry T6SS loci (11, 12, 15), additional effectors will be readily identifiable in other species. These effectors reveal strategies human gut symbionts themselves have evolved to target other members of this community, and may provide important new approaches for precision microbiome manipulation.
Materials and Methods
Bacterial Culture Conditions.
Bacteroides strains (Dataset S1, Table S5) were anaerobically cultured on brain heart infusion (BHI; Becton Dickinson) agar supplemented with 50 µg/mL hemin (Sigma-Aldrich) and 0.5 µg/mL menadione (MP Biomedicals), in liquid tryptone-yeast-glucose (TYG) medium (26), or liquid minimal medium (22). Representative microbiome community members (Dataset S1, Table S5) were grown as previously described (27).
Genetic Techniques.
A full list of primers, plasmids, and strains are provided (Dataset S1, Table S5). Genetic manipulation of B. fragilis NCTC 9343 was enabled by adapting a counter selectable system originally developed in B. thetaiotaomicron (28) for use in B. fragilis. Detailed methods can be found in SI Materials and Methods.
Comparative Genomics.
Genome phylogenies.
The phylogenetic relationship between all 92 available sequenced strains of B. fragilis (Dataset S1, Table S1) was assessed by maximum likelihood on sets of ubiquitously distributed genes constituting the core genome, as described in SI Materials and Methods.
T6SS identification and phylogenetics.
For each genome, T6SS presence/absence was determined by BLASTn (29) search for homologs of the eight core T6SS structural components from B. fragilisN that are conserved between Proteobacterial and Bacteroidetes T6SSs (Dataset S1, Table S2) using an E-value cutoff of 0.0001, coverage cutoff of 50%, and identity cutoff of 50%. Detailed methods can be found in SI Materials and Methods.
Identification of T6S Effectors by Mass Spectrometry.
B. fragilisN tdk and B. fragilisN tdk tssC were subcultured from exponential cultures, grown to mid-log phase in minimal medium (22), and pelleted. Proteins in the supernatant were precipitated with trichloroacetic acid, trypsinized, and analyzed by LC-MS/MS as described previously (11). Additional methodological and analytical details can be found in SI Materials and Methods.
In Vitro Bacterial Competitions.
Strains were grown on BHI agar plates, resuspended in PBS, and adjusted to an OD600 of 6.0 for donor strains and 0.6 for recipient strains. Cells were mixed at a 1:1 vol/vol ratio, and 5 µL of each mixture was spotted onto nitrocellulose squares placed on BHI agar plates. After incubation at 37 °C anaerobically for 20–24 h, viable cells were enumerated by serial dilution and plating. Additional methodological and analytical details can be found in SI Materials and Methods.
Gnotobiotic Animal Studies.
All animal experiments were performed using protocols approved by the Yale University Institutional Animal Care and Use Committee. Male and female germ-free 8- to 12-wk-old Swiss Webster mice were maintained in flexible plastic gnotobiotic isolators with a 12-h light/dark cycle. Mice were individually caged and were provided with standard autoclaved mouse chow (5K67 LabDiet; Purina) ad libitum. Germ-free mice were colonized with bacteria from glycerol stocks by oral gavage. Fecal samples were collected over time and upon sacrificing each mouse, samples were collected along the length of the gut and stored at −80 °C before genomic DNA extraction (27) (SI Materials and Methods).
Mathematical Model.
Rates of in vivo T6SS activity were determined using a special case of the generalized Lotka–Volterra system commonly used to model microbiome dynamics (5, 18). Details are available in SI Materials and Methods.
SI Materials and Methods
Bacterial Culture Conditions.
All anaerobic procedures were performed in an anaerobic chamber (Coy Laboratory Products) filled with 70% N2, 20% CO2, and 10% H2 by volume. Escherichia coli S17-1 lambda pir strains were grown in LB medium and incubated aerobically at 37 °C. Antibiotics were added as needed at the following concentrations: ampicillin 100 µg/mL, erythromycin 25 µg/mL, gentamicin 200 µg/mL, tetracycline 2 µg/mL, and 5-fluoro-2′-deoxyuridine (FUdR) 200 µg/mL.
Genetic Techniques.
The creation, maintenance, and transformation of plasmid constructs were performed using standard molecular cloning procedures. All primers used in this study were obtained from the Keck Biotechnology Resource Laboratory (Yale University). DNA amplification was carried out using KAPA HiFi ReadyMix (Kapa Biosystems).
Construction of B. fragilisN tdk.
Gene deletions in B. fragilis NCTC 9343 were constructed by adapting a counter-selectable system originally developed in B. thetaiotaomicron (28) for use in B. fragilis. A B. fragilisN tdk strain, which is resistant to the toxin FUdR, was constructed by amplifying ∼1,000-bp fragments flanking BF9343_0556 (tdk) using primer pairs tdk_SalI_F1 and tdk_SOE_R1, and tdk_SOE_F2 and tdk_BamHI_R2 (Dataset S1, Table S5). These fragments were joined and ligated into the suicide vector pKNOCK-bla-ermGb to make pKNOCK-bla-ermGb-BF9343_0556 (Dataset S1, Table S5). The resulting vector was conjugated into B. fragilis from E. coli S17-1 lambda pir using standard procedures (28). Merodiploids were selected on gentamicin and erythromycin, grown in liquid TYG overnight to stationary phase, and plated onto nonselective media. Individual clones were then screened for erythromycin sensitivity and FUdR resistance. Erythromycin-sensitive, FUdR-resistant clones were screened for loss of tdk by PCR. Deletion candidates were confirmed by sequencing.
Deletion of T6SS genes.
Using the B. fragilisN tdk parental strain, subsequent deletions were constructed by amplifying flanking regions (800–1,000 bp) of genes of interest using primers described in Dataset S1, Table S5, and concatenating them by splicing by overlap extension (SOE) PCR or by Gibson assembly. The resulting conjoined fragments were inserted into the suicide vector pExchange-tdk (28) either by ligation or Gibson assembly. Sequence-verified clones were conjugated into B. fragilisN tdk, and deletions were constructed and verified as above. In our investigation of candidate immunity genes for bte2 (BF9343_1928), we deleted both BF9343_1927 and BF9343_1926 because these genes are close homologs.
Gene complementation.
Complementation constructs and oligonucleotide barcoded pNBU2 vectors were introduced in single copy into the genome as previously described (22).
In Vitro Bacterial Competitions.
Solid medium competitions.
Strains were grown on BHI agar plates overnight at 37 °C. Bacteria were resuspended from the plates in PBS, and optical densities (600 nm) of cell suspensions were adjusted to 6.0 for donor strains and 0.6 for recipient strains. Cells were mixed at a 1:1 vol/vol ratio, and 5 µL of each mixture was spotted onto nitrocellulose squares placed on BHI agar plates. After incubation at 37 °C anaerobically for 20–24 h, competition mixtures were resuspended in PBS. Serial dilutions were plated onto BHI agar supplemented with appropriate antibiotics to select for either donor or recipient cells. Competitions with an intervening 0.2-µm filter were performed as above, but without mixing donor and recipient strains. Competitions between B. fragilisN and either B. fragilisA or B. fragilisTB9 were performed at a 2:1 ratio based on OD600 for 12 h before plating output cells. Mean and SD were determined from technical replicates and all data are representative of at least three independent experiments. To calculate competitive index, abundance of each strain was normalized to B. fragilisN tssC control competitions. Significant (P < 0.05) differences were determined by Student’s t test.
Liquid medium competitions.
Strains were grown anaerobically at 37 °C overnight in 5 mL minimal medium. After 20 h, OD600 was measured and adjusted to 1.0. Donor and recipient strains were then mixed at a 10:1 ratio, subcultured to OD600 0.01 in 5-mL fresh minimal medium, and grown for 20 h anaerobically at 37 °C. Input and output cell viability was determined by cfu plating onto selective media.
Comparative Genomics.
Genome phylogenies.
Orthologs were defined by reciprocal best hits using USEARCH global (30) as pairs of genes having at least 70% identity with ≥80% sequence length conservation. Gene families were built by transitivity (i.e., orthologs necessarily belong to the same gene family). Gene families were considered as part of the core genome if present in every strain exactly once. We assigned 597 genes to the core genome, which were aligned using MAFFT v7 (31) and merged into a single alignment. The tree was built using RAxML v7.2 (32) under a GTR + Γ (4) model, and 100 bootstrap replicates were generated with the same model. The tree was rooted at the midpoint root.
T6SS identification and phylogenetics.
For each genome, T6SS presence/absence was determined by BLASTn (29) search for homologs of the eight core T6SS structural components from B. fragilisN that are conserved between Proteobacterial and Bacteroidetes T6SSs (Dataset S1, Table S2) using an E-value cutoff of 0.0001, coverage cutoff of 50%, and identity cutoff of 50%. Because many of these genomes are in draft stage, we used the same parameters to query 14 housekeeping genes conserved across all bacteria (Dataset S1, Table S2); for each genome, 14/14 of these genes were successfully identified. We obtained similar T6SS presence/absence results from a BLASTn search for all genes within the T6SS locus of B. fragilisN (BF9343_1943-18). To determine the phylogenetic relationships between T6SS loci, nucleotide sequences of the eight core T6SS genes were independently aligned with MAFFT v7 (31) and concatenated into a single alignment. The maximum-likelihood tree was built as described above. Homologs to bte1, bti1, bte2, bti2a, and bti2b were identified by BLASTn using an E-value cutoff of 0.0001, coverage cutoff of 50%, and identity cutoff of 50%. T6SS loci were aligned with progressiveMAUVE (33). To identify candidate effectors in other strains, amino acid sequences of ORFs encoded between the homologs of BF9343_1925 and BF9343_1930, or between the homologs of BF9343_1935 and BF9343_1940, in each T6SS+ strain were clustered into homology groups by h-CD-HIT (34) using two runs (initial sequence identity cutoff of 90%; secondary sequence identity cutoff of 50%) with default parameters, except minimal alignment coverage for both longer and shorter sequences was set to 0.5. Gene homology group clustering was also repeated using all-by-all BLASTp (29) with similar results. Putative domains were identified from representative genes in each homology group using PFAM and PHYRE (35, 36). T6SS locus variable blocks were clustered into E/I cassette homology groups according to common gene content as defined by h-CD-HIT.
Determining the number of unique genes between B. fragilisN and B. fragilisA.
Unique genes were determined as described (27). Briefly, all proteins with length >100 aa from B. fragilisN (3,831 proteins) and B. fragilisA (3,886 proteins) were compared by BLASTp (29). For each genome, ORFs were considered unique if they did not have a reciprocal best BLASTp match in the other genome with an E-value cutoff of 0.0001. The 100-aa cutoff was used to exclude putative ORFs located at the contig ends in the draft genome of B. fragilisA.
Identification of T6S Effectors by Mass Spectrometry.
Sample preparation.
Secretome samples were prepared for mass spectrometry as described (11). Briefly, 250-mL cultures of B. fragilisN tdk and B. fragilisN tdk tssC were grown to mid-log phase in minimal medium (22). A total of 1 mL of each culture was then pelleted, washed, and used to inoculate 250 mL of minimal medium. Cultures were again grown to mid-log phase before being pelleted by centrifugation at 3,220 × g for 30 min at 4 °C. Supernatant fractions were collected and spun at 3,220 × g for an additional 30 min at 4 °C. Subsequent trichloroacetic acid precipitation, reduction, alkylation, and trypsinization of secreted proteins was performed as described previously (11).
MS analysis of tryptic peptides.
Tryptic peptides were resolved in 10 µL of ACN/H2O/FA (5/95/0.1, vol/vol/vol) for LC-MS/MS analysis. The samples were analyzed in duplicates on a nanoLC (NanoAcquity; Waters Corporation) coupled to a hybrid quadrupole Orbitrap mass spectrometer (Orbitrap Elite; Thermo-Fisher). For each run, 2 µL of sample was loaded on a 100 μm inner diameter (i.d.) × 20 mm 200 Å, 5 μm C18AQ precolumn at a flow rate of 4 µL/min for 5 min, using a loading buffer of ACN/H2O/FA (5/95/0.1, vol/vol/vol). Peptide separation was performed on a 75 µm i.d. × 180 mm 100 Å, 5 µm C18AQ analytical column at a flow rate of 250 nL/min in a 95-min gradient by using mobile phase A of 0.1% formic acid in water and mobile phase B of 0.1% FA in acetonitrile. The gradient elution started at 5% mobile phase B, increased to 35% at 60 min, 80% at 65 min, and held at 80% for 5 min before a 25-min re-equilibration at 5%. Mass spectrometry data were collected in positive ionization mode using a data-dependent acquisition method with a full MS scan for m/z range 350–2,000 in Orbitrap at 120K resolution. Consecutive MS/MS scans selected top 15 abundant ions in ion trap by rapid scan mode with a dynamic exclusion of 30 s. Precursor ions selected from the MS scan were isolated with an isolation width of 2 m/z for collision-induced dissociation energy, NCE, at 35.
MS data were analyzed by MaxQuant (version 1.5.0.25) (37) using standard settings and a UniprotKB database of B. fragilisN. Peptide-spectrum matches and protein identifications were filtered at a false discovery rate of 0.01. MS/MS spectral counts were extracted and used for statistical analysis of differential expression by using QSpec tool (version 1.2.2) (38). Mean and SD in protein abundance (spectral counts) was determined from two technical replicates. Proteins were filtered such that they had at least two unique peptides detected and had ≥4 average spectral counts in wild-type samples (Dataset S1, Table S4). Proteins with genetic linkage to known T6SS genes in B. fragilis were chosen for further investigation (11). Absence of putative signal peptides in all proteins highlighted in Fig. 3A were confirmed using SignalP 4.1 (39).
Gnotobiotic Animal Studies.
B. fragilis competitions.
For B. fragilisN monocolonization experiments, strains were thawed from individual 20% glycerol stocks and introduced into germ-free mice by oral gavage at a starting ratio of 10:1 (109 cfu:108 cfu), 100:1 (109 cfu:107 cfu), or 1,000:1 (109 cfu:106 cfu) B. fragilisN (WT or tssC) to B. fragilisN tssC bte1 bti1 bte2 bti2ab. To determine total community size (N), freshly collected fecal samples were weighed, serially diluted, and plated onto nonselective media. For B. fragilis interstrain competitions, strains were introduced into germ-free mice by oral gavage at a starting ratio of 10:1 (108 cfu:107 cfu) B. fragilisN (WT or tssC) to B. fragilisA, B. fragilisTB9, or B. fragilisDS.
For B. fragilis interspecies competitions with B. thetaiotaomicron or B. vulgatus, strains were introduced into germ-free mice at a starting ratio of 100:1 (108 cfu:106 cfu) B. fragilisN (WT or tssC) to B. thetaiotaomicron or B. vulgatus.
Defined community experiments.
Germ-free mice were colonized with B. fragilisN (WT or tssC), B. fragilisN tssC bte1 bti1 bte2 bti2ab (nonimmune), and a collection of 14 commensal species (Dataset S1, Table S5) at a starting ratio of 100:10:1 (108 cfu:107 cfu:106 cfu).
For all experiments, fecal samples were collected over time and stored at −80 °C before genomic DNA extraction. Upon sacrificing each mouse, samples were collected along the length of the gut and stored at −80 °C. Total gDNA was recovered from each input gavage sample and each fecal and luminal content sample. DNA was extracted as described previously (27). The relative abundance of each strain was determined using species-specific or oligonucleotide barcode-specific primers (Dataset S1, Table S5) in a quantitative PCR (qPCR) assay as described (22) using a CFX96 Detection System (Bio-Rad) and SYBR FAST Universal Mastermix (KAPA Biosystems). Mean strain quantities were calculated using a standard curve, and relative fold changes were calculated with the efficiency-corrected ∆Cq method (40). Significant (P < 0.05) differences were determined by Student’s t test.
Mathematical Model.
We describe a two species donor–recipient consortium. The two species, donor (represented by D) and sensitive recipient (represented by S), are isogenic and differ only in one locus such that D can kill S. Because both species are otherwise identical, we assume that their growth rate and carrying capacity are the same in the gut. The rate equation for the donor strain is
| [S1] |
Parameter α is the coefficient of self-limitation used to implement logistic growth and its value sets the carrying capacity (carrying capacity = µ/α). The coefficient of net growth µ includes all the first-order rates, including birth, immigration (by coprophagy), death, and emigration (loss in feces). The recipient strain is described by the same equation but with an additional death term that describes T6S-mediated killing:
| [S2] |
The model of Eqs. S1 and S2 is a special case of the generalized Lotka–Volterra system commonly used to model microbiome dynamics (5, 18):
| [S3] |
where is the specific growth rate of species i, and is the interaction between species i and j in a system with a number T of distinct species. To obtain Eqs. S1 and S2, we have T = 2 for the system with two species S and D. The parameters are , , , and .
The killing rate is a function of , which means that it will be higher when both species are in high abundance; this is because there must be an encounter between one bacterium of each kind for a discrete killing event to occur and the rate at which and meet each other is proportional to . The coefficient quantifies the rate at which killer cells encounter sensitive cells multiplied by the probability that an encounter will lead to successful killing.
Our goal is to measure killing rate directly from time-series data measured experimentally in gnotobiotic mice. The microbiota composition is measured using qPCR, producing a precise measurement of the ratio of the two bacterial populations, S/D, which we represent with symbol . We adapt Eq. S2 so that can be obtained from values of S/D. Using the derivative rule, we have
| [S4] |
Substituting Eqs. S1 and S2 in Eq. S4 and gives
| [S5] |
We can now write Eq. S5 in logarithmic form:
| [S6] |
We discretize Eq. S6 so that we can calculate using consecutive time points. We use the integral form
| [S7] |
The left-hand side of Eq. S7 has an analytical solution, which is . For the right-hand side, we use the geometric mean to approximate the integral, because D can change exponentially in time:
| [S8] |
Because is measured by qPCR, we use the following approximation:
| [S9] |
where is calculated from the qPCR measurements, and we use N = 2.2 × 10¹² bacteria per gram feces, measured from serial dilution and plating of fecal samples from germ-free mice monocolonized with B. fragilisN for 7 d (n = 4 mice).
Consequently, the following equation can be solved to determine the value of :
| [S10] |
Note the change in sign from Eq. S7. Here, is the geometric mean of D determined in Eq. S8.
Eq. S10 can be solved in two ways. One way is to calculate a value of for each time interval between two consecutive time points. This approach is useful to investigate statistics in a nonparametric way, without having to assume that the data are, e.g., normally distributed. Fig. S4A shows the empirical distribution of killing rates from the 10:1 experiment. Fig. S4B compares distributions from 1:10, 1:100, and 1:1,000 starting ratios of S to D using nonparametric methods. The analysis shows (i) that the killing effect is highly significant and (ii) that the killing rate per cell is unaffected by the initial inoculum dilution. The P values were calculated using the Mann–Whitney U test. The second way to solve Eq. S10 is by regression using a linear model with zero intercept. Fig. S4B shows that the experiments started at different ratios (10:1; 100:1; 1,000:1) are consistent, and therefore those data can be pooled together to compute a single value of with 95% confidence intervals from more than 100 time intervals.
Supplementary Material
Acknowledgments
We thank members of A.L.G.’s laboratory; J. Galán and E. Groisman for helpful discussions; and C. Sears for B. fragilisTB9 and B. fragilisDS. D.R.G. thanks the University of Maryland School of Pharmacy Mass Spectrometry Center (SOP1841-IQB2014). This work was supported NIH Grants GM103574 and GM105456 (to A.L.G.), AI080609 (to J.D.M.), GM101209 and GM108657 (to H.O.), and OD008440 (to J.B.X.); the Pew Scholars Program (A.L.G.); and the Burroughs Wellcome Fund (A.L.G. and J.D.M.). A.G.W. is supported by a fellowship from the Gruber Foundation, and J.C.W. is supported by a fellowship from the Canadian Institutes of Health Research.
Footnotes
The authors declare no conflict of interest.
This article is a PNAS Direct Submission.
This article contains supporting information online at www.pnas.org/lookup/suppl/doi:10.1073/pnas.1525637113/-/DCSupplemental.
References
- 1.Arthur JC, et al. Intestinal inflammation targets cancer-inducing activity of the microbiota. Science. 2012;338(6103):120–123. doi: 10.1126/science.1224820. [DOI] [PMC free article] [PubMed] [Google Scholar]
- 2.Haiser HJ, et al. Predicting and manipulating cardiac drug inactivation by the human gut bacterium Eggerthella lenta. Science. 2013;341(6143):295–298. doi: 10.1126/science.1235872. [DOI] [PMC free article] [PubMed] [Google Scholar]
- 3.Hehemann JH, et al. Transfer of carbohydrate-active enzymes from marine bacteria to Japanese gut microbiota. Nature. 2010;464(7290):908–912. doi: 10.1038/nature08937. [DOI] [PubMed] [Google Scholar]
- 4.Greenblum S, Carr R, Borenstein E. Extensive strain-level copy-number variation across human gut microbiome species. Cell. 2015;160(4):583–594. doi: 10.1016/j.cell.2014.12.038. [DOI] [PMC free article] [PubMed] [Google Scholar]
- 5.Buffie CG, et al. Precision microbiome reconstitution restores bile acid mediated resistance to Clostridium difficile. Nature. 2015;517(7533):205–208. doi: 10.1038/nature13828. [DOI] [PMC free article] [PubMed] [Google Scholar]
- 6.Kommineni S, et al. Bacteriocin production augments niche competition by enterococci in the mammalian gastrointestinal tract. Nature. 2015;526(7575):719–722. doi: 10.1038/nature15524. [DOI] [PMC free article] [PubMed] [Google Scholar]
- 7.Goodman AL, et al. Identifying genetic determinants needed to establish a human gut symbiont in its habitat. Cell Host Microbe. 2009;6(3):279–289. doi: 10.1016/j.chom.2009.08.003. [DOI] [PMC free article] [PubMed] [Google Scholar]
- 8.Palm NW, et al. Immunoglobulin A coating identifies colitogenic bacteria in inflammatory bowel disease. Cell. 2014;158(5):1000–1010. doi: 10.1016/j.cell.2014.08.006. [DOI] [PMC free article] [PubMed] [Google Scholar]
- 9.Silverman JM, Brunet YR, Cascales E, Mougous JD. Structure and regulation of the type VI secretion system. Annu Rev Microbiol. 2012;66:453–472. doi: 10.1146/annurev-micro-121809-151619. [DOI] [PMC free article] [PubMed] [Google Scholar]
- 10.Russell AB, Peterson SB, Mougous JD. Type VI secretion system effectors: Poisons with a purpose. Nat Rev Microbiol. 2014;12(2):137–148. doi: 10.1038/nrmicro3185. [DOI] [PMC free article] [PubMed] [Google Scholar]
- 11.Russell AB, et al. A type VI secretion-related pathway in Bacteroidetes mediates interbacterial antagonism. Cell Host Microbe. 2014;16(2):227–236. doi: 10.1016/j.chom.2014.07.007. [DOI] [PMC free article] [PubMed] [Google Scholar]
- 12.Coyne MJ, Zitomersky NL, McGuire AM, Earl AM, Comstock LE. Evidence of extensive DNA transfer between bacteroidales species within the human gut. MBio. 2014;5(3):e01305–e01314. doi: 10.1128/mBio.01305-14. [DOI] [PMC free article] [PubMed] [Google Scholar]
- 13.Mazmanian SK, Round JL, Kasper DL. A microbial symbiosis factor prevents intestinal inflammatory disease. Nature. 2008;453(7195):620–625. doi: 10.1038/nature07008. [DOI] [PubMed] [Google Scholar]
- 14.Karlsson FH, Ussery DW, Nielsen J, Nookaew I. A closer look at bacteroides: Phylogenetic relationship and genomic implications of a life in the human gut. Microb Ecol. 2011;61(3):473–485. doi: 10.1007/s00248-010-9796-1. [DOI] [PubMed] [Google Scholar]
- 15.Coyne MJ, Roelofs KG, Comstock LE. Type VI secretion systems of human gut Bacteroidales segregate into three genetic architectures, two of which are contained on mobile genetic elements. BMC Genomics. 2016;17(1):58. doi: 10.1186/s12864-016-2377-z. [DOI] [PMC free article] [PubMed] [Google Scholar]
- 16.Wilson MM, Anderson DE, Bernstein HD. Analysis of the outer membrane proteome and secretome of Bacteroides fragilis reveals a multiplicity of secretion mechanisms. PLoS One. 2015;10(2):e0117732. doi: 10.1371/journal.pone.0117732. [DOI] [PMC free article] [PubMed] [Google Scholar]
- 17.Salomon D, et al. Marker for type VI secretion system effectors. Proc Natl Acad Sci USA. 2014;111(25):9271–9276. doi: 10.1073/pnas.1406110111. [DOI] [PMC free article] [PubMed] [Google Scholar]
- 18.Coyte KZ, Schluter J, Foster KR. The ecology of the microbiome: Networks, competition, and stability. Science. 2015;350(6261):663–666. doi: 10.1126/science.aad2602. [DOI] [PubMed] [Google Scholar]
- 19.Human Microbiome Project Consortium Structure, function and diversity of the healthy human microbiome. Nature. 2012;486(7402):207–214. doi: 10.1038/nature11234. [DOI] [PMC free article] [PubMed] [Google Scholar]
- 20.Faith JJ, et al. The long-term stability of the human gut microbiota. Science. 2013;341(6141):1237439. doi: 10.1126/science.1237439. [DOI] [PMC free article] [PubMed] [Google Scholar]
- 21.Sonnenburg JL, et al. Glycan foraging in vivo by an intestine-adapted bacterial symbiont. Science. 2005;307(5717):1955–1959. doi: 10.1126/science.1109051. [DOI] [PubMed] [Google Scholar]
- 22.Degnan PH, Barry NA, Mok KC, Taga ME, Goodman AL. Human gut microbes use multiple transporters to distinguish vitamin B₁₂ analogs and compete in the gut. Cell Host Microbe. 2014;15(1):47–57. doi: 10.1016/j.chom.2013.12.007. [DOI] [PMC free article] [PubMed] [Google Scholar]
- 23.Rakoff-Nahoum S, Coyne MJ, Comstock LE. An ecological network of polysaccharide utilization among human intestinal symbionts. Curr Biol. 2014;24(1):40–49. doi: 10.1016/j.cub.2013.10.077. [DOI] [PMC free article] [PubMed] [Google Scholar]
- 24.LeRoux M, et al. Quantitative single-cell characterization of bacterial interactions reveals type VI secretion is a double-edged sword. Proc Natl Acad Sci USA. 2012;109(48):19804–19809. doi: 10.1073/pnas.1213963109. [DOI] [PMC free article] [PubMed] [Google Scholar]
- 25.Basler M, Ho BT, Mekalanos JJ. Tit-for-tat: Type VI secretion system counterattack during bacterial cell-cell interactions. Cell. 2013;152(4):884–894. doi: 10.1016/j.cell.2013.01.042. [DOI] [PMC free article] [PubMed] [Google Scholar]
- 26.Holdeman LV, Cato ED, Moore WEC. Anaerobe Laboratory Manual. Virginia Polytechnic Inst and State Univ Anaerobe Lab; Blacksburg, VA: 1977. [Google Scholar]
- 27.Cullen TW, et al. Antimicrobial peptide resistance mediates resilience of prominent gut commensals during inflammation. Science. 2015;347(6218):170–175. doi: 10.1126/science.1260580. [DOI] [PMC free article] [PubMed] [Google Scholar]
- 28.Koropatkin NM, Martens EC, Gordon JI, Smith TJ. Starch catabolism by a prominent human gut symbiont is directed by the recognition of amylose helices. Structure. 2008;16(7):1105–1115. doi: 10.1016/j.str.2008.03.017. [DOI] [PMC free article] [PubMed] [Google Scholar]
- 29.Altschul SF, Gish W, Miller W, Myers EW, Lipman DJ. Basic local alignment search tool. J Mol Biol. 1990;215(3):403–410. doi: 10.1016/S0022-2836(05)80360-2. [DOI] [PubMed] [Google Scholar]
- 30.Edgar RC. Search and clustering orders of magnitude faster than BLAST. Bioinformatics. 2010;26(19):2460–2461. doi: 10.1093/bioinformatics/btq461. [DOI] [PubMed] [Google Scholar]
- 31.Katoh K, Standley DM. MAFFT multiple sequence alignment software version 7: Improvements in performance and usability. Mol Biol Evol. 2013;30(4):772–780. doi: 10.1093/molbev/mst010. [DOI] [PMC free article] [PubMed] [Google Scholar]
- 32.Stamatakis A. RAxML-VI-HPC: Maximum likelihood-based phylogenetic analyses with thousands of taxa and mixed models. Bioinformatics. 2006;22(21):2688–2690. doi: 10.1093/bioinformatics/btl446. [DOI] [PubMed] [Google Scholar]
- 33.Darling AE, Mau B, Perna NT. progressiveMauve: Multiple genome alignment with gene gain, loss and rearrangement. PLoS One. 2010;5(6):e11147. doi: 10.1371/journal.pone.0011147. [DOI] [PMC free article] [PubMed] [Google Scholar]
- 34.Huang Y, Niu B, Gao Y, Fu L, Li W. CD-HIT Suite: A web server for clustering and comparing biological sequences. Bioinformatics. 2010;26(5):680–682. doi: 10.1093/bioinformatics/btq003. [DOI] [PMC free article] [PubMed] [Google Scholar]
- 35.Finn RD, et al. Pfam: The protein families database. Nucleic Acids Res. 2014;42(Database issue):D222–D230. doi: 10.1093/nar/gkt1223. [DOI] [PMC free article] [PubMed] [Google Scholar]
- 36.Kelley LA, Mezulis S, Yates CM, Wass MN, Sternberg MJ. The Phyre2 web portal for protein modeling, prediction and analysis. Nat Protoc. 2015;10(6):845–858. doi: 10.1038/nprot.2015.053. [DOI] [PMC free article] [PubMed] [Google Scholar]
- 37.Cox J, Mann M. MaxQuant enables high peptide identification rates, individualized p.p.b.-range mass accuracies and proteome-wide protein quantification. Nat Biotechnol. 2008;26(12):1367–1372. doi: 10.1038/nbt.1511. [DOI] [PubMed] [Google Scholar]
- 38.Choi H, Fermin D, Nesvizhskii AI. Significance analysis of spectral count data in label-free shotgun proteomics. Mol Cell Proteomics. 2008;7(12):2373–2385. doi: 10.1074/mcp.M800203-MCP200. [DOI] [PMC free article] [PubMed] [Google Scholar]
- 39.Petersen TN, Brunak S, von Heijne G, Nielsen H. SignalP 4.0: Discriminating signal peptides from transmembrane regions. Nat Methods. 2011;8(10):785–786. doi: 10.1038/nmeth.1701. [DOI] [PubMed] [Google Scholar]
- 40.Bookout AL, Cummins CL, Mangelsdorf DJ, Pesola JM, Kramer MF. High-throughput real-time quantitative reverse transcription PCR. Curr Protoc Mol Biol. 2006;Chap 15:Unit 15.8. doi: 10.1002/0471142727.mb1508s73. [DOI] [PubMed] [Google Scholar]
Associated Data
This section collects any data citations, data availability statements, or supplementary materials included in this article.


