Significance
Light-sheet fluorescence microscopy (LSFM) is an imaging modality in which a sample is illuminated from the side by a beam engineered into a wide and relatively thin “sheet.” This allows highly parallelized planewise scanning of volumes with inherent optical sectioning, offering a good balance between spatial and temporal resolution with reduced photostress. Unfortunately, the axial extent of the illuminated section is ultimately limited by diffraction. Here, we show that a RESOLFT [reversible saturable/switchable optical (fluorescence) transitions] strategy neutralizes the resolution-limiting role of diffraction in LSFM. While other LS strategies exist, which run into new hard axial limits of resolution, LS-RESOLFT is conceptually diffraction-unlimited and can be developed toward molecular-scale resolution.
Keywords: light-sheet microscopy, RESOLFT, optical nanoscopy, 3D, live-cell imaging
Abstract
We present a plane-scanning RESOLFT [reversible saturable/switchable optical (fluorescence) transitions] light-sheet (LS) nanoscope, which fundamentally overcomes the diffraction barrier in the axial direction via confinement of the fluorescent molecular state to a sheet of subdiffraction thickness around the focal plane. To this end, reversibly switchable fluorophores located right above and below the focal plane are transferred to a nonfluorescent state at each scanning step. LS-RESOLFT nanoscopy offers wide-field 3D imaging of living biological specimens with low light dose and axial resolution far beyond the diffraction barrier. We demonstrate optical sections that are thinner by 5–12-fold compared with their conventional diffraction-limited LS analogs.
Far-field nanoscopy (1, 2) methods discern features within subdiffraction distances by briefly forcing their molecules to two distinguishable states for the time period of detection. Typically, fluorophores are switched between a signaling “on” and a nonsignaling (i.e., dark) “off” state. Depending on the switching and fluorescence registration strategy used, these superresolution techniques can be categorized into coordinate-stochastic and coordinate-targeted approaches (2). The latter group of methods, comprising the so-called RESOLFT [reversible saturable/switchable optical (fluorescence) transitions] (1, 3–7) approaches, have been realized using patterns of switch-off light with one or more zero-intensity points or lines, to single out target point (zero-dimensional) or line (1D) coordinates in space where the fluorophores are allowed to assume the on state. The RESOLFT idea can also be implemented in the inverse mode, by using switch-on light and confining the off state. In any case, probing the presence of molecules in new sets of points or lines at every scanning step produces images.
Owing to the nature of the on and off states involved––first excited electronic and ground state––stimulated emission depletion (STED) (3) and saturated structured illumination microscopy (SSIM) (8), which both qualify as variants of the RESOLFT principle, typically apply light intensities in the range of MW/cm2 and above. Especially when imaging sensitive samples where photoinduced changes must be avoided, RESOLFT is preferably realized with fluorophores which lead to the same factor of resolution improvement at much lower intensities of state-switching light. Reversibly switchable fluorescent proteins (RSFPs) are highly suitable for this purpose (4–7, 9), as transitions between their metastable on and off states require 5 orders of magnitude lower threshold intensities than STED/SSIM to guarantee switch-off. Suitable spectral properties, relatively fast millisecond switching kinetics, and high photostability of recently developed yellow-green-emitting RSFPs like rsEGFP (5), rsEGFP2 (7), and rsEGFP(N205S) (10) compared with early RSFPs have indeed enabled RESOLFT nanoscopy in living cells and tissues. To date, RSFP-based RESOLFT has achieved resolution improvements by factors of 4–5 in rsEGFP2-labeled samples (7). To further reduce the imaging time, massive parallelization of scanning has been reported (10). However, the diffraction-limited axial resolution and lack of background suppression restrict applications to thin samples.
Imaging applications typically require careful tuning of imaging parameters including speed, contrast, photosensitivity, and spatial resolution, depending on the information that is sought. Light-sheet fluorescence microscopy (LSFM) (11–15) stands out by its ability to balance most of these parameters for 3D imaging of living specimens. Recently reenacted as the selective plane illumination microscope (13), this microscopy mode has sparked increasing interest notably because of its short acquisition times in 3D imaging and low phototoxicity in living specimens. It excites fluorophores only in a thin diffraction-limited slice of the sample, perpendicular to the direction of fluorescence detection. The LS is generated by a cylindrical lens which focuses an expanded laser beam in only one direction onto the specimen or into the back-focal plane of an illumination objective. Alternatively, a single beam is quickly moved as a “virtual” LS (16) across a specimen section.
In such conventional LSFM imaging, the lateral resolution is determined by the numerical aperture (N.A.) of the detection objective (17), whereas axial resolution is given by the LS thickness, provided the latter is thinner than the axial extent of the point-spread function describing the imaging process from the focal plane of the detecting lens to the camera. In a previous study, the axial resolution of LSFM was pushed to the diffraction limit by using the full aperture of the illumination objective with Gaussian beams; this was carried out for practically useful combinations of N.A. (e.g., 0.8 for both illumination and detection objectives) permissible in light of the geometrical constraints given by the objective lens dimensions (18). High-N.A. illumination comes with short Rayleigh ranges of Gaussian beams, which inherently limit the field of view (FOV) along the direction of illumination. Scanned Bessel beams for diffraction-limited excitation with a virtual LS (19–21) typically offer larger FOVs (22), but side lobes broaden the scanned LS in the axial direction and contribute to phototoxicity outside of the focal plane of detection (20). A more complex approach has used Bessel-beam excitation in combination with structured illumination to obtain near-isotropic (but still diffraction-limited) resolution as measured on fluorescent beads (20), albeit at the cost of acquisition time and reduced contrast due to fluorescence generated by the side lobes. In different work, axial resolution has also been improved about fourfold by acquiring two complementary orthogonal views of the sample using two alternating LSs, followed by computationally fusing image information with a deconvolution incorporating both views (23). LS approaches have also helped suppress out-of-focus background for single-molecule imaging in biological situations (e.g., in ref. 24), including at superresolution (25–27).
Slight axial resolution improvement beyond the diffraction barrier has been demonstrated by overlapping a Gaussian excitation LS with a STED LS featuring a zero-intensity plane (28). Due to scattering and possibly additional aberrations caused by the wavelength difference between excitation and STED light, the maximal achievable resolution in biological specimens was severely limited. This was the case even in fixed samples. A successful application of LS-STED to living cells or organisms has not been reported. The relatively high average STED laser power required for high resolution gains calls for developing a coordinate-targeted superresolution LS approach with low-power operation, meaning a concept that does not solely rely on changing the way the light is directed to––or collected from––the sample, but a concept that harnesses an “on–off” transition for improved feature separation.
Results
Preparing the Fluorescent State by Reversible Fluorophore Switching in an LS Geometry.
Here we report the simultaneous reversible switching between the fluorescent on and nonfluorescent off state in entire 2D planes, yielding LS-RESOLFT 3D images with much-improved axial (z) resolution. LS-RESOLFT symbiotically combines the advantages of RSFP-based RESOLFT nanoscopy and Gaussian-beam LS, exploiting the dark and fluorescent states of the RSFPs to reduce the axial extent of the examined object layer below the diffraction limit. This enables subdiffraction optical sectioning with low light intensities for detailed noninvasive imaging of living specimens. LS-RESOLFT also constitutes, to our knowledge, the first approach of improving the axial resolution in RSFP-based far-field fluorescence nanoscopy.
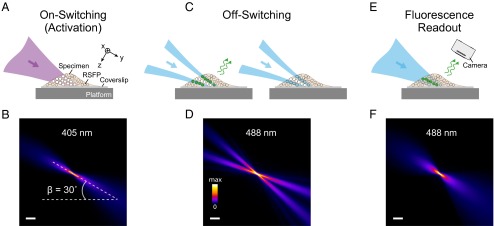
In the applied switching sequence (Fig. 1), so-called “negative-switching” RSFPs are switched to the on state with 405-nm light. Blue 488-nm light switches on-state fluorophores to the off state and also elicits fluorescence. The RSFPs applied in this study emit around 510 nm. The switching process is driven by three LSs in diffraction-limited axial sections of the sample. We use a common cylindrical lens, which focuses Gaussian laser beams into the back-focal plane of a low-N.A. illumination objective lens (Fig. S1). The activation LS switches RSFPs to the on state (Fig. 1 A and B). A second 488-nm LS featuring a planar zero-intensity domain leaves a subdiffraction thin section in which the fluorophores can assume the on state. The subdiffraction axial extent of the examined object layer is accomplished by switching fluorophores in the vicinity of this plane to the off state. Evidently, this plane is made to coincide with the focal plane of detection (Fig. 1 C and D). The off-switching pattern is generated by a half-moon phase plate (SI Materials and Methods) placed in the collimated off-switching beam. In the next step of the sequence, the remaining on-state fluorophores are read out by a third LS of the same wavelength (Fig. 1 E and F), which also switches them off again. Perpendicular to the illumination, a high-N.A. detection objective lens collects fluorescence in a wide-field manner. A tube lens focuses the detected light onto an sCMOS (scientific complementary metal-oxide-semiconductor) camera chip (lateral sampling of 108.3 nm). Images are recorded by displacing (scanning) the platform with the mounted coverslip and the sample at a design angle of 30° with respect to the illumination axis through the stationary LSs. The above acquisition cycle is repeated for each section of the sample, with the step size of the piezoelectric stage defining the axial sampling of the specimen (Fig. S2). The Rayleigh range along the illumination axis and the width of the LSs (Fig. S3) determine the FOV per plane; the maximal scan range of the piezoelectric stage defines the detectable volume.
Fig. 1.
LS-RESOLFT concept. A living specimen expressing RSFPs is grown on a coverslip mounted on a movable platform. The specimen is illuminated (here in y direction) perpendicular to the detection axis (z). (A and B) Only in a thin diffraction-limited section, RSFPs are switched from their initial off state (unfilled dots) to the on state (white dots) by an activating LS. None of the fluorophores outside the illuminated volume is affected by the laser light. (C and D) An LS featuring a central zero-intensity plane switches off the activated RSFPs above and below the detection focal plane (x-y). For negative-switching RSFPs, this is a competing process to fluorescence (green dots and arrows). For off-switching light intensities above the threshold of the RSFPs, only fluorophores within a slice of subdiffraction thickness remain activated. (E and F) These can be read out by a third LS and contribute to the LS-RESOLFT image. The platform is displaced to the next position in the scanning sequence for another illumination cycle (A, C, and E). (B, D, and F) Measured y-z cross-sections of the applied LSs visualized in fluorescent medium. The sheets impinge on the coverslip at an angle of 30°. (Scale bar, 100 µm.)
Fig. S1.
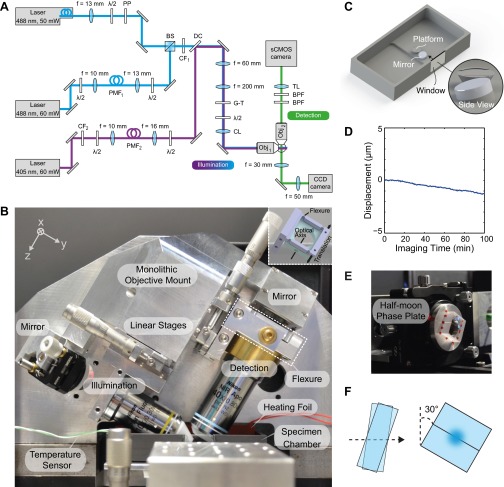
LS-RESOLFT setup. (A) Diagram of the optical components and the beam paths. λ/2: Half-wave plate polarization retarder, B. Halle Nachfl., PP: Half-moon phase plate, B. Halle Nachfl., Germany; BS: 50:50 beam-splitter cube, Thorlabs; PMF1: Polarization-maintaining single-mode fiber, Thorlabs; CF1: Excitation clean-up filter, 482/18, Semrock; CF2: Excitation clean-up filter, 406/15, Semrock; PMF2: Polarization-maintaining single-mode fiber, Thorlabs; DC: Dichroic mirror, Di02-R442, Semrock; G-T: Glan–Thompson prism, B. Halle Nachfl.; CL: Cylindrical lens, f = 150 mm, Thorlabs; Obj1: Objective lens CFI Plan Fluor 10XW, N.A. 0.3, Nikon; Obj2: Objective lens CFI Apo 40XW NIR, N.A. 0.8, Nikon; BPF: Fluorescence bandpass filter, 525/50, Semrock; TL: Tube lens, f = 300 mm, Nikon. (B) Monolithic objective mount unit for LS-RESOLFT. The illumination objective lens creates an LS which illuminates the sample in the specimen chamber at an angle of 30°. Fluorescence is collected by a detection objective lens perpendicular to the illumination axis. Both lenses are mounted on the same aluminum block to reduce thermal drifts. They are translated along their respective optical axes by linear stages (in y and z). For lateral positioning of the objective lenses (in x) a flexure is used (highlighted by a white dashed frame). (Inset) CAD drawing and the translation axis of the flexure. The imaging medium can be heated with a silicon-coated foil which is placed in the specimen chamber. The temperature is controlled by a sensor in the medium. (C) Specimen chamber. A standard round coverslip (diameter of 5 mm) with the sample is placed on a platform in the center of the cuboid-shaped specimen chamber made of PEEK. An imaging medium containing essential nonfluorescent additives for cell growth and Hepes buffer, and a temperature control adapt the conditions in the chamber to the physiological environment of living specimens. (D) The LS reflection on a tiny mirror placed at 15° with respect to the horizontal plane is used to measure the stability of the chamber. A displacement of less than 0.7 µm in 60 min is extracted from the plot. (E) Mounting and positioning of the half-moon phase plate. The half-moon phase plate consists of two glass flats mounted side-by-side, with one flat being tilted about an axis perpendicular to the touching faces. This assembly as a whole can be tilted about the same axis. (F) The off-switching beam is aligned to the optic axis, which is defined by the interface of the touching faces and the axis of tilt. For a fixed relative angle of the flats, a particular common tilt angle can be found such that the phase of one-half of the incident beam is retarded by π relative to the other half. The phase plate is rotated by 30° to account for the angle of the illumination objective.
Fig. S2.
Fig. S3.
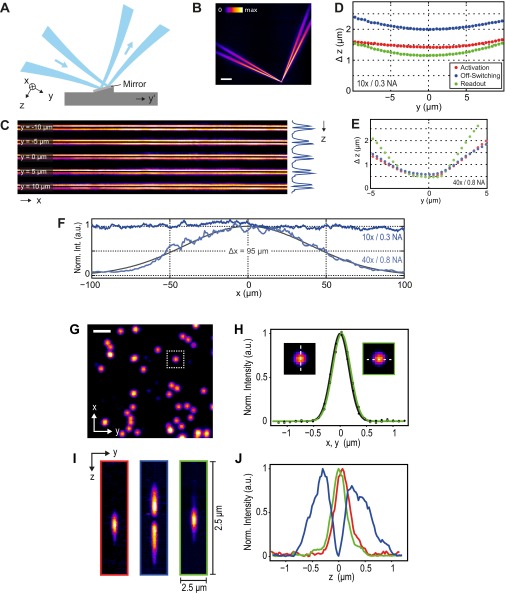
(A–F) Measurement of LS parameters. A mirror in the LS-RESOLFT specimen chamber (Fig. S1 C and D) reflects the attenuated static off-switching LS generated by a 10×/0.3 N.A. objective lens, as shown in the sketch (A) and the measured y-z cross-section (B). (Scale bar, 100 µm.) To measure the dimensions of the LS, the mirror is scanned stepwise in the y′ direction. At each scanning position, the reflected light is collected by a 40×/0.8 N.A. objective lens and imaged onto the sCMOS camera, resulting in x-z cross-sections of the LS after affine transformation. Five images of positions around the LS focus at y = 0 are shown in a montage (C). A line profile along the z axis across the integrated LS intensity reveals a reasonably uniform LS thickness over the extent of the typical spatial dimension of a biological cell. (D) The axial widths of all applied LSs in the presented study are plotted versus the illumination axis y. Their Rayleigh lengths were measured to be 6.5× longer than those measured for LSs generated by (E) a 40×/0.8 N.A. illumination objective lens, which results in a larger FOV along the y direction. (F) The lateral extent along the x direction of an off-switching LS is plotted for both illumination objective lenses. A Gaussian fit to the higher-N.A. intensity profile (which was not applied in LS-RESOLFT) reveals an FWHM of 95 μm, whereas the low-N.A. LS used for LS-RESOLFT imaging uniformly covers the entire FOV of the camera. The data for the sheets generated with a 40×/0.8 N.A. illumination lens are displayed for comparison only. (G–J) Measurement of the system’s PSFs and analysis of the zero-intensity region. Gold colloids on a glass coverslip scatter light of the laser LSs generated by a 40×/0.8 N.A. illumination objective, which is then imaged onto an sCMOS camera. (G) An overview image in the x-y plane shows the gold colloids (80 nm; BBI Solutions) imaged with the readout LS. (Scale bar, 1.5 μm.) (H) Line profiles in x- and y direction through a gold colloid image are shown. Gaussian fits to the data points reveal an FWHM in x (green dots and curve) and y (black) of 390 and 394 nm, respectively. (I) A y-z projection (2.5 × 2.5 μm2) of a gold colloid imaged with the activation (red), off-switching (blue), and readout (green) LS is shown. Note that the sampling size in z is 25 nm, whereas the sampling size in y is 108.3 nm (square image dimensions). The off-switching illumination profile clearly features an intensity minimum in the center. (J) Line profiles through projections in I along z show that the minimum is close to the background signal, which allows for LS-RESOLFT images with a potentially high signal-to-noise ratio. Despite a slight displacement from the center, the activation and readout peaks fully cover the off-switching zero-intensity position. Gaussian fits to their profiles exhibit FWHM values of 326 and 318 nm, respectively. Note that a bandpass filter was inserted to block light scattered by the coverslip. To attain reasonable signal-to-noise ratios in the images, we had to use sufficiently high intensities at the gold particles that could––for our available overall laser power––only be created by the higher-N.A. illumination, such as by the 40× (0.8 N.A.) lens, which was used for this demonstration.
Axial Resolution of LS-RESOLFT.
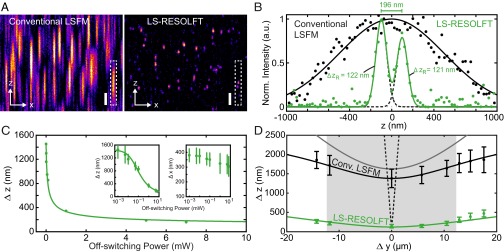
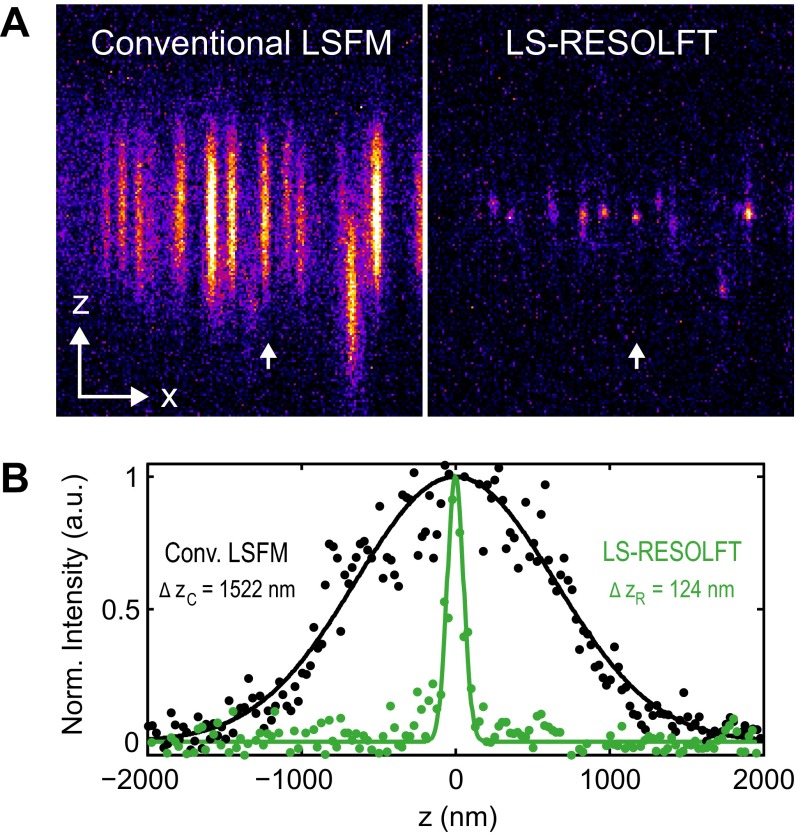
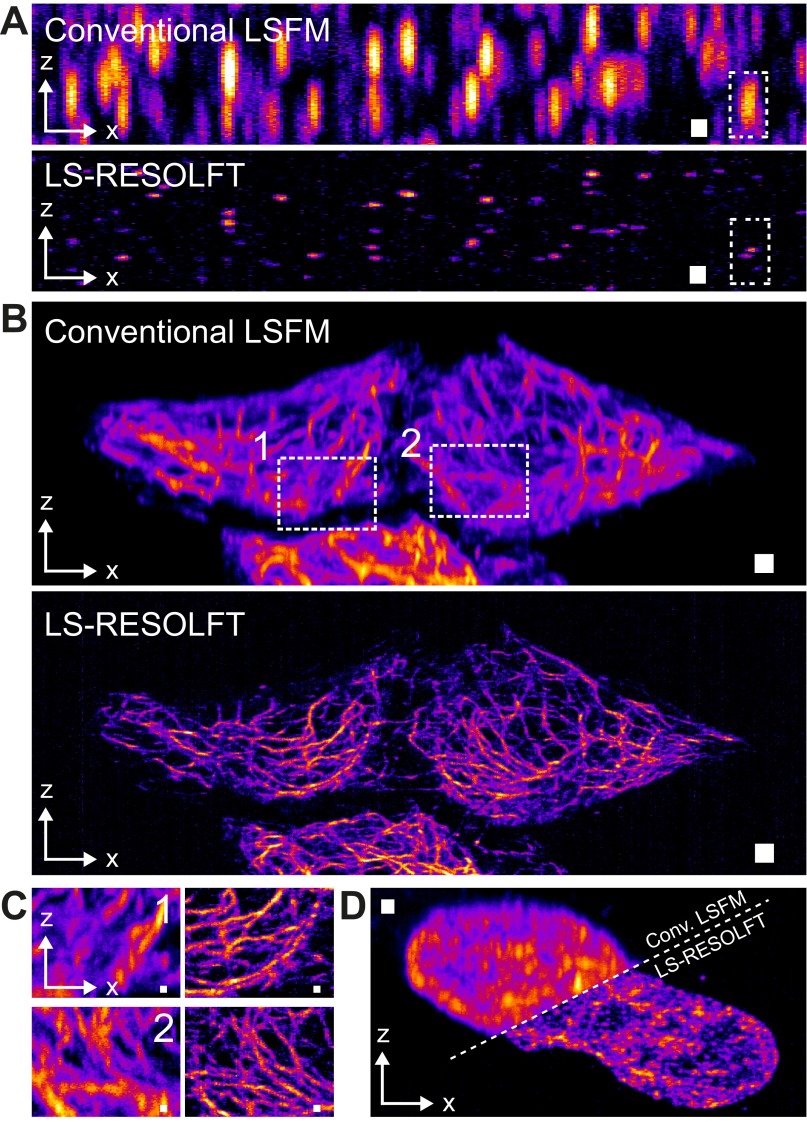
We characterized the resolving power of the LS-RESOLFT nanoscope by imaging spherical HIV-1 particles carrying roughly 1,000 rsEGFP2 proteins embedded in the HIV-1 structural protein Gag (group-specific antigen) (29) (Fig. 2 A and B and Movie S1). For a sufficiently high off-switching intensity, the axial resolution of the LS-RESOLFT instrument is increased to values well below the diffraction limit. The FWHM of a Gaussian fit to the axial line profile through a single HIV-1 particle is reduced from 1,522 nm for diffraction-limited LSFM to 124 nm in LS-RESOLFT (Fig. S4), demonstrating an increase in axial resolution by a factor >12. If the average HIV-1 particle size of 120–130 nm is taken into account, a RESOLFT LS thickness of about 100 nm (FWHM) is obtained. In a dense sample, single HIV-1 particles are clearly separable in the LS-RESOLFT image at subdiffraction distances, whereas they are not separable in the conventional LSFM mode. The theoretically predicted square-root dependence (1) of axial resolution on the off-switching power was experimentally confirmed (Fig. 2C). FWHM values obtained by averaging over more than 200 sparsely distributed particle images across the entire lateral FOV depend on the square root of the off-switching power (Fig. S5).
Fig. 2.
Characterization of LS-RESOLFT with spherical HIV-1 particles, in comparison with the conventional LSFM mode. (A) An x-z cross–section through a typical 3D image stack of HIV-1 particles attached to a glass coverslip clearly shows the improvement in z resolution enabled by LS-RESOLFT. Note that pixels correspond to 108.3 nm in x and 25 nm in z, respectively (total image size: 24 × 4 μm2). (Scale bar width and height, 500 nm.) (B) Pixel intensity line profile along the z direction in a marked region in A (white dashed box) for LS-RESOLFT (green dots) in comparison with conventional LSFM (black dots), with single (black line) and double (green line) Gaussian fits to the data. The FWHMs of single Gaussian fits (dashed black line) to the LS-RESOLFT data are far below the (axial) diffraction limit. (C) Dependence of the resolving power Δz on the off-switching laser power. For a fixed off-switching time of 30 ms, the average axial FWHMs of HIV-1 particles imaged in LS-RESOLFT mode were determined for various powers of the switch-off light bounding the axial zero-intensity plane. Mean FWHM values are plotted versus off-switching power in the back-focal plane of the illumination objective (green dots). Fit (green line) to the data confirms the inverse scaling with the square root of the applied intensity. The same data and fit are shown on a logarithmic scale (Left Inset), together with error bars derived from the SD of a Gaussian fit to the histograms (Fig. S5). (Right Inset) Lateral (x-y) FWHM dependence on off-switching power is shown (see the text). (D) At several positions along the illumination axis of the LSs, the average axial FWHM of the HIV-1 images were determined. The distance Δy in the measured sample plane from the minimal beam waist position is derived by the method shown in Fig. S6. The average value of Δz together with the SD is plotted versus the measured value of Δy for conventional LSFM (black data points) and LS-RESOLFT (green data points). From a fit to the conventional LSFM data (black line), the experimentally realized (diffraction-limited) illumination profile is inferred (gray line) for an illuminating Gaussian LS and a (near-) Gaussian axial detection profile. The FOV (gray box) of the microscope is then defined by the increase in waist by -fold to both sides. For reference, the FWHM beam waist of a theoretical Gaussian LS with the same minimum value as achieved by RESOLFT is plotted versus Δy (black dashed line). LS-RESOLFT substantially extends the available FOV along the y direction.
Fig. S4.
Resolving power of the LS-RESOLFT nanoscope. (A) The resolving power of the LS-RESOLFT nanoscope is measured on single HIV-1 particles on a glass coverslip. An x-z cross-section through a typical 3D image stack clearly shows the improvement in z resolution enabled by the LS-RESOLFT method compared with conventional LSFM. Note that the pixel size in both images is 108.3 nm in x- and 25 nm in z direction, and overall image dimensions are 19 × 5 μm2. (B) The pixel intensity along a line in the z direction through the same single virus particle is plotted for conventional LSFM (black dots) and LS-RESOLFT (green dots), respectively. The x position of the line profiles is marked with white arrows in the images. The FWHMs of Gaussian fits to the data reveal an improvement in axial resolution by LS-RESOLFT by a factor of 12.3 compared with standard LSFM.
Fig. S5.
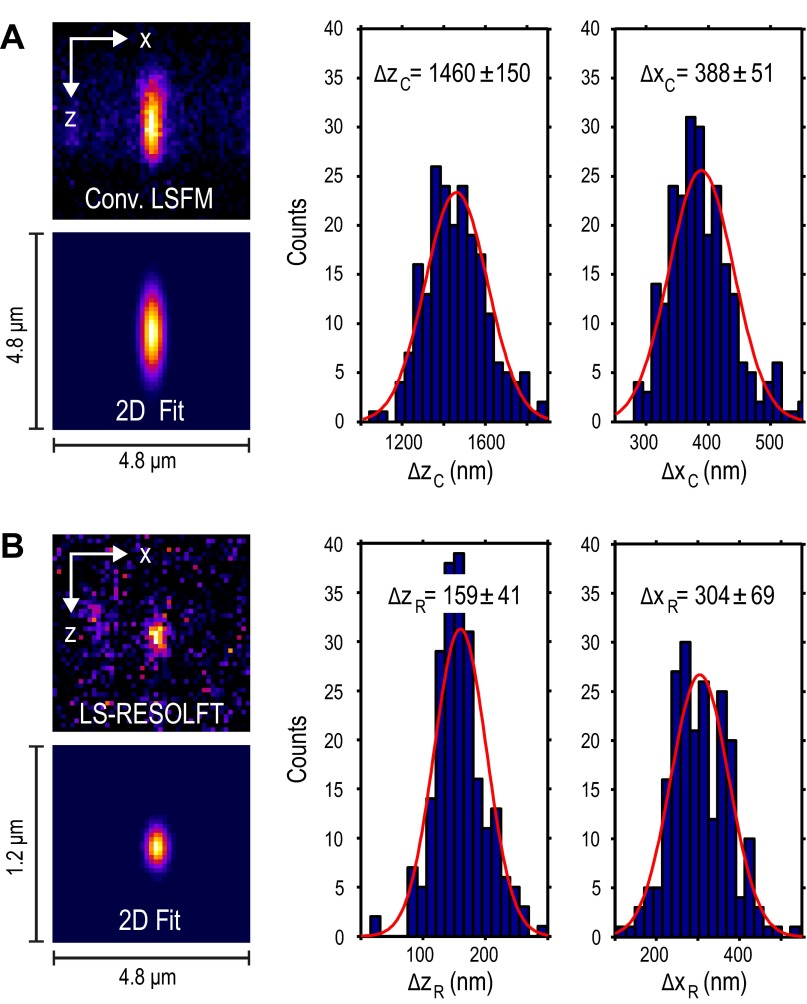
Distribution of axial and lateral FWHMs of Gaussian fits to HIV-1 particles imaged in conventional LSFM and LS-RESOLFT mode. (A) The FWHMs in z and x were extracted from more than 200 2D fits to conventional LSFM images of single HIV-1 particles on a glass coverslip. A typical image and the corresponding fit are shown on the left. From a fit to the distribution of FWHMs, the peak positions and SDs are determined. (B) The same region was scanned at maximal off-switching power in LS-RESOLFT mode. Two hundred and ten fits in z and x, respectively, were analyzed. Here, the resolving power in the z direction averaged over the FOV is improved by a factor of 9.2. Also, the lateral sharpness of particle images in LS-RESOLFT is improved by ∼15–20%. Note that for a valid fit, the 45 × 45 pixels of the images have different scales. In LS-RESOLFT images the pixel size in z is 25 nm, whereas the pixel size in x and the pixel size in both dimensions in conventional LSFM images is 108.3 nm.
Fig. S6.
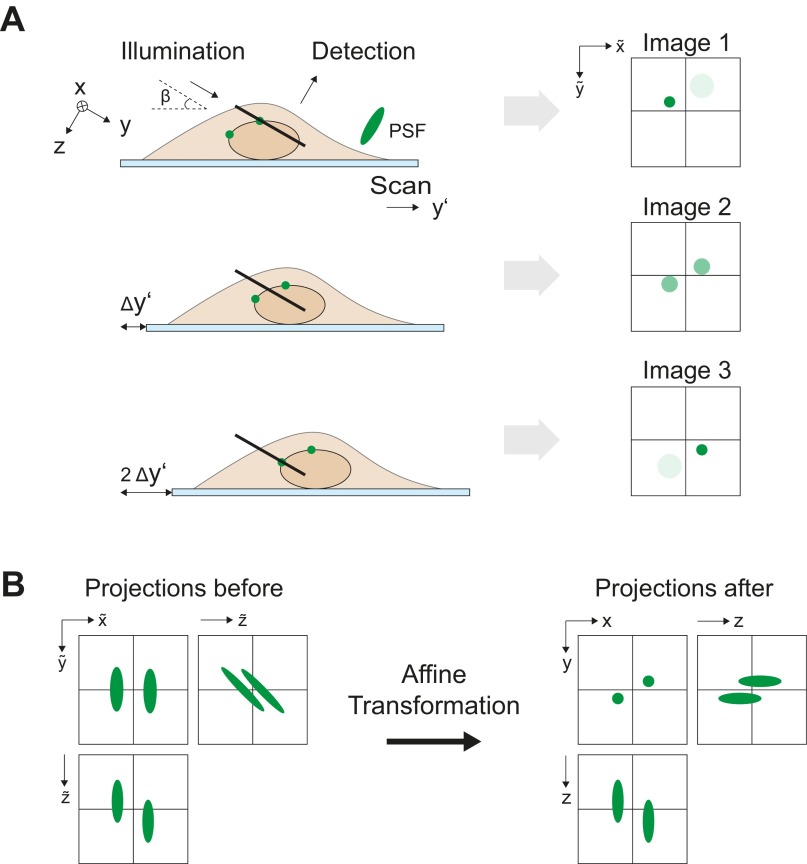
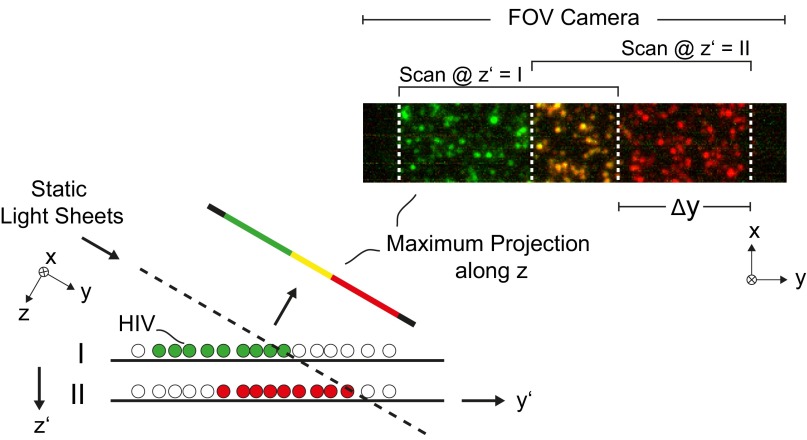
Method to determine the Rayleigh range of the effective RESOLFT LS. The experiment was intended to measure the Rayleigh range of the effective fluorescence LS which is created by switching off RSFPs above and below the focal plane of detection with LS-RESOLFT. To this end, the average axial FWHM of imaged rsEGFP2-filled HIV-1 particles was determined at several positions along the optical illumination axis (y) of the applied LSs. The distance between two y positions, denoted as Δy, is not directly given by the setup, but it can be determined from the measured data. This sketch depicts the data analysis for the example of one particular Δy. It is assumed that at a vertical position of the sample z′ = I, the LS hits the HIV-1 particles on the coverslip at the position of minimal beam waist along the y direction. The sample is scanned and imaged with the same parameters as described in the single-HIV-1 experiment. In the next step of the experiment, the sample is moved downward to z′ = II. At the position where the LS hits the sample, the LS thickness is increased. The sample is scanned with the same parameters as in the first step. After an affine transformation as described in Fig. S2, the maximum projections along the z axis of both image stacks are color coded and overlapped. White dashed lines in the figure mark the start and the end of the scanned FOV for each scan step. The distance between the start positions of the two scans is equal to the distance Δy of the second scan position to the position of minimal beam waist along the optical illumination axis.
We conclude that the axial resolution is not limited conceptually, but merely by the available off-switching power and, more crucially, the photophysical properties of the present RSFPs. Designed for axial resolution improvement, the results presented in Fig. 2C additionally suggest a moderate (up to ∼15%) decrease in extracted particle diameters along the lateral direction by LS-RESOLFT (at maximal switch-off power). We maintain that this is due to better definition of the objects owing to improved image contrast. Importantly, FWHM values measured at different positions along the illumination axis indicate that the Rayleigh range of the RESOLFT LS is sufficiently long to uniformly switch-off fluorophores in an entire section of a cell (Fig. 2D).
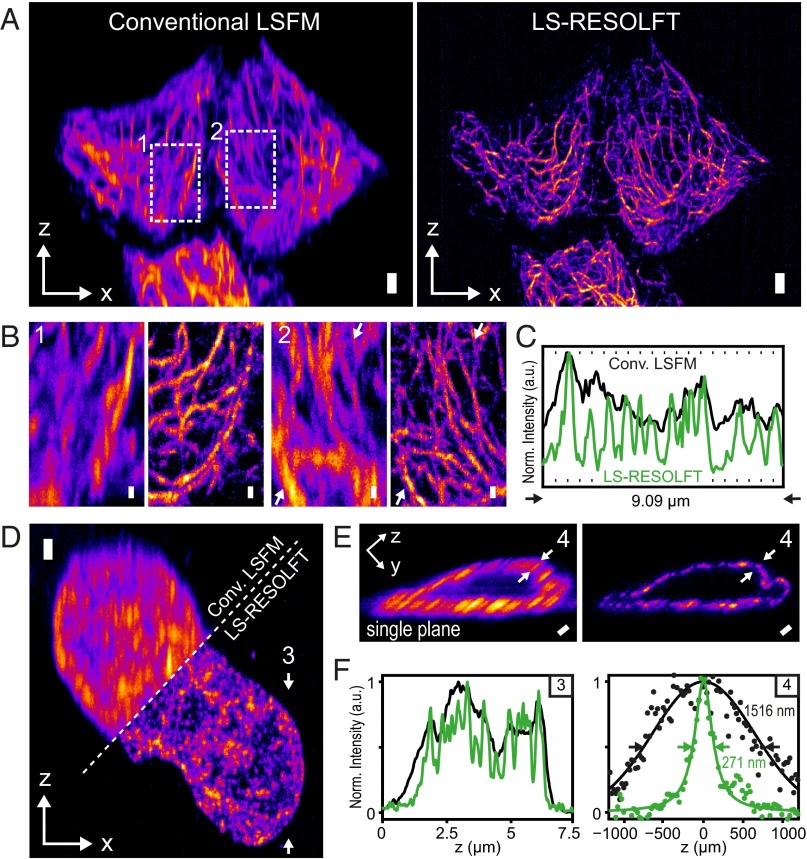
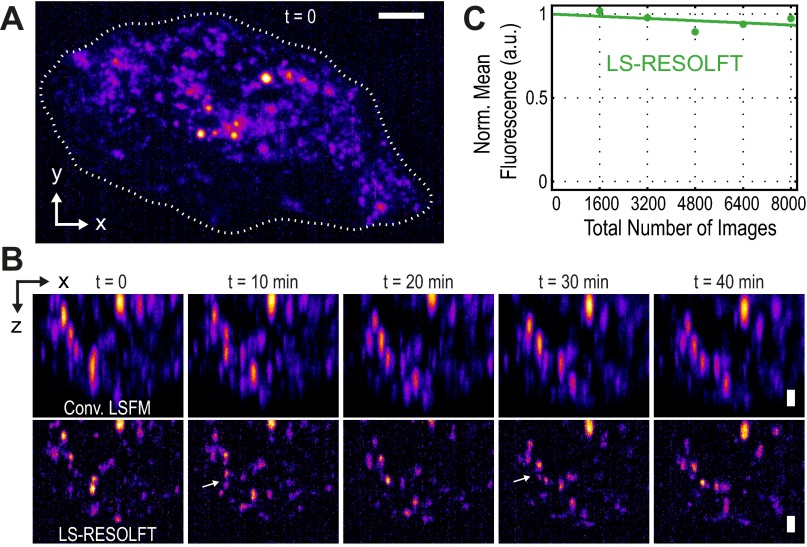
We also demonstrate the imaging capabilities of LS-RESOLFT on the cytoskeleton of living HeLa cells (Fig. 3 A–C, Fig. S7, and Movies S2 and S3). The structural protein keratin-19 was labeled by fusion of the recently developed rsEGFP variant rsEGFP(N205S), which has slower off-switching kinetics than other rsEGFPs but, at the same time, offers more photons per unit time when in the on state. After activation at 350 µW for 10 ms, the double-sheeted off-switching beam (6.9 mW) was applied for 100 ms, followed by readout for 60 ms at 150 µW. All powers were measured close to the back-focal plane of the illumination objective. To directly visualize the improvement in resolution, a conventional LSFM image is subsequently taken at the same scan position (activated and read out with the same light doses and exposure times as for the LS-RESOLFT image, yet without off-switching). LS-RESOLFT imaging of NUP214, a constituent protein of the nuclear pore complex fused to three rsEGFP(N205S) proteins in living U2OS cells, shows a gain in resolution by a factor of 5.6 (Fig. 3 D–F). The advantage of reduced photobleaching that is typical of standard LSFM and benefits long-term acquisition of samples is conserved in LS-RESOLFT (Fig. S8). Phototoxic effects induced by the RESOLFT imaging protocol were certainly minimal, as imaged cells kept dividing after imaging (Fig. S9).
Fig. 3.
Conventional LSFM and LS-RESOLFT images of the keratin-19 network and a structural protein of the nuclear pore complex in living cells. (A–C) The superior resolving power of LS-RESOLFT is demonstrated in x-z maximum intensity projections of a recorded image stack showing keratin-19 filaments tagged with rsEGFP(N205S) in HeLa cells. A stack of 1,200 images per imaging technique was recorded with a step size of 50 nm, which results in a total volume of 82 × 47 × 30 μm3. The voxel size is set to 108.3 × 108.3 × 50 nm3 [(Δx = 108.3 × Δz = 50) nm are represented as square pixels; versions with isotropic pixels in Fig. S10]. (A) The LS-RESOLFT image exhibits much thinner features than conventional LSFM; keratin-19 strands are clearly separable even in dense areas. (Scale bar width and height, 2 μm.) (B) Zoom-ins on two areas in the sample highlight the imaging capabilities of LS-RESOLFT. They show an x-z area of 10.7 × 7.8 μm2. (Scale bar width and height, 500 nm.) (C) Normalized intensity profiles along the line between the white arrowheads in zoom-in 2 reveal individual peaks for separated keratin-19 strands in the LS-RESOLFT mode (green) which cannot be resolved in conventional LSFM (black). (D) Maximum intensity projections along the illumination axis y of a living U2OS cell expressing Nup214-3x-rsEGFP(N205S) are shown for conventional LSFM and LS-RESOLFT. A stack of 400 images was recorded with a step size of 50 nm, which results in a total volume of 43 × 34 × 20 μm3. The voxel size is set to 108.3 × 108.3 × 50 nm3. Square pixels with the above sampling are displayed. (Scale bar width and height, 1 μm.) (E) The resolution enhancement by RESOLFT (Right) compared with conventional LSFM (Left) is highlighted in a single y-z section through the nucleus. Note that for display the image was rotated by 30° around the x axis. (Scale bar width and height, 1 μm.) (F) A line profile along the direction indicated by the arrowheads in D is plotted. Enabled by a RESOLFT LS thickness below the diffraction limit, LS-RESOLFT (green line) reveals distinct peaks which cannot be distinguished in diffraction-limited conventional LSFM (black line). A line profile through a nuclear pore complex marked in E is plotted for the diffraction-limited LSFM (black dots) and LS-RESOLFT (green dots) modes. Gaussian (black) and Lorentzian (green) fits to the conventional LSFM and LS-RESOLFT data points, respectively, reveal an increase in axial resolution of more than a factor of 5 for LS-RESOLFT.
Fig. S7.
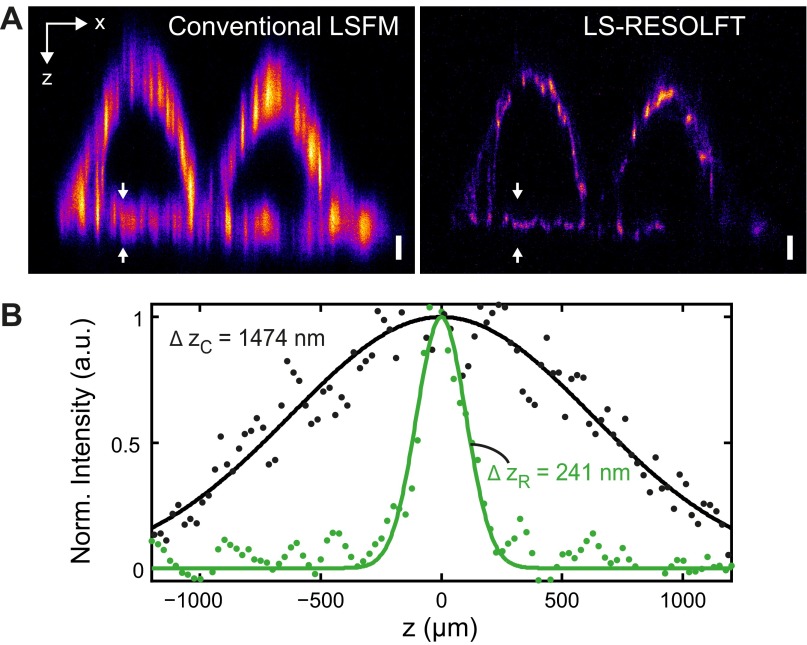
LS-RESOLFT of the intracellular keratin network in living cells. (A) The superior axial resolution of our LS-RESOLFT nanoscope compared with conventional LSFM is demonstrated on a single keratin-19 filament tagged with rsEGFP(N205S) in a HeLa cell. An x-z cross-section through the same image stack as displayed in Fig. 3 A–C clearly shows the improved z resolution. The image dimensions are 70 × 11 μm2 with a pixel size in both images of 108.3 nm in x- and 25 nm in the z direction. (Scale bar width and height, 1 µm.) (B) The axial intensity profile along a line through the same single keratin-19 strand is plotted for conventional LSFM (black dots) and LS-RESOLFT (green dots), respectively. The x position of the line profiles is marked by white arrows in the images. LS-RESOLFT here improves the axial resolution by a factor of 6.1 compared with conventional LSFM, as revealed by the FWHMs of Gaussian fits to the data.
Fig. S8.
Live-cell LS-RESOLFT imaging of HIV-1 assembly sites. (A) The HIV-1 assembly at the cell membrane of a HeLa cell was recorded over more than 40 min in LS-RESOLFT and conventional LSFM mode. An x-y maximum intensity projection of an LS-RESOLFT image stack taken at a time point t = 0 serves as an overview image. A white dashed line marks the boundaries of the living cell. A total volume of 45 × 26 × 7.5 μm3 was recorded and the voxel size is set to 108.3 × 108.3 × 50 nm3. Square pixels are shown. (Scale bar, 5 μm.) (B) The maximum intensity projections along the illumination axis of five image stacks taken in conventional LSFM (Top Row) and LS-RESOLFT mode (Bottom Row) are shown. The images were cropped to a size of 19 × 7.5 μm2. (Scale bar width and height, 1 μm.) The same cell was recorded at a time interval of 10 min. The superior axial resolution of LS-RESOLFT reveals HIV-1 assembly sites which cannot be distinguished in diffraction-limited LSFM. Two of these regions in the cell are highlighted by white arrows. In a living cell, HIV-1 assembly sites imaged with LS-RESOLFT become accessible to observation in three dimensions over time. (C) LS illumination and the low switching fatigue of rsEGFP2 proteins contribute to the ability to record a total number of 8,000 frames of the same cell without significant reduction in mean fluorescence. The data points are fitted with a linear function.
Fig. S9.
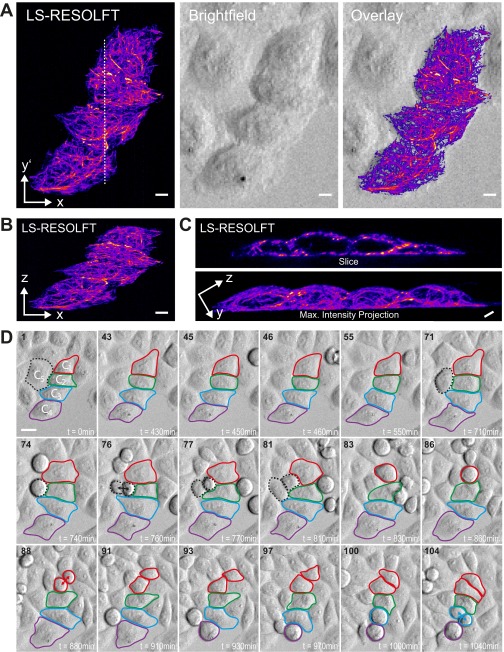
Cell viability is not affected by LS-RESOLFT nanoscopy, as shown by occurrences of cell division. HeLa cells expressing keratin-19 fused to rsEGFP(N205S) imaged with LS-RESOLFT (using the same imaging parameters as in Fig. 3) exhibited no visual signs of photodamage (such as morphological changes, membrane blebbing, or other) upon imaging. Cell cycles were not arrested; cells throughout the imaged FOV (which is illuminated planewise with sequences of the activation, off-switching, and readout light) kept dividing, including the subset of transfected cells targeted for LS-RESOLFT nanoscopy. Unperturbed cell divisions are widely considered as the best indication for a low-stress cellular environment (and a “gold-standard” assay for cell viability). Directly after LS-RESOLFT nanoscopy (A–C), cells were transferred to an examination microscope (bright-field, Zeiss Cell Observer) and monitored at physiological conditions (37 °C, 5% CO2) for many hours to assay the state of cells and register subsequent cell division events. (D) During a set observation period of 1,040 min (>17 h), several cells underwent division, as indicated by the color scheme with arrows for some divisions. Selected frames from a time-lapse experiment are shown; divisions occur both for transfected cells (C1–C4) and untransfected cells (an example is labeled as C5). (Scale bars in A–C, 5 µm.) A y-z slice through the cells along the white dashed line in A as well as a maximum intensity projection along the x axis is shown in C. (Scale bar in D, 20 µm.) The example shown is representative of our observations in four separate experiments.
Fig. S10.
LS-RESOLFT nanoscopy images from Figs. 2 and 3 rerepresented with isotropic pixels. (A) Replot of Fig. 2A. (B) Replot of Fig. 3A. (C) Replot of Fig. 3B. (D) Replot of Fig. 3D. (Scale bars are as indicated in the main figures.)
SI Materials and Methods
Optical Setup.
Our LS-RESOLFT nanoscope uses laser beams of three fast-switching continuous-wave diode lasers which are formed to LSs in the focal plane of the water-dipping illumination objective (CFI Plan Fluor 10XW, Nikon, N.A. 0.3). Light of a UV laser (iBeam Smart 405–60, Toptica Photonics) with a nominal wavelength of 405 nm and maximal power of 60 mW activates RSFPs in the sample. The off-switching light pattern is generated by a second diode laser (iBeam Smart PT488-50, Toptica Photonics, 488 nm, 50 mW). After the off-switching process, the remaining activated RSFPs are read out using a third laser (LuxX 488–60, Omicron-Laserage Laserprodukte, 488 nm, 60 mW) with the same nominal wavelength. The lasers are spectrally and spatially filtered with narrow bandpass filters (FF02-482/18–25, FF01-406/15–25, Semrock) and polarization-maintaining single-mode fibers (M460-HP, Thorlabs), respectively. At the fiber output, the beam diameter of each laser is independently controlled with achromatic doublets to compensate for potential longitudinal chromatic aberrations in the focal plane. The off-switching intensity pattern is generated by a half-moon phase plate which is placed on the optical axis of the collimated off-switching laser beam (Fig. S1 E and F). It consists of two quartz blocks mounted in parallel on a multiaxis positioner (LP-1A, Newport Corporation), which tilts the blocks with respect to each other to generate a phase difference between the beam halves. The modified beam is subsequently combined with the beam path of the readout laser by a 50:50 beam-splitting cube (BS013, Thorlabs). A dichroic mirror (Di02-R442, Semrock) merges the expanded UV beam with the readout and the off-switching laser. A common beam expander consisting of two achromatic lenses adjusts the beam widths to the pupil diameter of the illumination objective. The polarization state of the laser beams for activation, excitation, and switch-off is adjusted by a Glan–Thompson prism (PGT 1.10, B. Halle) and a half-wave plate, and the zero-intensity region's characteristics evaluated on gold particles (Fig. S3 G–J). A cylindrical lens (fCL = 150 mm) focuses the collinear beams into the back-aperture of the illumination objective, which generates an LS at an angle β = 30° with respect to the horizontal plane. The detection objective (CFI Apo 40XW NIR, Nikon, N.A. 0.8) is oriented perpendicular to the x-y plane of the LS and thus has an angle of 60° with respect to the coverslip. These angles were chosen such that, theoretically, any commercially available water-dipping detection objective lens today can use its full aperture for collection of fluorescence light. Additionally, undesired artifacts potentially caused by direct reflections of the illumination laser light from the coverslip surface are reduced. Both the illumination and detection objectives are held by a monolithic objective mount unit which is connected to a standard breadboard by a kinematic mount consisting of a system of balls, vee-grooves, and magnets, and can be lifted for conveniently replacing the sample or the objectives (Fig. S1B). The objective lenses can be moved along their optical axes by linear stages (M-SDS40 Precision, Newport Corporation). The relative lateral position of the objectives can be precisely adjusted with a home-built flexure design. The detection objective is part of a wide-field microscope consisting of two identical emission bandpass filters (FF03-525/50–25, Semrock) and a tube lens (fTL = 300 mm, Nikon) focusing the fluorescence onto a 4-megapixel (2,048 × 2,048 pixels) sCMOS camera (ORCA-Flash4.0 V2, Hamamatsu). The focal length of the tube lens was chosen such that the 6.5-µm square pixels on the camera projected to a sampling size of 108.3 nm in the specimen space. For optimal LS-RESOLFT imaging speed, the camera is rotated by β so that the readout lines of the sensor are aligned along the x direction. A cropped FOV along the y direction thus considerably shortens the required readout time and increases the overall frame rate. For imaging, a standard round glass coverslip with a diameter of 5 mm is clipped onto a platform at the bottom of a medium-filled specimen chamber made of biocompatible polyetheretherketone (PEEK), which features a comparably low linear thermal expansion coefficient and excellent resistance to a wide range of chemicals (Fig. S1 C and D). On one side of the chamber, a glass window is inserted, through which the LSs can be imaged from the side (Fig. 1 B, D, and F). To accurately and reproducibly align the longer horizontal axis of the specimen chamber relative to the scan direction, its lateral movement is kinematically constrained by a system of balls, vee-grooves, and magnets. A piezoelectric stage (P-625.1CL, PIHera Piezo Linear Stage, Physik Instrumente) with a minimal step size of 10 nm and a total range of 500 µm scans the sample in steps through the static LSs. A preset step response time of 102 ms/µm assures a stable scan throughout the measurement. The scanner is attached to a multiaxis positioning stage (562 ULTRAlign Precision, Newport Corporation), with which the sample can be centered in the FOV of detection.
Image Acquisition and Representation.
All electronic devices in the setup, i.e., lasers, camera, and the stage scanner are controlled by custom software composed in LabVIEW. An FPGA (field-programmable gate array) (NI PCIe-7841R, National Instruments) simultaneously sends a predefined sequence of analog and digital signals to the devices to assure synchronization of the scanning process and image acquisition. For a single 2D LS-RESOLFT image, a sequence of three successive laser triggers is used: First, molecules are switched to the on state (“activation”) with an LS at 405 nm. Then, a short illumination pause of 2 ms is followed by an off-switching pulse, which is typically longer than the activation period. After another pause of 2 ms, signal for the actual subdiffraction LS-RESOLFT image is acquired while illuminating the sample with the excitation laser at 488 nm, and stored on a separate camera PC. We set the total acquisition time per scanning step to 94 ms (activation, 10 ms; off-switching, 30 ms; readout, 50 ms) and 174 ms (10 ms, 100 ms, 60 ms) for rsEGFP2 and rsEGFP(N205S) samples, respectively. To directly visualize the resolution improvement by LS-RESOLFT, a conventional diffraction-limited LSFM image is taken in a second activation and readout cycle with the same exposure time and light intensity. Finally, the stage scanner moves to the next position where another illumination cycle starts. By translating the scanner only in the horizontal plane, the biological sample always remains positioned at the minimal LS waist. This ensures that the sample is imaged with the same axial resolution at any scan position. In principle, a very large area (i.e., volume), up to the maximal scanning range of the scanner, can be imaged with this method.
Image data recorded in RESOLFT nanoscopes and standard LS typically do not require any postprocessing such as fitting, denoising, or restoration. The excellent signal-to-noise ratio characteristic for both techniques corroborates this fact. Their combination in LS-RESOLFT nanoscopy benefits from these advantages. The strength of the new instrument is best demonstrated in image cross-sections perpendicular to the optical axis of the LSs. Single slices in the x-z and y-z planes are of particular interest for ascertaining the achieved axial resolution of the LS-RESOLFT method. In projections of maximum intensity of multiple slices along y and x, respectively, the separation of objects with a distance below the diffraction limit can be demonstrated. For this, the recorded images are affinely transformed to the coordinate system of the LS using a custom MATLAB script (Fig. S2). It should be noted that this procedure rearranges the acquired data without changing its raw character.
HIV-1 Particle Preparation.
The pCHIV-rsEGFP2 plasmid was derived from pCHIV (31), which contains the complete HIV-1 coding sequence except for nef with deletions in noncoding regions rendering it noninfectious. The rsEGFP2 coding sequence was inserted close to the 3′ end of the matrix coding region of the structural gag gene as previously described for other fluorescent proteins (32). Using polyethylenimine as transfection reagent, 293 T cells were transfected in a 1:1 ratio with the pCHIV and pCHIV-rsEGFP2. Two days posttransfection the cellular supernatant was harvested and purified by ultracentrifugation through a 20% (wt/vol) sucrose cushion at 130.000 × g for 90 min at 4 °C. Particle pellets were resuspended in PBS and stored at −80 °C. A standard round glass coverslip was cleaned with absolute ethanol and air-dried. A drop of HIV-1 particles diluted in PBS was incubated on the coverslip for 10 min. The coverslip was then carefully rinsed with PBS. HIV-1 samples were imaged at room temperature in FluoroBrite DMEM.
Mammalian Cell Culture.
A pool of transiently transfected and subsequently FACS-sorted HeLa Kyoto cells expressing keratin-19-rsEGFP(N205S) was grown in DMEM containing phenol red, l-glutamine, and high glucose supplemented with 10% (vol/vol) FBS, 1% sodium pyruvate, and geneticin selective antibiotic at a final concentration of 1 mg/mL. For live-cell experiments with the LS-RESOLFT nanoscope, ∼1 × 10⁵ cells were seeded on a round coverslip in a 24-well and grown for 24 h. Three hours before imaging, the selection medium was exchanged by DMEM containing Hepes (but no phenol red, to reduce unwanted background caused by phenol red uptake). Immediately before imaging, the coverslip was washed with PBS. The cells were imaged at room temperature in FluoroBrite DMEM. U2OS cells were grown in McCoy’s 5A modified medium containing phenol red, l-glutamine, high glucose, and bacto-peptone supplemented with 1% FCS, 1% glutamine, 1% nonessential amino acids, and 1% penicillin streptomycin. For live-cell LS-RESOLFT imaging, 4 × 10⁴ cells were grown on a round coverslip placed in a 24-well for 24 h. Then, the cells were transiently transfected with the construct NUP214-3x-rsEGFP(N205S) and FugeneHD according to the manufacturer’s guidelines. After an incubation time of 72 h, the growth medium was exchanged by DMEM containing Hepes but no phenol red. Immediately before imaging, the coverslip was washed three times with PBS. The cells were imaged at room temperature in FluoroBrite DMEM. To obtain the NUP214-3x-rsEGFP(N205S) construct, the DNA of the NUP214-gene was amplified per PCR from a pNUP214-EGFP plasmid and subcloned into a backbone that was obtained before by introducing a triple-rsEGFP(N205S) into a pmEGFP-N1 vector.
Calculation of the Gain in Speed by LS-RESOLFT Over Z-Doughnut RESOLFT Strategies.
LS-RESOLFT nanoscopy offers highly parallelized 3D imaging with subdiffraction axial resolution. In the technical realization presented here, the LSs are generated such that the FOV in the x direction is solely determined by the physical size of the camera chip in this direction sx,cam and the overall magnification of the detection path Mdet:
where m is the number of acquired pixel columns, px,cam is the physical size of a camera pixel in x, and dx is the sampling size of the detection focal plane in x. The FOV in the y direction is defined by twice the Rayleigh range yR of the LSs in illumination direction:
Here, n denotes the number of pixels in the y direction, py,cam is the physical size of a camera pixel in y, and dy is the sampling size of the detection focal plane in y.
Typically Mdet is set such that the lateral sampling of the acquired image is at least threefold higher than the diffraction limit to fulfill the Nyquist sampling criterion. For squared pixels px,cam = py,cam = pcam, and dx = dy = d.
The LS-RESOLFT nanoscope presented here acquires a single plane in one switching cycle with a switching time t, a pixel size of 6.5 µm, a magnification Mdet = 60, and a lateral sampling in x and y of dLS = 108.3 nm.
For a fair comparison we assume a point-scanning RESOLFT nanoscope which achieves the same subdiffraction axial resolution using a z-doughnut off-switching light pattern generated through a high-N.A. objective. The lateral resolution may be limited to 240 nm by diffraction, which results in a lateral sampling size of . For the same switching kinetics of the fluorophores the pixel dwell time is t.
The gain G in speed by LS-RESOLFT nanoscopy compared with a z-doughnut RESOLFT strategy for the same FOV and subdiffraction axial resolution is then
where TPS and TLS are the respective total acquisition times for one plane. For a maximal FOV of 221 × 28 µm2, we obtain a gain factor of 279,378.
Discussion and Conclusions
We have demonstrated RESOLFT LS nanoscopy, enabling inherently parallelized 3D imaging with subdiffraction axial resolution. Several living samples labeled with one of the recently developed rsEGFP variants were recorded at low light intensity levels. The axial resolution of LS-RESOLFT is superior to any other LSFM variants, such as Bessel-beam LSs or implementations based on structured illumination, which do not implement molecular-state transitions for feature separation––and therefore do not neutralize the resolution-limiting role of diffraction (19–21, 30). A sample- and power-dependent improvement by a factor of 5–12 has already been achieved, which clearly outperforms the previous STED-LS approach, where a gain in axial resolution by <1.5-fold was reported for dye-filled particles only, and at much higher light doses (28).
Clearly, the spatial resolution (i.e., information) increase––as it necessitates a greater number of sampling steps in space to satisfy Nyquist, and as it requires time to perform the state switching––must be inevitably accompanied by an overall somewhat reduced acquisition rate. This is a common inherent feature of all nanoscopy approaches separating neighboring fluorophores by on–off transitions (2). As in all RESOLFT approaches, however, spatial resolution is––advantageously––readily and freely tunable (compare Fig. 2C), and fewer steps may be sampled in space at accordingly faster rates per volume stack. At ∼100 ms per frame, recording speed in this first demonstration is up to about an order of magnitude slower than conventional LS imaging, which reads out coarser fluorescent volumes. Note that the physical reduction by LS-RESOLFT of the specimen section in which the fluorescent on state remains allowed per scanning step implies on average fewer fluorophores present per section. Examination of typical images with LS-RESOLFT revealed signal-to-background ratios between ∼3:1 and ∼12:1 for imaging experiments with HIV-1 particles depending on label incorporation, and ∼7:1 to ∼12:1 for keratin strands (comparing to directly neighboring dark regions)––at the conservatively chosen frame durations in these proof-of-principle experiments. Ongoing improvements in switchable fluorophore characteristics, notably in terms of fluorescence quantum yield and switching speed, are expected to further improve temporal resolution of the RESOLFT approaches in general, including this highly parallelized LS variant.
The capability to create optical sections of ∼100-nm thickness is similar to the axial resolving power of a typical TIRF (total internal reflection fluorescence) microscope, yet with a decisive difference: Whereas TIRF produces only one slice that is tightly confined to the coverslip surface, LS-RESOLFT offers subdiffraction axial resolution in any slice throughout the entire specimen and can thus be applied to a broad range of (not just) cell-biological questions. Due to the low off-switching intensities, LS-RESOLFT allows live-cell imaging of biological samples over extended time periods. Large FOVs are possible, as entire planes are being captured at once, without the need for sequential lateral readout. Acquisition time is thus reduced by a factor given by the number of pixels per FOV compared with confocal “z-doughnut” RESOLFT strategies achieving similar xyz resolution for identical volumes (SI Materials and Methods). Because off-switching and readout are performed at the same wavelength, potential chromatic aberrations are inherently avoided. Recordings with spectrally distinct RSFPs will in the future allow colocalization studies in subdiffraction volumes. Looking ahead, LS-RESOLFT can be equipped with an option to additionally superresolve along the lateral dimensions. Because the present LS-RESOLFT design employs independent beam paths for illumination and detection of the sample, the same concepts which lead to conceptually diffraction-unlimited lateral resolution and use wide-field detection can also be applied to LS-RESOLFT. One possible approach combines LS-RESOLFT with the previously demonstrated parallelized 2D RESOLFT technique (10).
Materials and Methods
Detailed descriptions of the optical setup, the image acquisition and representation, sample preparation including mammalian cell culture, as well as a discussion of the acquisition speed gains enabled by the highly parallelized LS readout, are provided in SI Materials and Methods. In brief, LS-RESOLFT nanoscopy at low light levels was demonstrated with custom-built optics, featuring two water-dipping objective lenses in perpendicular configuration: an illumination objective (10×/0.3 N.A.) to create three LSs for activation, off-switching, and readout of RSFPs, and a detection objective (40×/0.8 N.A.) for collection of sample fluorescence in the wide field. Laser beam paths were coaligned, expanded, and focused by a common cylindrical lens into the back aperture of the illumination objective. The activation (405 nm) and readout (488 nm) LSs featured conventional geometries. The switch-off beam (488 nm) was modulated by a phase retardation plate (Fig. S1) to produce, after focusing by the objective, an off-switching light distribution with a central plane of minimal intensity (the “zero”). Scanning of the specimen through the LSs acquired images plane by plane.
Supplementary Material
Acknowledgments
We thank Jan Ellenberg and Anna Szymborska-Mell (both European Molecular Biology Laboratory) for vectors, and Barbara Müller (Heidelberg University) for vectors and cloning, and all of them, as well as Tim Grotjohann (Max Planck Institute for Biophysical Chemistry), for helpful discussions. S.W.H. acknowledges the Federal Ministry of Education and Research for funding this work within the project STEDlight (FKZ:13N11173).
Footnotes
Conflict of interest statement: S.W.H. benefits through patents on the basic RESOLFT concept held by the Max Planck Society.
This article is a PNAS Direct Submission.
This article contains supporting information online at www.pnas.org/lookup/suppl/doi:10.1073/pnas.1522292113/-/DCSupplemental.
References
- 1.Hell SW. Toward fluorescence nanoscopy. Nat Biotechnol. 2003;21(11):1347–1355. doi: 10.1038/nbt895. [DOI] [PubMed] [Google Scholar]
- 2.Hell SW. Microscopy and its focal switch. Nat Methods. 2009;6(1):24–32. doi: 10.1038/nmeth.1291. [DOI] [PubMed] [Google Scholar]
- 3.Hell SW, Wichmann J. Breaking the diffraction resolution limit by stimulated emission: Stimulated-emission-depletion fluorescence microscopy. Opt Lett. 1994;19(11):780–782. doi: 10.1364/ol.19.000780. [DOI] [PubMed] [Google Scholar]
- 4.Hofmann M, Eggeling C, Jakobs S, Hell SW. Breaking the diffraction barrier in fluorescence microscopy at low light intensities by using reversibly photoswitchable proteins. Proc Natl Acad Sci USA. 2005;102(49):17565–17569. doi: 10.1073/pnas.0506010102. [DOI] [PMC free article] [PubMed] [Google Scholar]
- 5.Grotjohann T, et al. Diffraction-unlimited all-optical imaging and writing with a photochromic GFP. Nature. 2011;478(7368):204–208. doi: 10.1038/nature10497. [DOI] [PubMed] [Google Scholar]
- 6.Brakemann T, et al. A reversibly photoswitchable GFP-like protein with fluorescence excitation decoupled from switching. Nat Biotechnol. 2011;29(10):942–947. doi: 10.1038/nbt.1952. [DOI] [PubMed] [Google Scholar]
- 7.Grotjohann T, et al. rsEGFP2 enables fast RESOLFT nanoscopy of living cells. eLife. 2012;1:e00248. doi: 10.7554/eLife.00248. [DOI] [PMC free article] [PubMed] [Google Scholar]
- 8.Gustafsson MGL. Nonlinear structured-illumination microscopy: Wide-field fluorescence imaging with theoretically unlimited resolution. Proc Natl Acad Sci USA. 2005;102(37):13081–13086. doi: 10.1073/pnas.0406877102. [DOI] [PMC free article] [PubMed] [Google Scholar]
- 9.Schwentker MA, et al. Wide-field subdiffraction RESOLFT microscopy using fluorescent protein photoswitching. Microsc Res Tech. 2007;70(3):269–280. doi: 10.1002/jemt.20443. [DOI] [PubMed] [Google Scholar]
- 10.Chmyrov A, et al. Nanoscopy with more than 100,000 ‘doughnuts’. Nat Methods. 2013;10(8):737–740. doi: 10.1038/nmeth.2556. [DOI] [PubMed] [Google Scholar]
- 11.Voie AH, Burns DH, Spelman FA. Orthogonal-plane fluorescence optical sectioning: Three-dimensional imaging of macroscopic biological specimens. J Microsc. 1993;170(Pt 3):229–236. doi: 10.1111/j.1365-2818.1993.tb03346.x. [DOI] [PubMed] [Google Scholar]
- 12.Fuchs E, Jaffe J, Long R, Azam F. Thin laser light sheet microscope for microbial oceanography. Opt Express. 2002;10(2):145–154. doi: 10.1364/oe.10.000145. [DOI] [PubMed] [Google Scholar]
- 13.Huisken J, Swoger J, Del Bene F, Wittbrodt J, Stelzer EHK. Optical sectioning deep inside live embryos by selective plane illumination microscopy. Science. 2004;305(5686):1007–1009. doi: 10.1126/science.1100035. [DOI] [PubMed] [Google Scholar]
- 14.Dodt H-U, et al. Ultramicroscopy: Three-dimensional visualization of neuronal networks in the whole mouse brain. Nat Methods. 2007;4(4):331–336. doi: 10.1038/nmeth1036. [DOI] [PubMed] [Google Scholar]
- 15.Wu Y, et al. Inverted selective plane illumination microscopy (iSPIM) enables coupled cell identity lineaging and neurodevelopmental imaging in Caenorhabditis elegans. Proc Natl Acad Sci USA. 2011;108(43):17708–17713. doi: 10.1073/pnas.1108494108. [DOI] [PMC free article] [PubMed] [Google Scholar]
- 16.Keller PJ, Stelzer EHK. Quantitative in vivo imaging of entire embryos with digital scanned laser light sheet fluorescence microscopy. Curr Opin Neurobiol. 2008;18(6):624–632. doi: 10.1016/j.conb.2009.03.008. [DOI] [PubMed] [Google Scholar]
- 17.Engelbrecht CJ, Stelzer EH. Resolution enhancement in a light-sheet-based microscope (SPIM) Opt Lett. 2006;31(10):1477–1479. doi: 10.1364/ol.31.001477. [DOI] [PubMed] [Google Scholar]
- 18.Capoulade J, Wachsmuth M, Hufnagel L, Knop M. Quantitative fluorescence imaging of protein diffusion and interaction in living cells. Nat Biotechnol. 2011;29(9):835–839. doi: 10.1038/nbt.1928. [DOI] [PubMed] [Google Scholar]
- 19.Fahrbach FO, Simon P, Rohrbach A. Microscopy with self-reconstructing beams. Nat Photonics. 2010;4(11):780–785. [Google Scholar]
- 20.Planchon TA, et al. Rapid three-dimensional isotropic imaging of living cells using Bessel beam plane illumination. Nat Methods. 2011;8(5):417–423. doi: 10.1038/nmeth.1586. [DOI] [PMC free article] [PubMed] [Google Scholar]
- 21.Gao L, et al. Noninvasive imaging beyond the diffraction limit of 3D dynamics in thickly fluorescent specimens. Cell. 2012;151(6):1370–1385. doi: 10.1016/j.cell.2012.10.008. [DOI] [PMC free article] [PubMed] [Google Scholar]
- 22.Durnin J, Miceli JJ, Jr, Eberly JH. Comparison of Bessel and Gaussian beams. Opt Lett. 1988;13(2):79–80. doi: 10.1364/ol.13.000079. [DOI] [PubMed] [Google Scholar]
- 23.Wu Y, et al. Spatially isotropic four-dimensional imaging with dual-view plane illumination microscopy. Nat Biotechnol. 2013;31(11):1032–1038. doi: 10.1038/nbt.2713. [DOI] [PMC free article] [PubMed] [Google Scholar]
- 24.Siebrasse JP, Kaminski T, Kubitscheck U. Nuclear export of single native mRNA molecules observed by light sheet fluorescence microscopy. Proc Natl Acad Sci USA. 2012;109(24):9426–9431. doi: 10.1073/pnas.1201781109. [DOI] [PMC free article] [PubMed] [Google Scholar]
- 25.Zanacchi FC, et al. Live-cell 3D super-resolution imaging in thick biological samples. Nat Methods. 2011;8(12):1047–1049. doi: 10.1038/nmeth.1744. [DOI] [PubMed] [Google Scholar]
- 26.Zhao ZW, et al. Spatial organization of RNA polymerase II inside a mammalian cell nucleus revealed by reflected light-sheet superresolution microscopy. Proc Natl Acad Sci USA. 2014;111(2):681–686. doi: 10.1073/pnas.1318496111. [DOI] [PMC free article] [PubMed] [Google Scholar]
- 27.Galland R, et al. 3D high- and super-resolution imaging using single-objective SPIM. Nat Methods. 2015;12(7):641–644. doi: 10.1038/nmeth.3402. [DOI] [PubMed] [Google Scholar]
- 28.Friedrich M, Gan Q, Ermolayev V, Harms GS. STED-SPIM: Stimulated emission depletion improves sheet illumination microscopy resolution. Biophys J. 2011;100(8):L43–L45. doi: 10.1016/j.bpj.2010.12.3748. [DOI] [PMC free article] [PubMed] [Google Scholar]
- 29.Carlson LA, et al. Three-dimensional analysis of budding sites and released virus suggests a revised model for HIV-1 morphogenesis. Cell Host Microbe. 2008;4(6):592–599. doi: 10.1016/j.chom.2008.10.013. [DOI] [PMC free article] [PubMed] [Google Scholar]
- 30.Chen BC, et al. Lattice light-sheet microscopy: Imaging molecules to embryos at high spatiotemporal resolution. Science. 2014;346(6208):1257998. doi: 10.1126/science.1257998. [DOI] [PMC free article] [PubMed] [Google Scholar]
- 31.Lampe M, et al. Double-labelled HIV-1 particles for study of virus-cell interaction. Virology. 2007;360(1):92–104. doi: 10.1016/j.virol.2006.10.005. [DOI] [PubMed] [Google Scholar]
- 32.Müller B, et al. Construction and characterization of a fluorescently labeled infectious human immunodeficiency virus type 1 derivative. J Virol. 2004;78(19):10803–10813. doi: 10.1128/JVI.78.19.10803-10813.2004. [DOI] [PMC free article] [PubMed] [Google Scholar]
Associated Data
This section collects any data citations, data availability statements, or supplementary materials included in this article.


