Significance
Membrane fusion is the key step in cellular traffic, which is induced by the assembly of membrane protein, namely SNARE. How the protein assembly induces membrane fusion remains unknown. Answering this question requires knowledge of the assembly intermediates, which cannot be accessed by conventional methods. We developed an instrument not only to freeze a continuous series of intermediates of SNARE assembly but also to monitor the formation of these domains. Here, we demonstrate that the N-terminal assembly is the initializing step prior to fusion.
Keywords: SNARE, SFA, transient state, FRET, N-terminal assembly
Abstract
Many prominent biological processes are driven by protein assembling between membranes. Understanding the mechanisms then entails determining the assembling pathway of the involved proteins. Because the intermediates are by nature transient and located in the intermembrane space, this determination is generally a very difficult, not to say intractable, problem. Here, by designing a setup with sphere/plane geometry, we have been able to freeze one transient state in which the N-terminal domains of SNARE proteins are assembled. A single camera frame is sufficient to obtain the complete probability of this state with the transmembrane distance. We show that it forms when membranes are 20 nm apart and stabilizes by further assembling of the SNAREs at 8 nm. This setup that fixes the intermembrane distance, and thereby the transient states, while optically probing the level of molecular assembly by Förster resonance energy transfer (FRET) can be used to characterize any other transient transmembrane complexes.
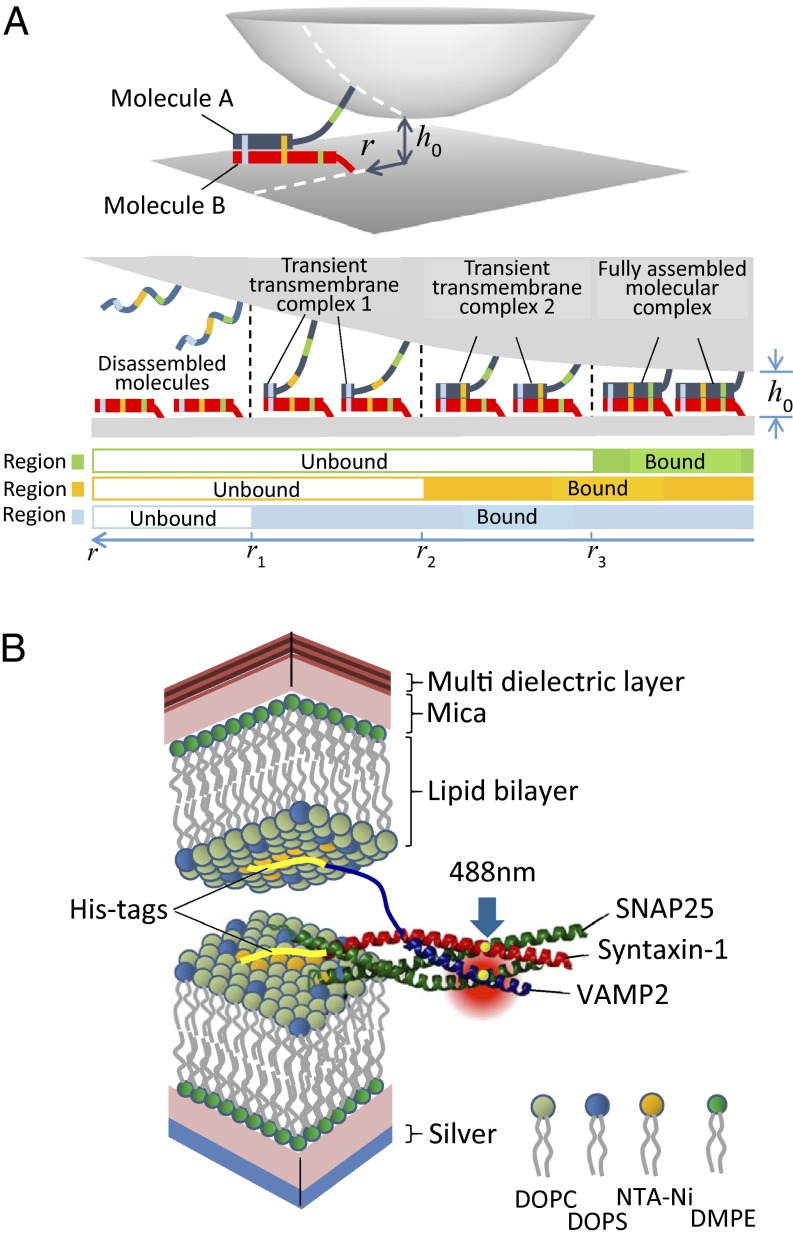
In biology, many critical protein–protein interactions occur between membrane surfaces. These interactions include cell-to-cell adhesion (1) to form tissues [e.g., cadherins (2, 3)], infection of cells by enveloped viruses (4, 5) (e.g., viral envelope fusion proteins), and secretion when a storage vesicle containing hormones or transmitters (6, 7) fuses with the plasma membrane [this fusion is achieved by soluble N-ethylmaleimide–sensitive factor attachment protein receptors (SNAREs) (8)]. In each of these examples, the biological process is thermodynamically coupled and energetically driven by protein folding/assembly. This coupling means that understanding the molecular mechanism requires a complete characterization of the various intermediate transmembrane protein complexes that appear at different intermembrane distances (Fig. 1A). Two challenges render this characterization difficult. First, because of the energy landscape, the intermediates are transient. Second, observing in the nanometer-scale gap between two membranes remains a challenge. Several existing experimental approaches provide partial information. X-ray crystallography gives atomic-level images of the proteins after folding (9, 10), providing a framework but not the pathway. With optical tweezers, continuous unfolding of single molecular complexes can be monitored (11, 12) by applying separation forces. The surface forces apparatus (SFA) (13, 14) provides the only possible way to control intermembrane separation rigidly, the main reaction coordinate of this class of folding processes, by fixing the separation between two apposed membranes with subnanometer-level precision, and allows direct measurements of forces (required to unfold the protein) (15–17) (Figs. 1 and 2). With the SFA, a continuous series of folding intermediates can be frozen and their energetics (the energy landscape) determined (15) (Fig. 1A). However, none of these techniques provide the assembling landscape (i.e., a complete view of the various intermediates that naturally occur during protein folding/assembly between membranes).
Fig. 1.
Transient transmembrane molecular intermediates: how to visualize them. (A, Upper) Two molecules assemble to form a molecular complex between a spherical surface and a flat surface, with a fixed closest separation distance, h0, at the center. This geometry is the same as the geometry in the FRET/SFA. As the surfaces come closer, the level of assembly of the molecules increases. (A, Lower) Cross-section of the Upper panel, in which the complex formed by two imaginary molecules, A and B, exhibits four distinct states: disassembled (Left), two intermediate states (Middle), and fully assembled (Right). In the case of the geometry presented here, when the surfaces are covered with molecules A and B, respectively, the level of molecular assembly varies with the distance r to the closest approach on the right-hand side of the diagram because the separation distance increases gradually with r. Hence, at a given r, because the local separation distance is fixed, assembling may only proceed until a certain level; therefore, the two molecules are trapped in an intermediate state. Then, a single snapshot is sufficient to observe all of the intermediate states at various r values, and therefore at all separation distances. In the presented situation, when r is larger than r1, molecules A and B are not bound. Between r1 and r2, they are in intermediate state 1; between r2 and r3, intermediate state 2 is reached; and below r3, the complex is fully assembled. Considering three regions in molecules A and B, a membrane distal region (blue), a middle region (orange), and a membrane proximal region (green), each state can be fully identified. When none of the regions are bound, the molecules are disassembled. If the blue regions are the only ones bound, the molecular complex is in the transient intermediate state 1. If the blue and orange regions are assembled, but not the green ones, it is in intermediate state 2. When all regions are bound, the complex is fully assembled. (B) SNARE proteins are used to represent molecules A and B. They zipper into a four-helix coiled-coil between the membranes. In vivo, the progression of the zippering brings the two membranes together and drives them to fuse. The cytosolic domains are His-tagged to be bound to NTA-Ni lipids, mimicking the natural transmembrane anchorage. Membranes are deposited on a mica sheet, the other side of which is coated with either silver (Lower mica) or a custom-made multi-dielectric layer (Upper mica). This setup allows the simultaneous measurement of the intermembrane separation distance by interferometry and the visualization of FRET signal between SNAREs that are labeled with dyes in their N-terminal regions (excitation at 488 nm). The intermembrane distance can be frozen, just as in A, in which case all intermembrane distances can be observed along r.
Fig. 2.
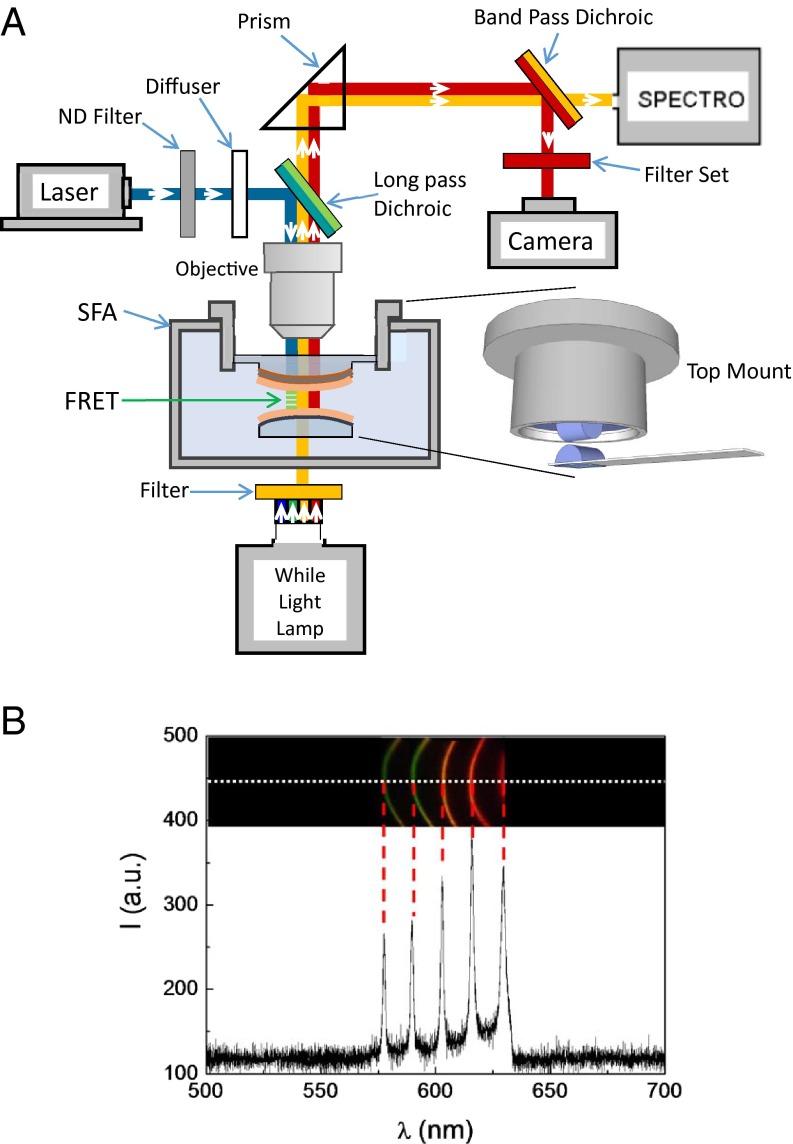
Diagram of the FRET/SFA setup. (A) Optical pathways for the SFA fringes, fluorescence excitation, and fluorescence emission are denoted by orange, blue, and red lines, respectively. For the SFA, the modified top mount can adapt the optical window with the large diameter. The 30% neutral density (ND) filter is presented in the optical pathway only during the time period of either adjusting the focus or imaging the fluorescently labeled t-SNARE. Magnification of the interacting surfaces is shown in detail in Fig. 1B. (B) Resulting image and spectrum of the FECOs in the spectrometer by this setup. The range of wavelengths used for force measurements (i.e., for observation of the FECOs) is 570–630 nm. A single-line home-made camera with 6,000 pixels captures the spectrum along the white dashed line. The resulting intensities are presented below. Of this range of wavelengths, only fluorescence (or FRET) can pass through the upper multi-dielectric layer presented in Fig. 1B.
SNARE protein assembly, which provides the energy for vesicle fusion in intracellular trafficking, is an archetype transmembrane assembly process in which the molecular landscape is strongly correlated with the membrane separation. In the classical case of synaptic fusion, there are two types of SNARE proteins, which include the synaptic vesicle SNARE, synaptobrevin VAMP2 (v-SNARE), and a heterodimer (t-SNARE) made of the presynaptic plasma membrane SNARE proteins Syntaxin 1 and SNAP-25. v-SNARE and t-SNARE zipper to form a SNAREpin between the membranes. The efficiency of the fusion process is controlled by subtle molecular details that ensure the right timing and appropriate release of energy at each binding stage. The crystal structure of the SNARE complex (9, 10) shows that SNAREs assemble to form a highly stable coiled-coil made of four parallel helix bundles. Zippering of the coiled-coil proceeds in a stepwise manner, with a half-zippered SNARE complex being one of the intermediate states (11, 18), but the submolecular details of the zippering process between membranes remain unknown. Notably, it is unclear whether the initial intermediate of SNARE assembly requires the binding of their membrane distal N-terminal regions.
In this article, we demonstrate that using an SFA equipped with a visualizing setup to observe Förster resonance energy transfer (FRET), we are able to access the intermediates of protein assembly between membranes. We exemplify this ability by the study of the assembly of SNAREpin and show that the first step toward complete SNARE zippering is the N-terminal assembling, and we determine the exact threshold distance, 20 nm, at which this assembling state can occur, before stabilizing at 8 nm.
Results
FRET/SFA.
The SFA is a technique that is widely used to measure the force-distance profile between two surfaces that are often functionalized to mimic the surface of a colloidal particle or a biological membrane. The distance between the surfaces is determined with subnanometer accuracy in a spectrometer through the position of fringes of equal chromatic order (FECOs) produced from multiple-beam interferometry with back-silvered mica sheets. The force is measured via the deflection of a spring with a calibrated spring constant. To date, this powerful technique has been used to address a large number of unresolved scientific questions in a wide range of fields [e.g., fundamental physics (19), soft matter physics (20), biology (21)]. It has also been coupled to numerous other techniques, such as friction force measurements (22), electrochemical measurements (23), fluorescence (24, 25), or X-ray diffraction (26). When cognate proteins are anchored on the mica surfaces to study their assembling, the subnanometer-level resolution distance of the SFA gives access to geometrical parameters and to the energy landscape of the assembling (15, 27). However, because of the flexibility of these molecules, the force-distance profile does not allow one to follow the submolecular details that could provide comprehensive information on the intermediate structures: the assembling landscape. To track the formation of molecular complexes, a distance-sensitive phenomenon is required. FRET (28), with its nanometric resolution of the distance between two fluorophores, is an appropriate technique to provide such information. FRET occurs between two fluorophores (29), with the emission spectrum of one (the donor) overlapping the absorption spectrum of the other (the acceptor), and there is energy transfer between the two fluorophores when their separation distance is less than the FRET distance, R0, on the order of a few nanometers.
FRET has not been incorporated in an SFA so far. Combining the two techniques into the FRET/SFA is uniquely suited to freeze the absolute distance between two flat membranes, measure the forces, and observe the formation of molecular complexes between the surfaces at the nanometer level (almost the amino acid level for a protein). So, when two molecules (proteins) are labeled, one with a donor and the other with an acceptor, the proximity of the labeled sites (amino acids) on two molecules (proteins) can be estimated in one molecular (protein) complex, and it becomes possible to establish whether molecules (proteins) are assembled at the level of these labeled sites (amino acids).
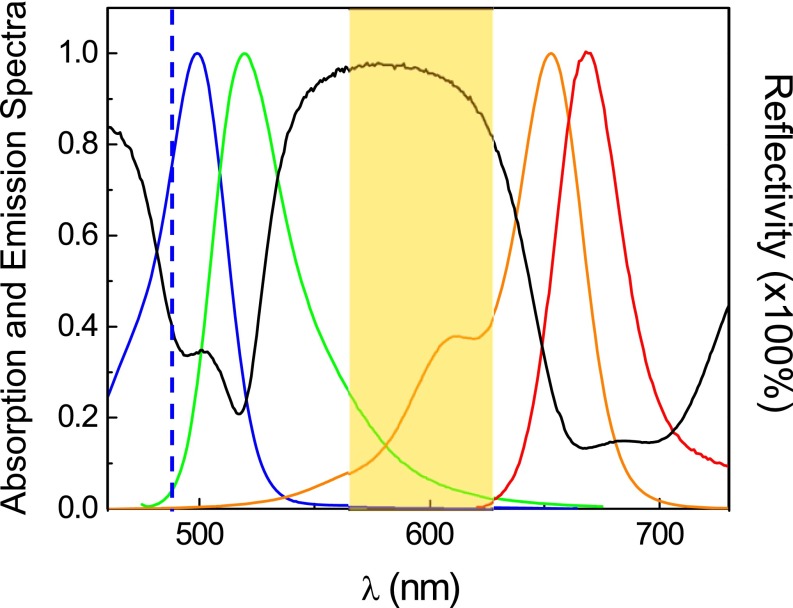
The FRET/SFA we have designed involves the basic version of the SFA with some modifications (Fig. 2). To allow simultaneous measurement of forces and observation of the FRET signal, the detection of a FRET signal coming from the samples must be made compatible with the interferometric distance measurements. This dual function of the FRET/SFA requires that the mica of the upper lens have high transmittance at the wavelengths of the donor excitation and the acceptor emission and good reflectance of ∼90–95% to observe the FECOs in the other wavelengths. These reflectance/transmittance spectra were made possible by designing an adequate 15-layer multi-dielectric Ti3O5/SiO2 coating. The preparation of this special surface is detailed in Materials and Methods. The resulting reflectivity spectrum is displayed as the black curve, and the transmission in the SFA setup configuration is displayed in Fig. S1. Second, a band-pass filter is placed at the output of the white light source to transmit only the wavelengths used for the FECOs without interfering with the observation of the FRET signal.
Fig. S1.
Reflectivity spectrum of the custom-designed coating of multi-dielectric layers, together with the absorption and emission spectra of two fluorophores, Alexa 488 and Alexa 647. The black curve is the reflectivity spectrum of the multi-dielectric layer Ti3O5/SiO2 coating; the blue and green curves are the excitation and emission spectra of Alexa 488 (donor), respectively; and the orange and red curves are the excitation and emission spectra of Alexa 647 (acceptor), respectively. The blue vertical dashed line indicates the wavelength of the 488-nm laser. The rectangular orange shadow on the plot indicates the wavelength range for the measurement of SFA FECOs.
Here, we used the Alexa 488 (donor)/Alexa 647 (acceptor) FRET pair. To excite the donor, a 488-nm green laser (Sapphire 488-200 mW; Coherent) is sent to the mica surfaces by means of a long-pass dichroic mirror that reflects the 488-nm light to the sample and that also transmits the donor and acceptor emission wavelengths. If FRET occurs, the fluorescence of the acceptor is emitted from the surfaces, whereas the fluorescence of the donor is decreased. At the optical exit of the SFA, a dichroic band-pass beam splitter reflects the fluorescence emission toward the CCD camera and transmits the FECOs toward the spectrometer. A band-pass filter is placed at the entrance of the CCD camera (RTE/CCD-782-V/HS; Princeton Instruments) to transmit only the wavelengths related to the acceptor or the donor. The power of the laser beam is carefully tuned to prevent photobleaching while capturing the fluorescent image; in the experiments presented here, it was set at 20 mW. The CCD camera is used to capture the fluorescent image. A scheme of the optical setup is presented in Fig. 2A, and the resulting image of the FECOs in the spectrometer is shown in Fig. 2B.
This sensitive system we have developed allows FRET measurements between probes placed at known locations in the proteins folding/assembling between two bilayers, which are brought together (and can be withdrawn) with rigidly controlled separation (Fig. 1B). This rigid control makes it possible to read out the intramolecular separations within assembling complexes at each intermembrane distance. The FRET/SFA can, in parallel, measure forces as in a standard SFA, so that when it is desirable, the assembling and energy landscapes can be directly compared.
SNAREpin Formation Observed with the FRET/SFA.
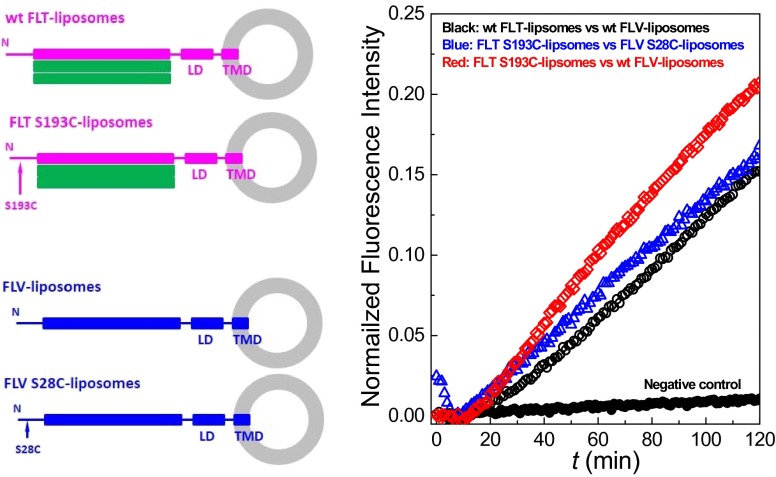
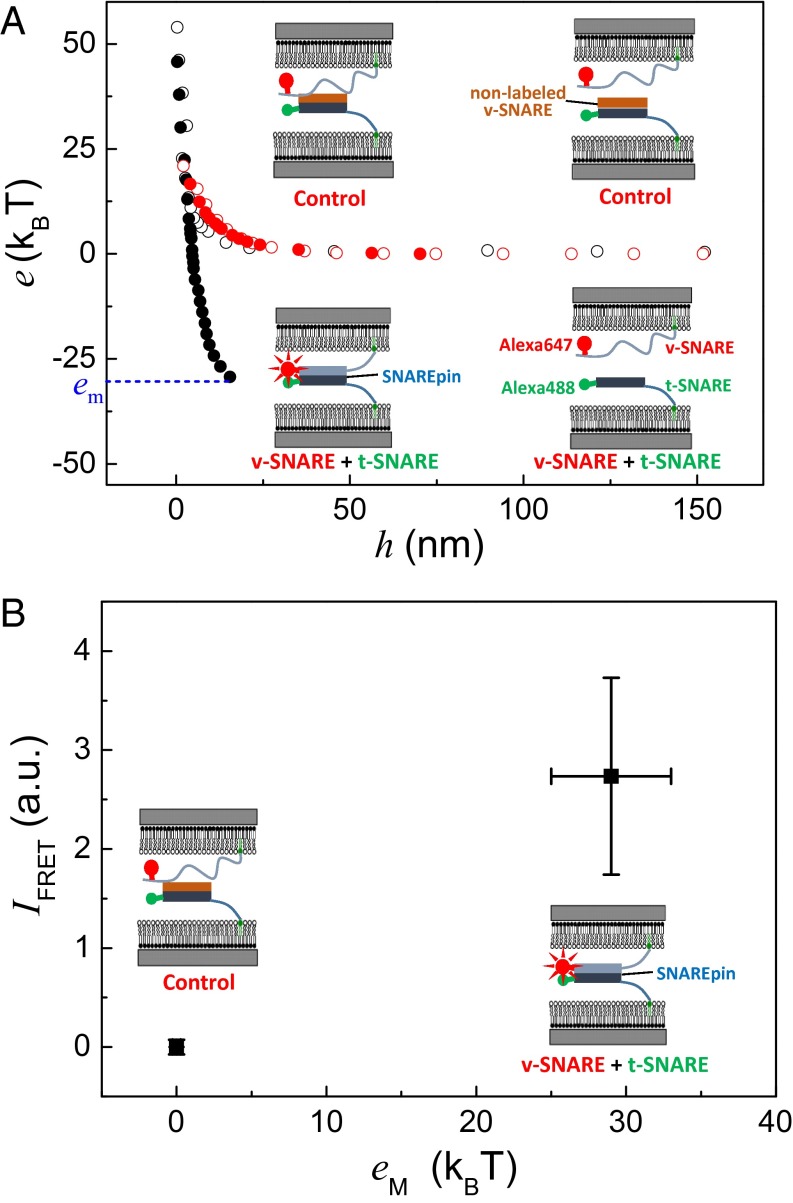
We have used this experimental setup with SNAREs that are labeled at their N-terminal region: t-SNARE with Alexa 488 and v-SNARE with Alexa 647 (Fig. 1B). Labeling is obtained by binding the dyes to a single Cys at the N terminus of each protein (the labeling procedure is described in SI Materials and Methods). The necessary mutations of the SNAREs do not affect their ability to fuse membranes (Fig. S2). Our SNAREs also possess a 12× His tag at their C terminus that enables their incorporation in the apposing bilayers containing 10% (mol/mol) lipids with nickel in their polar heads (Materials and Methods). The final SNARE density in the membrane is about one protein per 200 lipids. It has been previously shown that lipid-anchoring the SNARE is sufficient to keep the fusion activity (30). When the two SNARE-decorated membranes are brought together and subsequently separated, adhesion is observed (Fig. 3A). This adhesion vanishes in the control experiments, in which t-SNARE is blocked to prevent SNAREpin formation. Simultaneous measurement of the FRET signal when the membranes are contacting shows that SNAREpin forms in the contact area. The FRET signal disappears in the case of the control experiment, indicating that the presence of SNARE complexes is responsible for the observed adhesion (Fig. 3B). We have previously shown that the long-range repulsion in the energy profiles presented in Fig. 3A is directly correlated with the local SNARE density (15). Briefly, when the surfaces are between 10 nm and 20 nm during the approach, the SNAREs are not bound yet, they behave like polymers. The repulsion exponentially decays with the distance, and the prefactor (extrapolated repulsion when the surfaces are in contact) is proportional to the density. Dividing the adhesion energy, ∼0.2 kBT/nm2, where kBT is the thermal energy, by the density resulting from this fit directly provides the energy per SNAREpin between the membranes, which is 29 ± 4 kBT. This value is consistent with the value previously measured (15), confirming that SNAREpins form in a specific and normal manner between the membranes and showing that the FRET/SFA is suitable to study the arrangements and interactions of molecular complexes confined between two surfaces.
Fig. S2.
Effect of the Cys mutations on the activity of the SNAREs. In the standard bulk fusion assay (8), we mixed POPC/DOPS (85:15) liposomes decorated with full-length t-SNARE, either wild-type (wt FLT-liposomes) or with a single Cys (FLT S193C-liposomes), and POPC/DOPS/DOPE-Nitro-2-1,3-BenzoxaDiazol-4-yl (NBD)/DOPE-Rhodamine (82:15:1.5:1.5) liposomes decorated with full-length v-SNARE, either wt FLV-liposomes or with a single Cys at the N terminus (FLV S28C-liposomes). The loaded lipid-to-protein ratio was set at 400 for t-SNARE and at 200 for v-SNARE. There were ∼10 FLT-liposomes per FLV-liposome. All measurements were performed by monitoring the donor (NBD) fluorescence over time. The negative control was obtained by blocking the t-SNARE with the cytosolic domain of v-SNARE (CDV), as in the FRET/SFA control. All lipids were purchased from Avanti Polar Lipids. The mutations on the proteins in these fusion assays are the same as the Cys mutations on the protein used in the SFA/FRET measurements. LD, linker domain; TMD, transmembrane domain. (Right) Fusion curves show that the mutations do not significantly affect the activity of the proteins.
Fig. 3.
Correlation between adhesion and SNARE N-terminal binding. FRET/SFA can measure interaction energies while the surfaces are approached and subsequently separated. Simultaneously, the FRET signal (i.e., the assembly of the molecular complex) can be monitored at any separation distance. (A) SNARE induced adhesion between membranes. In black, the energy per SNAREpin is presented during an approach/separation cycle. During the approach (open circles), only positive, unfavorable energy is observed. Upon separation (closed circles), negative, favorable energy is measured, indicating the SNAREs have assembled. The maximum energy, em, corresponding to the SNARE binding energy, is the maximum one (i.e., em ∼ 30 kBT here). The red circles represent an approach/separation cycle in the control experiment in which Alexa 488–labeled t-SNARE is blocked by preincubation with nonlabeled and His tag-free v-SNARE. No adhesion is observed in the control experiment, showing unambiguously that the adhesion observed in the fluorescently labeled t-SNARE and v-SNARE experiments is induced by SNARE assembling. (B) FRET signal is correlated with the adhesion of the membranes. The measurement of the FRET signal at the closest separation distance during the approach/separation cycle is strongly correlated with the presence of adhesion: A positive FRET signal is observed only when there is adhesion (i.e., in the fluorescently labeled t-SNARE and v-SNARE experiments). Control experiments do not display any FRET signal. The relative intensity of the FRET signal, IFRET, is equal to the mean value of the fluorescent intensity before it decays minus the mean value of the fluorescent intensity of the control experiment (plateau in Fig. 4B). The FRET intensities and the corresponding adhesion energies in the FRET/SFA and control experiments were measured repeatedly and at different positions on each sample. The mean values are presented in the plot. a.u., arbitrary unit.
The FRET images can be analyzed further based on the fact that a continuous series of folding intermediates of SNAREpins are frozen in the SFA. The geometry of the membranes resembles the geometry of a sphere of radius R facing a flat plane (Fig. 1A). Placing the membranes in close proximity (minimum distance h0) is equivalent to observing simultaneously all separation distances, h, while moving at a distance r away from the contact location (Fig. 1A):
| [1] |
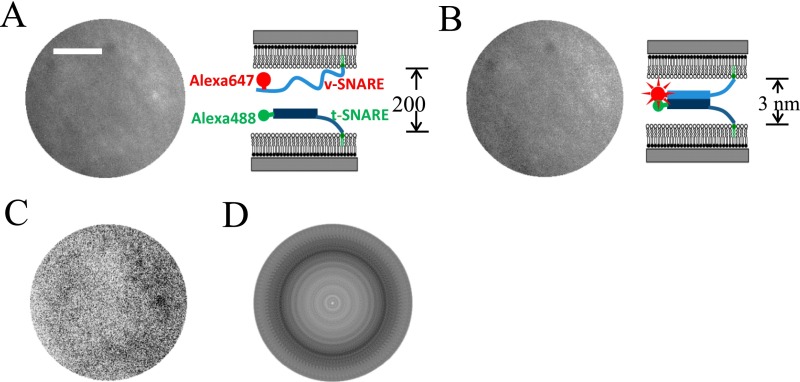
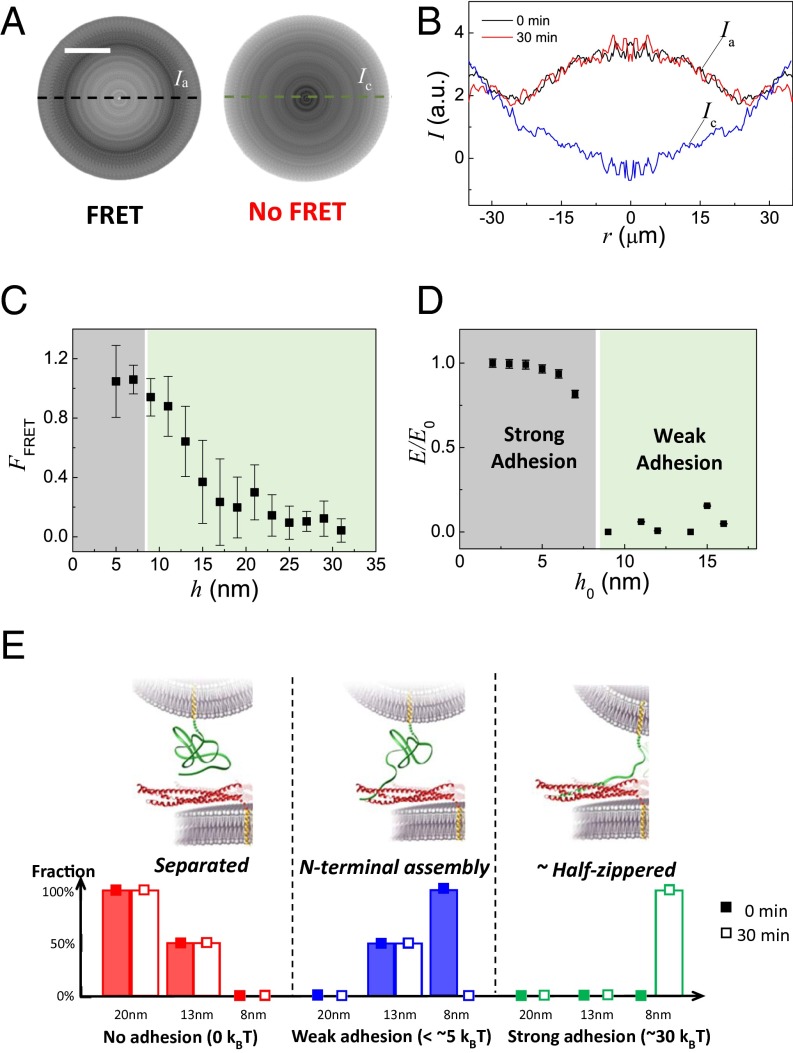
Hence, a picture of the FRET signal over the whole area of the membranes directly provides a snapshot of the N-terminal assembly at all distances. The thickness of the cylindrical lens (a few millimeters) imposes that the objective be far from the mica surface. Hence, the FRET signal remains weak. To increase the signal/noise ratio, we spin-averaged each image by successive rotations around the point of closest distance (Materials and Methods). The main difficulty is to localize this center of rotation precisely. By testing several positions from the raw FRET signal (Fig. S3C), we estimate that our accuracy, δ, is better than 10 pixels (i.e., better than 3 μm). The resulting spin-averaged picture is presented in Fig. 4A. The FRET signal profile with the distance to the center of rotation, r, is displayed in Fig. 4B. It does not change when the membranes are kept in contact for 30 min (Fig. 4B and Fig. S4A), and it is reproducible in successive approach/separation cycles (Fig. S4 B–E). As expected, the FRET profile is maximum in the center (r ∼ 0). In the case of the control, there is no FRET signal; the intensity is even minimum in the center. Given the high distance sensitivity of FRET, the intensity normalized by the intensity at the plateau presented in Fig. 4B actually represents the ratio between the fractions of bound N-terminal regions at r and at the FRET plateau, FFRET. Using Eq. 1, it is then possible to determine the variation of FFRET with the membrane separation h from the single image obtained in Fig. 4A (Fig. 4C). Note that the error on h varies as rδ/R, that is, close to 20% in the relevant range (h between 3 nm and 30 nm). FFRET (h) is maximum for h < 8 nm, and it is close to zero for h > 20 nm. Between 8 nm and 20 nm, the fraction of bound SNAREs decreases almost linearly. This variation is analyzed in the discussion below in view of what is already known on SNARE assembly.
Fig. S3.
From raw images to FRET signal. Images of the fluorescent emission of Alexa 647-labeled v-SNARE captured by the CCD camera in the FRET/SFA setup in an experiment with the fluorescently labeled t-SNARE and v-SNARE on the lower and upper mica surfaces, respectively. (A) Capture when the two membranes are separated by 200 nm, as shown by the cartoon (Right). This intermembrane distance is the starting distance for each force measurement cycle. (Scale bar, 20 μm.) (B) Capture at the closest position of the two membranes, as shown by the cartoon (Right). Subtraction of B by A results in C, which is the actual raw FRET signal. (D) Spin-averaged image of C obtained as explained in Materials and Methods. It is the same as the spin-averaged image presented in Fig. 4A.
Fig. 4.
Stable N-terminal assembly is required for initial binding of the SNAREs. (A, Left) Spin-averaged picture (Materials and Methods and Fig. S3) of the FRET signal between two membranes decorated with fluorescently labeled t-SNARE and v-SNARE, respectively. (A, Right) Spin-averaged picture of the FRET signal in the control experiment. (Scale bar, 20 μm.) (B) Intensities taken along the dashed line through the center to form the intensity profiles are displayed: Ia (black and red lines) represents the intensity of the fluorescently labeled t-SNARE and v-SNARE experiments, whereas Ic (blue) is the control and r equals 0 at the center. The black line shows the intensity right after the contact, and the red line was obtained after the surfaces were kept in contact for 30 min. The two lines are overlapping, revealing no time dependence of the FRET signal. The variations in Ic are due to optical interferences. Hence, the actual FRET signal is the difference between Ia and Ic. (C) Fraction of the N-terminal assembly in the total population of SNARE pairs with the intermembrane separation distance h (obtained from r through Eq. 1). The N-terminal domains are only 100% assembled when h < 8 nm. The error bars are the SD, obtained by averaging 20–40 data points in four separate experiments. (D) Adhesion of t-SNARE– and v-SNARE–decorated membranes in the SFA with h0, the minimal intermembrane separation reached during the approach/separation cycle, is normalized by the strongest adhesion [same data as in the study by Li et al. (15)]. The membranes were kept at distance h0 for at least 20 min. (E) Various SNARE complex states in the SFA; their respective energies; and the distribution of these states after 0 and 30 min in contact at h = 8 nm, h = 13 nm, and h = 20 nm. Solid bars represent 0 min, and open bars represent 30 min.
Fig. S4.
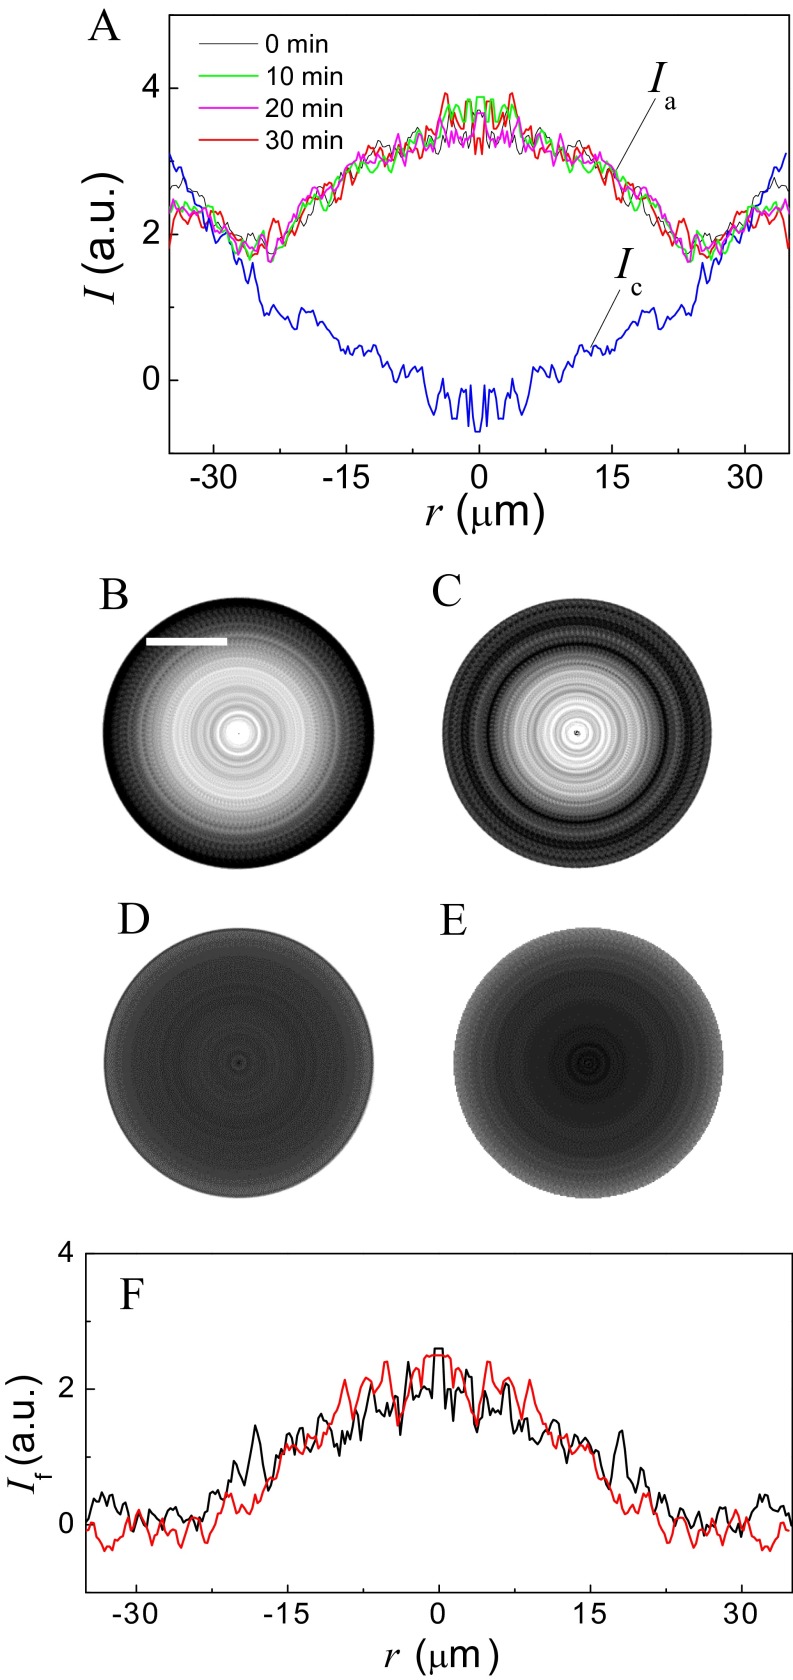
Evolution with time, reproducibility, and reversibility of the N-terminal assembly intermediate state. (A) FRET profiles (obtained as in Fig. 4B) after various contact times (0, 10, 20, and 30 min). There is no evolution of the FRET signal with time. a.u., arbitrary units. (B and C) FRET images corresponding to two different force measurement cycles at the same position. This position is different from the position in Fig. 4. Both were obtained during the approaching phase. C is from the second measurement cycle after B. B and C demonstrate that SNARE proteins are still active after being separated. Correspondingly, the reproducibility can also be proven in the control experiment. (D and E) Images obtained in two different FRET/SFA measurements, respectively, at two randomly selected positions in the control experiment. These two images show t-SNAREs are prebound with nonlabeled v-SNARE everywhere on the surface in the control experiment. (Scale bars in FRET images, 20 μm.) (F) FRET intensity profiles after the background subtraction in a single cycle of FRET/SFA measurement. The black curve is the intensity profile for an approaching process. The red curve is for the separation process. The red curve also demonstrates a plateau of FRET intensity in the middle of the curve. The fact that these two intensity profiles are very close to each other provides the evidence indicating that the proteins are disassembled during the separation of two surfaces.
Another direct conclusion that can be drawn from these observations is that SNAREpin formation is reversible. This reversibility can be probed by imaging the FRET intensity after the membranes have been separated. Indeed, a nonreversible assembling would keep the SNARE proteins bound upon membrane separation, with the FRET signal unchanged. Conversely, if the SNAREpins have been unraveled, the acceptor dye will be too far from the donor dye (typically 200 nm) to emit any FRET fluorescence. To determine whether the FRET signal disappeared, we computed the difference between the images after separation and the image at contact, just as was done to determine the FRET signal during the approach phase. The FRET intensity profile from the spin-averaged picture of FRET signal during the separation phase is almost completely superimposable with the one obtained during the approach phase (Fig. S4F), which shows that SNAREpins can be disassembled upon separation.
SI Materials and Methods
Chemicals.
Hepes, potassium hydroxide (KOH), and potassium chloride (KCl) were purchased from Sigma–Aldrich with the BioChemika Ultra grade. All aqueous solutions were prepared with 18.2 MΩ ultrapure water, and further filtrated by Nalgene Rapid-Flow Sterile Disposable Filter Units with a Supor machV PES Membrane with a pore size 0.1 μm.
Protein Constructs, Expression, and Purification.
Cytosolic v-SNARE with end-of-sequence 12× His (v-SNARE).
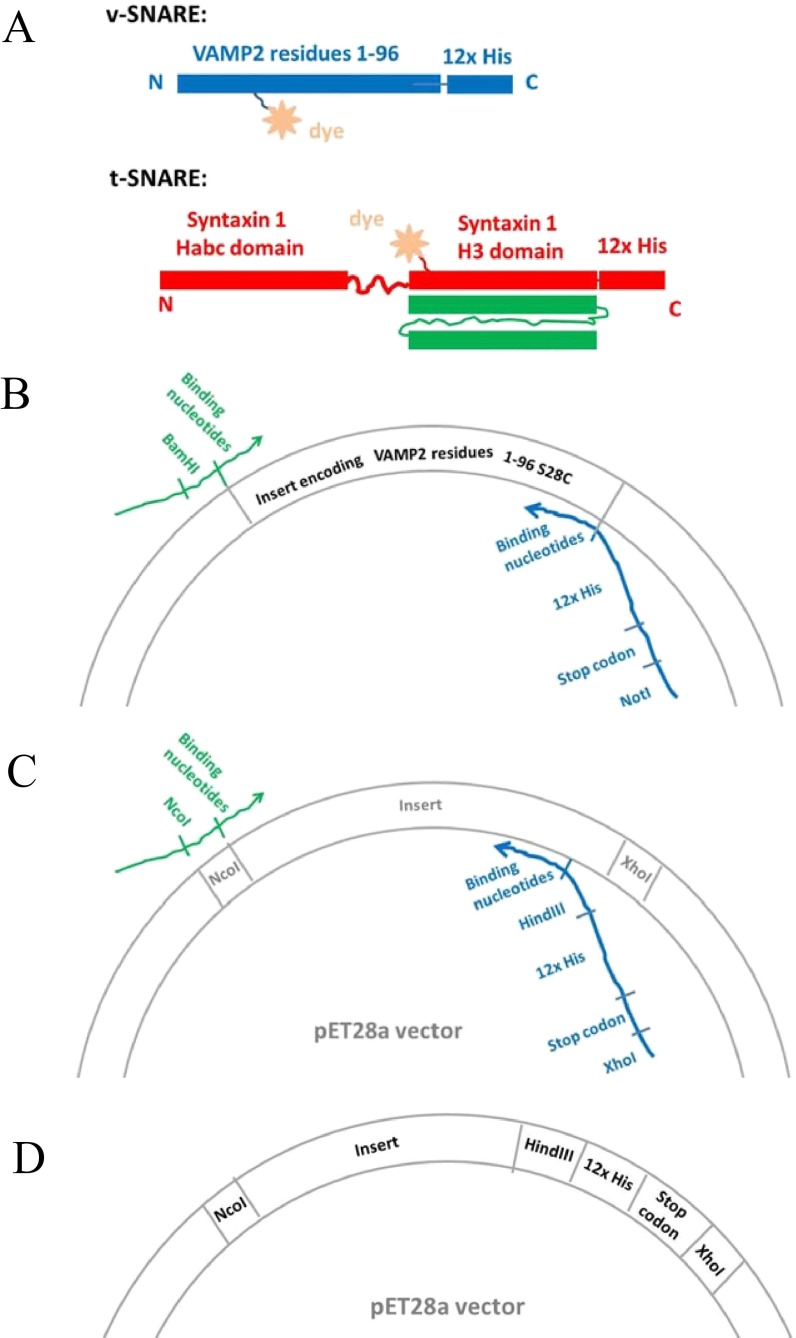
To incorporate the 12× His repeating residues into the C terminus of v-SNARE, we designed two primers: a forward primer containing a BamHI restriction enzyme site and a reverse primer containing the codons for the 12× His and a NotI restriction enzyme site. As shown in Fig. S5B, these two primers are used in PCR to clone residues 1–96 of the v-SNARE VAMP2 from a template plasmid that contains a single Cys mutation at residue 28, S28C. The PCR product is then digested and ligated with a pCDFDuet-1 vector (Novagen) containing GST-PreScission (18) via the BamHI and NotI sites. The resultant plasmid, pLF701, was used to express the v-SNARE in the BL-21 gold (DE3) Escherichia coli bacterial strain. Purification is similar to a previously described method (18). Briefly, the supernatant of cell lysate was incubated with Glutathione Sepharose (GE Healthcare) for 6 h at 4 °C. The beads were collected and washed. Then, the GST tag was cleaved by incubating the protein (attached to glutathione beads) with PreScission protease overnight at 4 °C. The protein was eluted with a buffer containing 25 mM Hepes (pH 7.4), 400 mM KCl, 10% glycerol, and 1 mM tris(2-carboxyethyl)phosphine (TCEP), and was then purified by size exclusion chromatography on a HiLoad Superdex 75 (16/60; GE Healthcare) column.
Fig. S5.
Protein constructs for the FRET/SFA studies. (A) Diagram of the design of the SNARE proteins, which contain two specific functional sites. The Cys residue within the SNARE domain is designed for site-specific fluorescence labeling, and the 12× His on the end of protein sequences provides the capability to anchor to a bilayer. (B) Illustration of the strategy of introducing the C-terminal 12× His to the v-SNARE through PCR cloning. (C) Illustration of the strategy of introducing the C-terminal 12× His to the pET28a vector through PCR cloning. (D) Illustration of the modified pET28a vector that contains C-terminal 12× His.
Cytosolic t-SNARE with end-of-sequence 12× His (t-SNARE).
To incorporate the 12× His repeating residues into the C terminus of Syntaxin 1A, we modified a template plasmid that is on a His tag-free pET28a vector (31). As shown in Fig. S5C, a forward primer with an NcoI restriction enzyme site and a reverse primer with a HindIII site, codons for 12× His, and a XhoI site are used in PCR amplification. Both the PCR product and the template plasmid are digested using NcoI and Xhol enzymes, and are ligated together, which generates a plasmid, pLF652, with a HindIII site before the 12× His, as shown in Fig. S5D. We then clone residues 1–265 of Syntaxin 1 from a template plasmid that contains a single Cys at position 193, and insert the product into pLF652 via the NcoI and HindIII sites. To avoid the formation of a 2:1 (Syntaxin 1/SNAP25) t-SNARE complex (32, 33), we use the affinity tag on SNAP25 to pull down the t-SNARE, so that SNAP25 is in excess during purification. We clone a Cys-free SNAP25, insert it into the pCDFDuet-1 vector (18), and obtain a GST-tagged SNAP25 plasmid, pLF320. We produce the t-SNARE by coexpressing pLF254 and pLF320 in the BL-21 gold (DE3) E. coli bacterial strain and purification with glutathione agarose. The purification procedure is similar to the above description for v-SNARE.
Fluorescence Labeling.
t-SNARE and v-SNARE were labeled with Alexa Fluor 488 C5 Maleimide (Invitrogen) and Alexa Fluor 647 C2 Maleimide (Invitrogen), respectively: The protein was first reduced by incubation with 4 mM TCEP for 30 min at 4 °C with gentle mixing and then centrifuged at 14,000 rpm (Eppendorf centrifuge 5424 R, Rotor FA-45-24-11) for 20 min at 4 °C to remove any precipitation. Fluorescence dye was added into the protein solution at a 3:1 dye/protein molar ratio, and the mixture was incubated for 1–2 h at room temperature with gentle mixing. Unreacted dye was removed by passing through a PD MidiTrap G-25 column (GE Healthcare) three times. The labeling efficiency was 77 ± 8% for t-SNARE and 84 ± 8% for v-SNARE.
SNARE Layer Reconstitution.
At the start of each deposition, the lipid chloroform solution is added drop by drop onto the surface of water, and the surface of water is then equilibrated for 20 min to evaporate the chloroform. During deposition, the horizontal pressure for the first leaflet is maintained at 38 mN/m while the lenses are being lifted up vertically from water to air, and at 35 mN/m for the outer leaflet while the lenses are being immersed back into water. After the deposition, the lower lens of the SFA is kept in 2.5 mL of water in a 5-mL beaker, and the upper lens is kept in 10 mL of water in a 20-mL beaker.
The two beakers, each with one lens, are transferred into 1 L of buffer [25 mM Hepes⋅KOH, 100 mM KCl (pH 7.4)] in a culture dish. Buffer exchange proceeds for 15 min, and the beakers with the lens in the buffer are then taken out of the culture dish. One aliquot (100 μL) of t-SNARE complex (80 μM) and two aliquots (100 μL each) of v-SNARE (35 μM) are thawed from −80 °C and spun twice at 14,000 rpm (Eppendorf centrifuge 5424 R, Rotor FA-45-24-11) for 10 min to pellet any protein aggregate in the solution. The C terminus of the cytoplasmic domain of VAMP2 (residues 49–94), Vc peptide, is thawed from −80 °C and added to the t-SNARE solution to make a final molar ratio of 2:1 (Vc peptide/t-SNARE) in the final t-SNARE solution. This incubation of Vc peptide with t-SNARE is carried out at 37 °C for 30 min. The Vc peptide-bound t-SNARE is more active to assemble with v-SNARE, and Vc peptide is released automatically after the assembly. Thus, Vc peptide does not alter the binding energy of the SNAREpin. This result is confirmed by the reproducibility of the experiment upon several approach/separation cycles: The subsequent cycles, in which Vc peptide has been released, behave exactly the same as the first one, in terms of energy and FRET. Then, the v-SNARE and t- SNARE solutions are added into the buffer in the beakers with the lower and upper lenses, respectively. The protein solution is homogenized in the buffer by gently mixing with a pipette. The incubation of the SNARE proteins with the lipid bilayer is performed at 4 °C overnight. After the incubation, each beaker, together with the lens, is immersed sequentially in two culture dishes, with each containing 1 L of buffer [25 mM Hepes⋅KOH, 100 mM KCl (pH 7.4)] to remove unbound proteins. The beakers with the lenses are then transferred into the SFA chamber prefilled with buffer [25 mM Hepes⋅KOH, 100 mM KCl (pH 7.4)] prepared with degassed water, and the lenses are mounted into the apparatus.
Discussion
The FFRET(h) variation is intriguing because we previously reported in independent SFA measurements that there is no adhesion between two SNARE-decorated membranes when their separation is larger than 8 nm. This conclusion was based on the sharp adhesion drop in Fig. 4D and a study by Li et al. (15). These two results may seem contradictory: How can the SNARE complex start assembling without producing any significant adhesion between 8 nm and 20 nm? A closer look at the data shows that there is indeed a small adhesion above 8 nm (1.3 ± 2 kBT per SNAREpin). This value, which is much smaller than the 35 kBT observed below 8 nm, may be slightly underestimated (2 kBT at most) because of the polymer repulsion of the unstructured SNAREs. Hence, it corresponds to a weak state with energy lower than 5 kBT per SNAREpin. The weakness of the bond between the N termini of SNAREs is therefore compatible with the detection of FRET and with the relative lack of adhesion we previously reported.
We also observed that it was necessary to wait for tens of minutes in close contact before maximum adhesion was achieved in the SFA (15). The adhesion increased with a characteristic time of ∼20 min (figure 2b in ref. 15). The reason for this long wait was unknown. We suspected it might come from the confinement and density between the relatively flat surfaces. Here, we also waited for at least 30 min before separation and took FRET images at various times while waiting (Fig. 4B and Fig. S4A). We observed that the FRET signal is fully established as soon as the surfaces are in contact, meaning that the N-terminal domains of the SNAREs assemble immediately but that the complex is not yet zippered with enough energy to generate adhesion. Hence, the fast setting up of the FRET also proves the existence of a low-energy state in which a small fraction of the N-terminal residues of the SNARE domains are bound. This weak state is the first one that occurs during SNAREpin formation. Previous optical tweezers measurements have shown that, upon separation, SNAREpins oscillate between several intermediate states depending on the force applied to disassemble them (11), but they would not have been able to observe this initial state. However, the final state in the SFA is relatively well characterized (11, 15) and corresponds to a half-zippered state (or possibly zippered beyond). These observations allow us to separate the two situations: upon contact and after 30 min of contact.
First, upon contact, N-terminal regions of the SNARE immediately bind in the low-energy state. Below 8 nm, virtually all SNAREpins are assembled in their N-terminal region. Between 8 nm and 20 nm, only a fraction of them are bound; this fraction decreases as h increases. Beyond 20 nm, no SNAREpins are assembled.
Second, after 30 min, the SNAREpins have transited toward the half-zippered state for h < 8 nm. Above 8 nm, and because there is no easily detectable adhesion, the SNAREpins are only in the weak-energy state. These results are summarized in Fig. 4E.
The long delay for the transition toward the half-zippered state indicates a high-activation energy barrier. Assuming a standard density of the transition time, the activation energy can be written as Ea = kBTln(ν0τ), where ν0 is the frequency of escape attempt, τ is the characteristic time, and kBT is the thermal energy. In water, for this type of molecule, ν0 is between 1010 s−1 and 108 s−1, and τ ∼ 1,000 s here. This characteristic time leads to Ea ∼ 25–30 kBT.
These results imply that, in vivo, synaptic vesicles must be brought as close as 20 nm, and preferably 8 nm, from the presynaptic plasma membrane to start SNAREpin formation. The long transition time, τ, between the N-terminal weakly bound state and the high-energy half-zippered state suggests that an active mechanism exists to accelerate the transition process, possibly through the use of regulatory factors.
This observation of the first transient state during SNARE zippering between membranes shows the sensitivity and efficiency of the FRET/SFA to detect and characterize intermediate structures between closely apposed membranes. It opens up the way to monitor other transmembrane transient states that cannot be observed otherwise.
Materials and Methods
Chemicals.
The lipids used in this study are 1,2-dimyristoyl-sn-glycero-3-phosphoethanolamine (DMPE) (850745X), 1,2-dioleoyl-sn-glycero-3-phosphocholine (DOPC) (850375C), 1,2-dioleoyl-sn-glycero-3-[phospho-l-serine] (sodium salt) (DOPS) (840035C), and 1,2-dioleoyl-sn-glycero-3-[(N-(5-amino-1-carboxypentyl)iminodiacetic acid)succinyl] (nickel salt) (NTA-Ni) (79404), which were all purchased from Avanti Polar Lipids. More details on buffers and other chemicals are provided in SI Materials and Methods.
SNARE Proteins.
SNARE proteins are illustrated in Fig. S5.
Cytosolic v-SNARE with end-of-sequence 12× His (v-SNARE).
The v-SNARE for the FRET/SFA study is made of the cytoplasmic domain of mouse VAMP2 (residues 1–96 with a single Cys, S28C, and C-terminal 12× His).
Cytosolic t-SNARE with end-of-sequence 12× His (t-SNARE).
The t-SNARE for the FRET/SFA study is made of the cytoplasmic domain of rat Syntaxin 1A (residues 1–265 with a single Cys, S193C, and C-terminal 12× His) and mouse His6-SNAP25 (residues 1–206, Cys-free).
Details on protein constructs, expression, and purification are given in SI Materials and Methods.
Reflective Coating on Mica.
The lower mica has the backside surface coated with a 67-nm silver layer prepared by a thermal evaporator in a clean room of class 1,000.
The backside of the upper mica has a custom coating made of 15 or 13 alternating Ti3O5 and Si02 layers starting with Ti3O5, with a total thickness of 1.1 μm. More precisely, the technique used is an ion-assisted deposition [i.e., E-beam evaporation (MEB 800; Plassys) with ion assistance provided by an ion gun (EH 1000 source; KRI). The design, synthesis, and refinement of the custom coating have been done theoretically with Essential MacLeod software. Targets of reflectivity, R, have to be set. In our case, we wanted low R (∼5%) for both 488- to 520-nm spectral regions and spectral regions above 660 nm and high R (∼95%) for spectral regions between 570 nm and 630 nm. The optimization uses Si02 and Ti3O5 mean refractive indices for the entire considered spectral range.
From given initial thicknesses to the theoretical stack at an arbitrary wavelength of this range, the algorithm finds solutions with different figures of merit. As an example, for 15 layers, we chose one of these solutions for which the thickness of each layer is (starting from the mica surface) as follows: 65.69 nm (Ti3O5)/129.59 nm (Si02)/72.65 nm (Ti3O5)/35.48 nm (Si02)/29.32 nm (Ti3O5)/182.25 nm (Si02)/66.43 nm (Ti3O5)/89.79 nm (Si02)/79.51 nm (Ti3O5)/111.51 nm (Si02)/25.16 nm (Ti3O5)/24.02 nm (Si02)/136.10 nm (Ti3O5)/67.05 nm (Si02)/94.86 nm (Ti3O5). The deposition is made with the following protocol. Both Ti3O5 and Si02 are deposited at a rate of 0.25 nm⋅s−1. Starting materials are Ti3O5 and SiO2 of 1- to 3-mm pieces put in molybdenum liners. To avoid stress issues on the mica that would curve it, we set the ion gun discharge voltage at 100 V and discharge current at 1 A. The background pressure before adding gases was 1.0 × 10⁻⁷ millibars, and the working pressure was ∼3.0 × 10⁻⁴ millibars with flows of 5 standard cubic centimeters per minute (sccm) of Ar and 5 sccm of O2 for the ion source, and 10 sccm of Ar for the keeper (plasma bridge). The layer thicknesses were followed in real time using both a quartz microbalance and an ellipsometer (here, we used a 60.5° angle of incidence and 580-nm wavelength).
The reflectivity of the coating is provided in Fig. S1.
SNARE Layer Reconstitution.
To prepare the sample for the deposition of the lipid bilayer, the backside-coated mica is glued onto the lens of the SFA by thermal epoxy, with the coated surface contacting the glue. The multi-dielectric–coated mica is glued onto the upper lens, and the silver-coated mica is glued onto the lower lens. Then, the lenses are transferred into water and held vertically in a home-built Langmuir trough. The DMPE chloroform solution is directly used as purchased for the first lipid leaflet on both mica surfaces. For the second leaflet, a mixture of the chloroform solutions of DOPC, DOPS, and NTA-Ni with the lipid molar ratios of 80%, 10%, and 10%, respectively, was used. The mixture has undergone three freeze (by liquid nitrogen) and thaw cycles to homogenize the solution before use. The rest of the procedure is the same as the one we previously reported (15). Details are provided in SI Materials and Methods.
In the control experiment that follows a fluorescently labeled t-SNARE and v-SNARE experiment, the lower lens is taken off from the SFA chamber, kept immersed in buffer in a 5-mL beaker, and further incubated with nonlabeled His tag-free v-SNARE (final concentration of 0.2 μM) at 4 °C overnight. It undergoes the same procedure to rinse off unbound protein and is remounted onto the apparatus.
SFA Force Measurement.
A homemade SFA similar to the original design (13) is used, except for the modification on the top mount, as shown in Figs. 1B and 2A. It can adapt a large optical window with the SFA lens at the center. This modification increases the angle through which the emission of the acceptor is collected, and therefore improves the optical sensitivity for the FRET signal. The upper lens is initially glued onto an optically smooth polished glass slide, provided by Optique Fichou. This special upper lens is used in the deposition of the lipid bilayer. One band-pass filter (from 570–630 nm) is added in front of the white light source, which limits the wavelength range of the fringes for the FECOs but does not disturb the force measurement. The on/off switching of the white light does not give any difference on the intensity of the dark image captured by the CCD camera at the same exposure time for the fluorescent imaging, which proves that the filtered white light source does not interfere with the fluorescent signal. The characteristic wavelengths of the mercury lamp are used for the calibration of the spectrometer. The procedure of the force measurement is the same as described before (15). The spring constant of the cantilever is precalibrated, and its value is 109 N/m.
Fluorescence Detection.
A Genesis MX 488-1000 STM laser purchased from Coherent is used to excite Alexa 488. The laser beam is reflected to the sample by a long-pass dichroic mirror with a cutoff at 500 nm, purchased from Edmunds Optics. Between the laser source and the long-pass dichroic mirror, an engineered 20° diffuser from Thorlabs is used to enlarge the illuminated area on the sample. The total optical power illuminating the sample is only about 400 μW, as measured by a photodetector. A band-pass dichroic beam splitter (transparent from 565–655 nm) from Chroma Technology Corporation is used to reflect the fluorescent light to the CCD camera while letting the 570–630-nm light pass to the spectrometer. In front of the CCD camera (RTE/CCD-782-V/HS; Princeton Instruments), there is a multifilter unit with two band-pass filters, both from Edmunds Optics. The transparent wavelength ranges are from 515–560 nm and from 650–700 nm for the emissions of Alexa 488 and Alexa 647, respectively. The setup of the fluorescent detection is displayed in Fig. 2.
When the separation distance between the samples, controlled by monitoring the fringes, is less than 500 nm, one 30% neutral filter is added in front of the laser before turning on the laser to adjust the focus of the fluorescent image. The focus is adjusted with the observation of the fluorescent image of t-SNARE. The 30% neutral filter is also present to capture fluorescent images of t-SNARE, but not for fluorescent images of v-SNARE. The longest exposure time for each fluorescence image is 5 s to avoid any bleaching effect or saturation of the detector.
Spin-Averaged Image and Intensity Profile.
To obtain the spin-averaged image, the initial FRET image (Fig. S3C) is rotated 119 times by 3°. This process produces 120 images, representing the initial image turned by 0°, 3°, 6°, …, 357°. Then, these 120 images are averaged. The whole process is done by a macro programed in ImageJ (NIH). Intensity profiles, such as the one presented in Fig. 4B, are plots of the intensity values along a straight line across the center of the spin-averaged image. Because the region close to the spin center does not contain many pixels, to perform the average, large fluctuations can be observed. In our system, the data IFRET(r) of r less than 0.7 μm (two pixels from the center) are not representative of a real average. They should be disregarded for the analysis.
Acknowledgments
We thank Prof. Jacob Israelachvili (Department of Chemical Engineering, University of California, Santa Barbara), Prof. James Rothman (Yale University), and Prof. Erdem Karatekin (Yale University) for valuable discussions. This work was supported by Agence Nationale de la Recherche Grant ANR-12-BSV5-0002 (to F.P.) and a Fondation Pierre-Gilles de Gennes fellowship (to Y.J.W.).
Footnotes
The authors declare no conflict of interest.
This article is a PNAS Direct Submission.
This article contains supporting information online at www.pnas.org/lookup/suppl/doi:10.1073/pnas.1518935113/-/DCSupplemental.
References
- 1.Berrier AL, Yamada KM. Cell-matrix adhesion. J Cell Physiol. 2007;213(3):565–573. doi: 10.1002/jcp.21237. [DOI] [PubMed] [Google Scholar]
- 2.Cavallaro U, Christofori G. Cell adhesion and signalling by cadherins and Ig-CAMs in cancer. Nat Rev Cancer. 2004;4(2):118–132. doi: 10.1038/nrc1276. [DOI] [PubMed] [Google Scholar]
- 3.Thiery JP. Cell adhesion in development: A complex signaling network. Curr Opin Genet Dev. 2003;13(4):365–371. doi: 10.1016/s0959-437x(03)00088-1. [DOI] [PubMed] [Google Scholar]
- 4.White JM, Delos SE, Brecher M, Schornberg K. Structures and mechanisms of viral membrane fusion proteins: Multiple variations on a common theme. Crit Rev Biochem Mol Biol. 2008;43(3):189–219. doi: 10.1080/10409230802058320. [DOI] [PMC free article] [PubMed] [Google Scholar]
- 5.Harrison SC. Viral membrane fusion. Nat Struct Mol Biol. 2008;15(7):690–698. doi: 10.1038/nsmb.1456. [DOI] [PMC free article] [PubMed] [Google Scholar]
- 6.Martens S, McMahon HT. Mechanisms of membrane fusion: Disparate players and common principles. Nat Rev Mol Cell Biol. 2008;9(7):543–556. doi: 10.1038/nrm2417. [DOI] [PubMed] [Google Scholar]
- 7.Rizo J, Rosenmund C. Synaptic vesicle fusion. Nat Struct Mol Biol. 2008;15(7):665–674. doi: 10.1038/nsmb.1450. [DOI] [PMC free article] [PubMed] [Google Scholar]
- 8.Weber T, et al. SNAREpins: Minimal machinery for membrane fusion. Cell. 1998;92(6):759–772. doi: 10.1016/s0092-8674(00)81404-x. [DOI] [PubMed] [Google Scholar]
- 9.Poirier MA, et al. The synaptic SNARE complex is a parallel four-stranded helical bundle. Nat Struct Biol. 1998;5(9):765–769. doi: 10.1038/1799. [DOI] [PubMed] [Google Scholar]
- 10.Sutton RB, Fasshauer D, Jahn R, Brunger AT. Crystal structure of a SNARE complex involved in synaptic exocytosis at 2.4 A resolution. Nature. 1998;395(6700):347–353. doi: 10.1038/26412. [DOI] [PubMed] [Google Scholar]
- 11.Gao Y, et al. Single reconstituted neuronal SNARE complexes zipper in three distinct stages. Science. 2012;337(6100):1340–1343. doi: 10.1126/science.1224492. [DOI] [PMC free article] [PubMed] [Google Scholar]
- 12.Zorman S, et al. Common intermediates and kinetics, but different energetics, in the assembly of SNARE proteins. eLife. 2014;3:e03348. doi: 10.7554/eLife.03348. [DOI] [PMC free article] [PubMed] [Google Scholar]
- 13.Israelachvili J, Adams G. Measurement of forces between two mica surfaces in aqueous electrolyte solutions in the range 0-100 nm. J Chem Soc. 1978;1(74):975–1001. [Google Scholar]
- 14.Israelachvili J, Marra J. Direct methods for measuring conformational water forces (hydration forces) between membrane and other surfaces. Methods Enzymol. 1986;127:353–360. doi: 10.1016/0076-6879(86)27029-9. [DOI] [PubMed] [Google Scholar]
- 15.Li F, et al. Energetics and dynamics of SNAREpin folding across lipid bilayers. Nat Struct Mol Biol. 2007;14(10):890–896. doi: 10.1038/nsmb1310. [DOI] [PubMed] [Google Scholar]
- 16.Prakasam AK, Maruthamuthu V, Leckband DE. Similarities between heterophilic and homophilic cadherin adhesion. Proc Natl Acad Sci USA. 2006;103(42):15434–15439. doi: 10.1073/pnas.0606701103. [DOI] [PMC free article] [PubMed] [Google Scholar]
- 17.Li F, et al. Complexin activates and clamps SNAREpins by a common mechanism involving an intermediate energetic state. Nat Struct Mol Biol. 2011;18(8):941–946. doi: 10.1038/nsmb.2102. [DOI] [PMC free article] [PubMed] [Google Scholar]
- 18.Li F, et al. A half-zippered SNARE complex represents a functional intermediate in membrane fusion. J Am Chem Soc. 2014;136(9):3456–3464. doi: 10.1021/ja410690m. [DOI] [PMC free article] [PubMed] [Google Scholar]
- 19.Tabor D, Winterton RH. Surface forces: Direct measurement of normal and retarded van der Waals forces. Nature. 1968;219(5159):1120–1121. doi: 10.1038/2191120a0. [DOI] [PubMed] [Google Scholar]
- 20.Luckham PF, Klein J. Interactions between smooth solid-surfaces in solutions of adsorbing and nonadsorbing polymers in good solvent conditions. Macromolecules. 1985;18(4):721–728. [Google Scholar]
- 21.Helm CA, Knoll W, Israelachvili JN. Measurement of ligand-receptor interactions. Proc Natl Acad Sci USA. 1991;88(18):8169–8173. doi: 10.1073/pnas.88.18.8169. [DOI] [PMC free article] [PubMed] [Google Scholar]
- 22.Israelachvili JN, Chen YL, Yoshizawa H. Relationship between adhesion and friction forces. J Adhes Sci Technol. 1994;8(11):1231–1249. [Google Scholar]
- 23.Valtiner M, Banquy X, Kristiansen K, Greene GW, Israelachvili JN. The electrochemical surface forces apparatus: The effect of surface roughness, electrostatic surface potentials, and anodic oxide growth on interaction forces, and friction between dissimilar surfaces in aqueous solutions. Langmuir. 2012;28(36):13080–13093. doi: 10.1021/la3018216. [DOI] [PubMed] [Google Scholar]
- 24.Wong JSS, Hong LA, Bae SC, Granick S. Fluorescence recovery after photobleaching measurements of polymers in a surface forces apparatus. J Polym Sci B Polym Phys. 2010;48(24):2582–2588. [Google Scholar]
- 25.Alig ARG, Gourdon D, Israelachvili J. Properties of confined and sheared rhodamine B films studied by SFA-FECO spectroscopy. J Phys Chem B. 2007;111(1):95–106. doi: 10.1021/jp050783g. [DOI] [PubMed] [Google Scholar]
- 26.Golan Y, et al. The X-ray surface forces apparatus for simultaneous X-ray diffraction and direct normal and lateral force measurements. Rev Sci Instrum. 2002;73(6):2486–2488. [Google Scholar]
- 27.Perez E, Li F, Tareste D, Pincet F. The surface force apparatus to reveal the energetics of biomolecules assembly. Application to DNA bases pairing and SNARE fusion proteins folding. Cell Mol Bioeng. 2008;1(4):240–246. [Google Scholar]
- 28.Stryer L, Haugland RP. Energy transfer: A spectroscopic ruler. Proc Natl Acad Sci USA. 1967;58(2):719–726. doi: 10.1073/pnas.58.2.719. [DOI] [PMC free article] [PubMed] [Google Scholar]
- 29.Helms V. Principles of Computational Cell Biology. Wiley–Blackwell; Weinheim, Germany: 2008. [Google Scholar]
- 30.McNew JA, et al. Close is not enough: SNARE-dependent membrane fusion requires an active mechanism that transduces force to membrane anchors. J Cell Biol. 2000;150(1):105–117. doi: 10.1083/jcb.150.1.105. [DOI] [PMC free article] [PubMed] [Google Scholar]
- 31.Melia TJ, et al. Regulation of membrane fusion by the membrane-proximal coil of the t-SNARE during zippering of SNAREpins. J Cell Biol. 2002;158(5):929–940. doi: 10.1083/jcb.200112081. [DOI] [PMC free article] [PubMed] [Google Scholar]
- 32.Weninger K, Bowen ME, Choi UB, Chu S, Brunger AT. Accessory proteins stabilize the acceptor complex for synaptobrevin, the 1:1 syntaxin/SNAP-25 complex. Structure. 2008;16(2):308–320. doi: 10.1016/j.str.2007.12.010. [DOI] [PMC free article] [PubMed] [Google Scholar]
- 33.Xiao W, Poirier MA, Bennett MK, Shin YK. The neuronal t-SNARE complex is a parallel four-helix bundle. Nat Struct Biol. 2001;8(4):308–311. doi: 10.1038/86174. [DOI] [PubMed] [Google Scholar]


