Abstract
All cellular materials are partitioned between daughters at cell division, but by various mechanisms and with different accuracy. In the yeast Schizosaccharomyces pombe the mitochondria are pushed to the cell poles by the spindle. We find that mitochondria spatially re-equilibrate just before division, and that the mitochondrial volume and DNA-containing nucleoids instead segregate in proportion to the cytoplasm inherited by each daughter. However, nucleoid partitioning errors are suppressed by control at two levels: mitochondrial volume is actively distributed throughout a cell, and nucleoids are spaced out in semi-regular arrays within mitochondria. During the cell cycle, both mitochondria and nucleoids by contrast appear to be produced without feedback, creating a net control of fluctuations that is just accurate enough to avoid substantial growth defects.
Mitochondria are cytoplasmic organelles present in most eukaryotes. They generate much of the chemical energy of cells, and have key roles in signaling, apoptosis and disease (1–3). However, little is known about how their abundances or their DNA-containing nucleoids are controlled during the cell cycle or at cell division. (4–6)
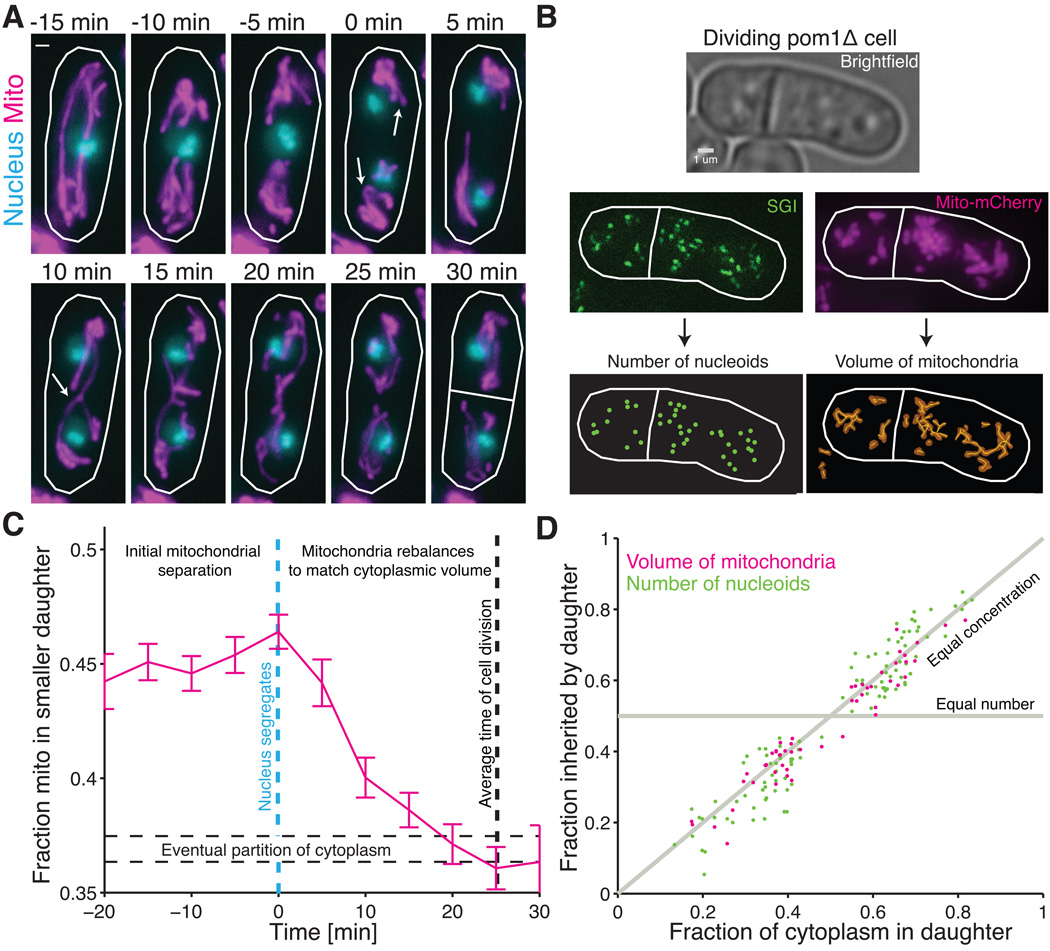
To quantitatively investigate these processes in the symmetrically dividing fission yeast Schizosaccharomyces pombe we developed methods to count nucleoids and measure the volume of mitochondoeria in single cells. Time-lapse imaging of mitochondrial matrix-targeted fluorescent mCherry protein confirmed previous observations that mitochondria are pushed to the cell poles by the mitotic spindle (7, 8) before cell division (Fig. 1A) in roughly equal amounts regardless of where the cell eventually divides. This seemed to support theoretical predictions that mitochondria segregate by being pushed or pulled into each cell half, as observed for most other DNA molecules, from bacterial plasmids (9) to chromosomes. However, in the last 15% of the cell cycle -- after chromosome segregation but before cytokinesis -- the mitochondria escaped from the poles and spatially re-equilibrated throughout the length of the cell, in virtually every cell observed both for wild type (Fig. 1A) and asymmetrically dividing mutants (pom1Δ, Fig. 1B,C and S1). Movement to the poles was independent of Mmb1p and re-equilibration of mitochondria occurred when mitochondria co-localized with the newly formed microtubule network (see Supplementary Text and Fig. S2 and S3). Quantifying exact volumes of mitochondria via 3D image analysis (10) showed that mitochondrial partitioning occurs by a qualitatively different principle, conserving concentrations rather than numbers when cell division is asymmetrical (Fig. 1D), supporting the hypothesis that mitochondrial movement to the poles instead is used to facilitate proper spindle alignment (8).
Figure 1.
Spatial re-equilibration of mitochondria and nucleoids after nuclear segregation matches cytoplasmic division. (A) Timelapse images of a dividing wild-type cell (RJP041) with mitochondrial matrix-targeted mCherry (magenta) and green fluorescent protein (GFP) labeled nuclei (cyan). Arrows at 0 min indicate initial separation of nuclei and further bunching of the mitochondria to the poles and then reformation of a continuous mitochondrial network at 10 min but before division at 30 min. (B) For individual dividing pom1Δ cells (RJP025), the number of nucleoids in each daughter cell was determined with semi-automated spot detection of SGI signal, and the mitochondrial volume in each cell half was determined using the surface-based volume reconstruction from the MitoGraph software package (10). (C) Fraction of mitochondria in the part of the cell region that will eventually become the smaller daughter as a function of time for pom1Δ cells (RJP042). Images of cells as in (A) were taken every 5 minutes and aligned to when nuclei first separated (blue dashed line). Average cell division occurred 25 minutes after nuclear separation, with approximately 37% of cytoplasmic volume inherited by smaller daughter (dashed horizontal lines). Error bars indicate standard error of the mean (s.e.m.). Dashed horizontal lines represent the average partition of the cytoplasm ±1 s.e.m. (n=91 cells) (D) The fraction of nucleoids and of mitochondrial volume in each pom1Δ daughter cell as computed in (B), plotted as a function of the fraction of cytoplasmic volume in each daughter cell. The coefficient of determination between cytoplasmic volume and nucleoids is r2=0.88 (102 cells) and for cytoplasmic volume and mitochondrial volume is r2=0.88 (52 cells). All scale bars indicate 1 um.
Because the migration of the mitochondria to the poles has all the appearances of an active segregation mechanism, and coincided with the segregation of nuclear DNA, we considered whether the nucleoids were still segregated by this mechanism, i.e., whether nucleoids remained in the cell half in which they were originally placed by the spindle even after most of the mitochondrial volume re-equilibrated. Counting mitochondrial nucleoids was not previously possible because of the interfering signal from nuclear DNA and we therefore optimized existing staining procedures (11) using the dye Sybr Green I (SGI, Molecular Probes) and cross-validated it with two other single cell methods (Fig. S4–S6). SGI stains almost all nucleoids in the cell (~85%, Fig. S7) but the necessary washing procedure perturbs their exact spatial positions. Simply counting copies within each newly divided cell revealed that the nucleoids segregated in proportion to the cytoplasmic volume in each daughter (Fig 1D and S8), just as with mitochondria.
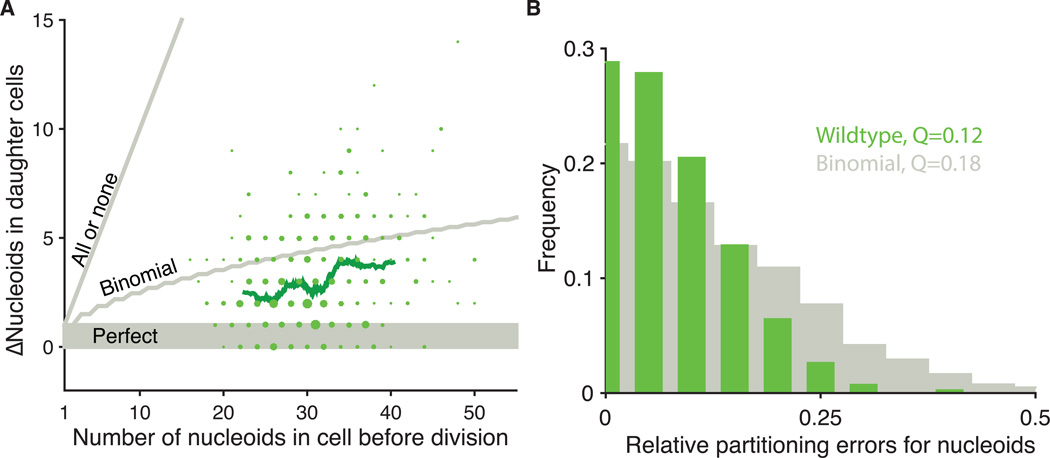
The mitochondrial volume and nucleoids thus on average segregate in proportion to the available cytoplasmic volume (Fig. 1D), more like passively segregating RNAs and proteins than actively segregating chromosomes. However, the nucleoids showed smaller deviations from the average trend than expected from passive mechanisms (Fig. 2 and S9–S11). Specifically, without active placement, low-abundance components should display at least binomial errors, and larger errors yet if spatial locations are randomized by upstream factors. The observed nucleoid errors were instead substantially subbinomial.
Figure 2.
Partitioning of mitochondria and nucleoids to daughter cells. (A) The absolute difference between the number of nucleoids segregated between wild-type sister cells plotted against the total number of nucleoids (RJP005 and DH60). The areas of plotted points are proportional to the number of observations. The green line represents a running average of 80 points. Gray lines indicate models of perfect, binomial and all-or-none segregation. 76% of cells segregate better than binomial, including 28% that are perfect. 24% segregate worse than binomial. Binomial predictions assumed that each nucleoid had the same chance of being inherited by either daughter (n=420 cells) More spot overlap in daughters with higher numbers can also reduce the observed error slightly, but appears to contribute marginally since we observe even more strongly sub-binomial errors in cells where each daughter gets as few as 10 copies. (B) The same data as (A) plotted as histogram of relative errors for nucleoid segregation compared to a binomial model. Q is defined as: where L and R are the number of nucleoids that partition to the left and right daughter cells respectively, and the angle brackets represent averages over all cells (22).
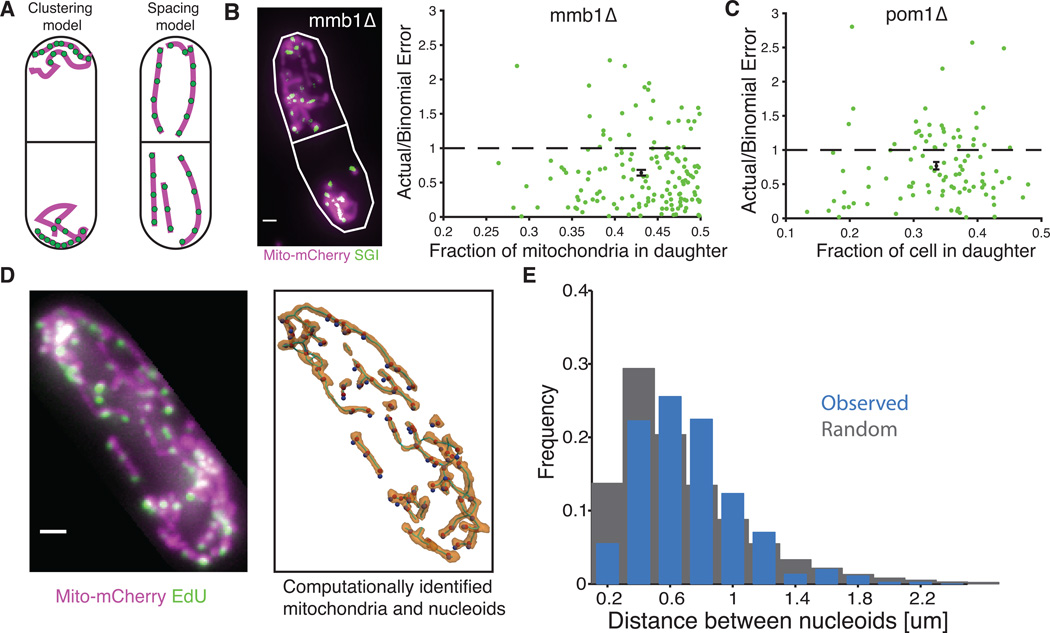
These observations could be reconciled by a conceptually simple mechanism whereby nucleoids are regularly spaced within mitochondria and the mitochondrial volume is evenly distributed through cells (Fig. 3A), similarly to how carboxysomes segregate in cyanobacteria (12). Semi-regular spacing was in fact suggested for nucleoids in human and budding yeast cells (13–15), but not linked to segregation because it was unclear if the regularity was consistent throughout mitochondria, and because nucleoid segregation further depends on how the mitochondrial volume segregates. Localization patterns can also change greatly at the time of division, e.g. nucleoids could be moved to specific locations in cells or accurately sorted into clusters that then were actively placed in both daughter cells.
Figure 3.
Requirement of accurate mitochondrial segregation and regular spacing of nucleoids within mitochondria to produce accurate segregation of nucleoids. (A) Two models of how nucleoids could be segregated accurately to daughter cells: 1) Measured and ordered clustering or 2) regular spacing within mitochondria that are themselves evenly partitioned between cells. (B) Left: image of mmb1Δ with mito-mcherry (magenta) and SGI (green). Right: Nucleoid segregation error normalized to the binomial model plotted against the degree of asymmetric mitochondrial division in mmb1Δ cells. (C) Nucleoid segregation error normalized to the binomial model plotted against the degree of asymmetric division in pom1Δ cells. The green points are individual cells and the black point is their average. Error bars indicate s.e.m. (D) Left: A fixed cell (RJP028) with mito-mCherry (magenta) and EdU-labeled nucleoids (green). Right: The same cell analyzed with Mitograph (10) to identify mitochondria (gold) and nucleoids (blue dots). Nucleoids were then projected onto the nearest part of the mitochondrial network (red dots). (E) A histogram of the actual distances between neighbor nucleoids for 1,871 nucleoids in 24 cells (blue) and randomly redistributed nucleoids within the mitochondrial network (gray). Redistributed nucleoids were restricted to be farther apart than the microscope resolution limit. This again shows that the sub-binomial errors do not reflect higher under-counting in the daughter with more copies.
To test clustering and spacing models of nucleoid segregation (Fig. 3A) we disrupted the mitochondrial spatial patterns using an mmb1Δ mutant in which mitochondria cannot attach to microtubule filaments (16), and used our quantitative post-mortem assay to count nucleoids and measure the cytoplasmic and mitochondrial volumes in newly divided cells. Both mitochondria and nucleoids now segregated with large errors compared to the cytoplasmic volume, but the number of nucleoids on average tracked the mitochondrial volume. Given the fraction of mitochondrial volume in each individual daughter cell, the number of nucleoids also still displayed sub-binomial errors (Fig. 3B, S12 and S13). For example, if the two daughters received 30% and 70% of the mitochondrial volume respectively, on average 30% of nucleoids went into the first daughter and 70% went into the other, but the statistical error was lower than expected from independent sorting with those probabilities. Mmb1-based control is thus required for accurate segregation of the mitochondrial volume (16), perhaps because mitochondria are too large and filamentous (7, 16, 17) to achieve spatial uniformity by free diffusion, whereas nucleoid segregation uses an additional level of control within the mitochondria. These observations rule out many nucleoid sorting models. For example, if nucleoids were accurately sorted into clusters but the mitochondria were randomized, nucleoids would not display sub-binomial errors even after accounting for the randomized mitochondrial volume. However, the results are exactly as expected if nucleoids are regularly spaced out within mitochondria, in which case only the total amount of mitochondria in each cell matters. To further test this model, we used the asymmetrically dividing pom1Δ mutant to measure the statistical partitioning errors versus the septum location. When cells divided asymmetrically, the error in nucleoid numbers was still subbinomial with probabilities set by the relative cytoplasmic volumes (Fig 3C, S9 and S10). This is again as expected from the regular spacing model and rules out numerous alternatives, e.g. models in which filaments push or pull nucleoids into specific locations in opposite cell halves (Fig. 3A). To be consistent with these data, any putative mechanism for counting nucleoids into clusters -- the main alternative to spacing -- would not only need to place nucleoids in each daughter regardless of the septum position and reliably count copies, but also sense the relative position of the septum and adjust numbers accordingly. The simplest spacing model by contrast predicts all observed phenotypes directly (Fig. 3A).
To directly observe spatial patterns of nucleoids, we then developed a method to visualize the native spatial locations of nucleoids within mitochondria. We used a strain of S. pombe that expressed a mitochondrial matrix-targeted mCherry and could incorporate 5-ethynyl-2'-deoxyuridine (EdU) into nucleoids (18), which can be visualized through ligation of a bright fluorophore (19). This method requires fixed cell-cycle arrested cells, but unlike the SGI assay above, it allows us to visualize native mitochondrial morphology and nucleoid positions in interphase cells (see methods). It also side-steps the problem that even the most monomeric GFPs may not be monomeric enough (20) to faithfully report the localization of DNA in situations where many copies are in close proximity (21), as mtDNA copies are in nucleoids. Mapping both the mitochondrial network and the position of nucleoids (Fig. 3D) showed that nucleoids were indeed semi-regularly spaced within mitochondria (Fig. 3E), and the level of regularity can quantitatively explain the low nucleoid segregation errors (Fig. S14). The molecular mechanisms underlying even spacing are not known but we find that the sub-binomial partitioning is unchanged by the fission inhibiting drug, mdivi-1 (Fig. S15).
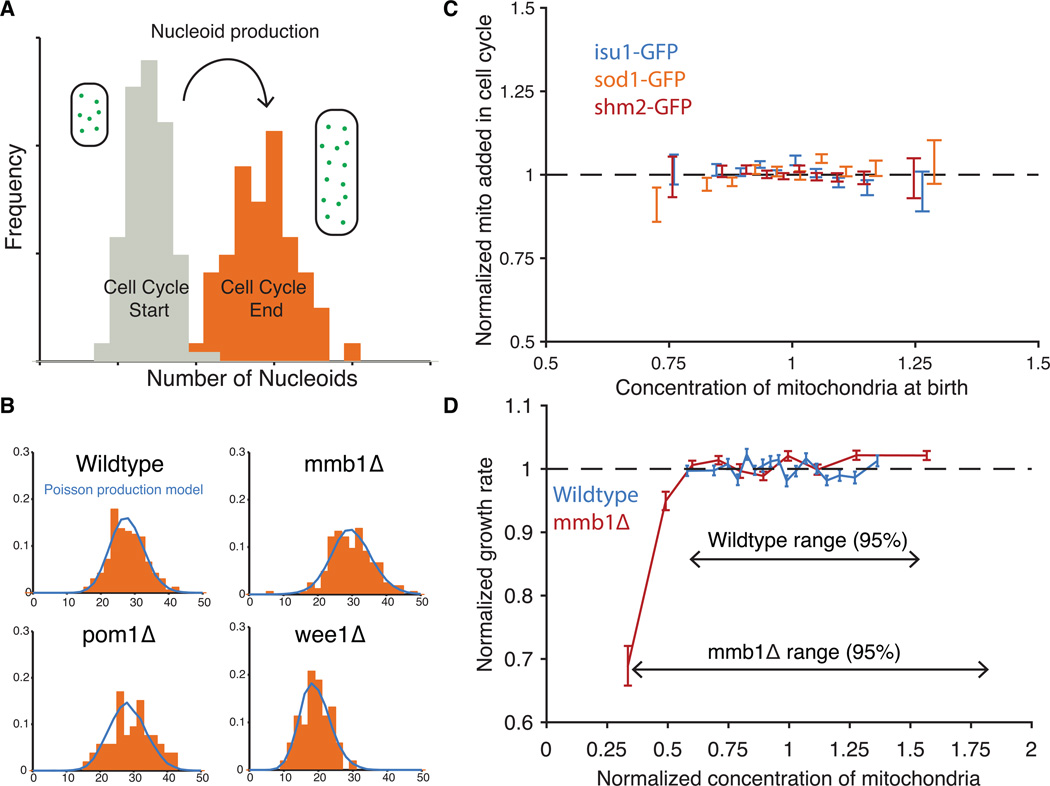
To evaluate the control of nucleoid production, we compared the distribution of nucleoid numbers in cells at the beginning and end of the cell cycle (Fig. 4A). The difference was well-described by a Poisson distribution (Fig. 4B), as expected if new nucleoids were added independently of the current number of nucleoids. It is possible that extrinsic noise sources or effects of self-replication cancel out against noise suppression mechanisms, but this seems unlikely because mmb1Δ, pom1Δ and wee1Δ mutants were also well-described by Poisson production despite having very different segregation errors (Fig. 4B). We further developed a microfluidic device that keeps growth conditions exceptionally constant over time (see Supplementary Methods), and tracked the abundance of several mitochondrial proteins fused to GFP. The amount of protein produced during the cell cycle did not depend on the initial amount inherited: similarly-sized newborn cells expressed the same amount of the mitochondrial proteins, on average, regardless of the starting amount (Fig 4C). Thus neither nucleoids nor mitochondrial proteins appear to use feedback control for production, but rather passively control errors by regressing to the mean with constant production, much like cell size control of bacteria (23). This makes sense in the light of theoretical work showing that feedback-driven noise suppression is mechanistically challenging and energetically expensive (24, 25).
Figure 4.
Nucleoid and mitochondrial production is constant and cell growth depends on mitochondrial concentration. (A) Schematic of data used to infer nucleoid production. In dividing cells, the number of nucleoids was measured for both newborn daughter cells (grey) and just divided mother cells (orange) and then normalized to the average volume of each population. (B) To model nucleoid production without feedback control, a Poisson distribution based on the average number of nucleoids at the beginning of the cell cycle was added to the full distribution of nucleoids at the beginning of the cell cycle. The resulting distribution is plotted in blue against the actual data from the end of the cell cycle (orange) for each strain. On average over all datasets and strains, the standard deviation predicted by the Poisson model differed from the actual data by 15%. (C) Total mitochondria added during the cell cycle divided by the added volume is plotted against the concentration of mitochondria in newborn cells. Both are normalized by their respective averages. The fluorescence signals of mitochondrially-localized GFP fusion proteins were used as a proxy of the amount of mitochondria in the cell. A running average of data is shown with error bars representing the s.e.m. of the observations. (isu1-GFP: n=835 cells, sod1-GFP:n= 1167 cells, shm2-GFP: n= 2720 cells (D) The normalized growth rate of cells is plotted against the normalized concentration of mitochondria for both WT (n=3582 cells) and mmb1Δ (n=2056 cells). Each point is an average of 200 cells and error bars are ±1 s.e.m.
We show that the noise control of mitochondrial nucleoids in S. pombe is qualitatively different from the control of chromosomes or macromolecules. Chromosomes use substantial resources to ensure that each copy replicates once per cell cycle, with much less than Poisson noise, whereas mRNAs and proteins generally display super-Poisson noise in production because of expression bursts or variation in the gene expression machinery (26). Mitochondrial nucleoids show Poisson production, as if they use passive control but inherit no fluctuations from the production machinery or from self-replication. At cell division, chromosomes are allocated in equal numbers to daughter cells regardless of volume differences, whereas cytoplasmic mRNAs and proteins on average segregate in proportion to cytoplasmic volume but with at least binomial partitioning errors (27). Mitochondrial nucleoids instead use active control at two levels to ensure that they segregate in proportion to cytoplasmic volume but with sub-binomial errors due to semiregular spacing. This achieves relatively small noise in concentrations, despite low numbers of segregating units and random differences in cytoplasmic volume between daughter cells, and may reflect that mitochondria are a key source of metabolite, lipid, and energy production, and therefore may be needed in proportion to the size of the individual cell. Indeed we find that growth rates were very similar across the range of natural variation in mitochondrial concentrations, whereas cells with lower concentrations than that showed significant growth defects (Fig. 4D and S16).
Supplementary Material
Acknowledgments
JP, RJ and YJ are supported by NIH Grant GM095784 and NSF Award 1137676. RJ was also supported by NIH Training Grant GM080177. YJ was also supported by the Samsung Scholarship. MPV and SMR are supported by NSF grant MCB-1330451. SMR is also supported by the Ellison Medical Foundation. We would like to thank B. Ward, S. Reuveni, Z. Wunderlich and S. Bakshi for helpful discussions and critical reading of the manuscript, D. Landgraf, F. Winston, N. Rhind, B. Westermann and T. Fox for gifts of strains and reagents.
References
- 1.Liu Z, Butow RA. Mitochondrial Retrograde Signaling. Annu. Rev. Genet. 2006;40:159–185. doi: 10.1146/annurev.genet.40.110405.090613. [DOI] [PubMed] [Google Scholar]
- 2.Hoppins S, Nunnari J. Mitochondrial Dynamics and Apoptosis--the ER Connection. Science. 2012;337:1052–1054. doi: 10.1126/science.1224709. [DOI] [PubMed] [Google Scholar]
- 3.Duchen MR. Mitochondria in health and disease: perspectives on a new mitochondrial biology. Molecular Aspects of Medicine. 2004;25:365–451. doi: 10.1016/j.mam.2004.03.001. [DOI] [PubMed] [Google Scholar]
- 4.Mukherji S, O'Shea EK. Mechanisms of organelle biogenesis govern stochastic fluctuations in organelle abundance. Elife. 2014;3:e02678. doi: 10.7554/eLife.02678. [DOI] [PMC free article] [PubMed] [Google Scholar]
- 5.Chan YHM, Marshall WF. How Cells Know the Size of Their Organelles. Science. 2012;337:1186–1189. doi: 10.1126/science.1223539. [DOI] [PMC free article] [PubMed] [Google Scholar]
- 6.Rafelski SM, et al. Mitochondrial network size scaling in budding yeast. Science. 2012;338:822–824. doi: 10.1126/science.1225720. [DOI] [PMC free article] [PubMed] [Google Scholar]
- 7.Yaffe MP, Stuurman N, Vale RD. Mitochondrial positioning in fission yeast is driven by association with dynamic microtubules and mitotic spindle poles. Proc Natl Acad Sci USA. 2003;100:11424–11428. doi: 10.1073/pnas.1534703100. [DOI] [PMC free article] [PubMed] [Google Scholar]
- 8.Krüger N, Tolić-Nørrelykke IM. Association of mitochondria with spindle poles facilitates spindle alignment. Current Biology. 2008;18:R646–R647. doi: 10.1016/j.cub.2008.06.069. [DOI] [PubMed] [Google Scholar]
- 9.Garner EC, Campbell CS, Weibel DB, Mullins RD. Reconstitution of DNA segregation driven by assembly of a prokaryotic actin homolog. Science. 2007;315:1270–1274. doi: 10.1126/science.1138527. [DOI] [PMC free article] [PubMed] [Google Scholar]
- 10.Viana MP, Lim S, Rafelski SM. Quantifying mitochondrial content in living cells. Elsevier Ltd; 2015. [DOI] [PubMed] [Google Scholar]
- 11.Briggs C, Jones M. SYBR Green I-induced fluorescence in cultured immune cells: A comparison with Acridine Orange. Acta Histochemica. 2005;107:301–312. doi: 10.1016/j.acthis.2005.06.010. [DOI] [PubMed] [Google Scholar]
- 12.Savage DF, Afonso B, Chen AH, Silver PA. Spatially Ordered Dynamics of the Bacterial Carbon Fixation Machinery. Science. 2010;327:1258–1261. doi: 10.1126/science.1186090. [DOI] [PubMed] [Google Scholar]
- 13.Tauber J, et al. Distribution of mitochondrial nucleoids upon mitochondrial network fragmentation and network reintegration in HEPG2 cells. International Journal of Biochemistry and Cell Biology. 2013;45:593–603. doi: 10.1016/j.biocel.2012.11.019. [DOI] [PubMed] [Google Scholar]
- 14.Iborra FJ, Kimura H, Cook PR. The functional organization of mitochondrial genomes in human cells. BMC Biol. 2004;2:9. doi: 10.1186/1741-7007-2-9. [DOI] [PMC free article] [PubMed] [Google Scholar]
- 15.Osman C, Noriega TR, Okreglak V, Fung JC, Walter P. Integrity of the yeast mitochondrial genome, but not its distribution and inheritance, relies on mitochondrial fission and fusion. Proc Natl Acad Sci USA. 2015;112:E947–E956. doi: 10.1073/pnas.1501737112. [DOI] [PMC free article] [PubMed] [Google Scholar]
- 16.Fu C, Jain D, Costa J, Velve-Casquillas G, Tran PT. mmb1p Binds Mitochondria to Dynamic Microtubules. Current Biology. 2011;21:1431–1439. doi: 10.1016/j.cub.2011.07.013. [DOI] [PMC free article] [PubMed] [Google Scholar]
- 17.Yaffe MP, et al. Microtubules mediate mitochondrial distribution in fission yeast. Proc Natl Acad Sci USA. 1996;93:11664–11668. doi: 10.1073/pnas.93.21.11664. [DOI] [PMC free article] [PubMed] [Google Scholar]
- 18.Sivakumar S, Porter-Goff M, Patel PK, Benoit K, Rhind N. In vivo labeling of fission yeast DNA with thymidine and thymidine analogs. Methods. 2004;33:213–219. doi: 10.1016/j.ymeth.2003.11.016. [DOI] [PMC free article] [PubMed] [Google Scholar]
- 19.Salic A, Mitchison TJ. A chemical method for fast and sensitive detection of DNA synthesis in vivo. Proc. Natl. Acad. Sci. U.S.A. 2008;105:2415–2420. doi: 10.1073/pnas.0712168105. [DOI] [PMC free article] [PubMed] [Google Scholar]
- 20.Landgraf D, Okumus B, Chien P, Baker TA, Paulsson J. Segregation of molecules at cell division reveals native protein localization. Nat Meth. 2012;9:480–482. doi: 10.1038/nmeth.1955. [DOI] [PMC free article] [PubMed] [Google Scholar]
- 21.Tal S, Paulsson J. Evaluating quantitative methods for measuring plasmid copy numbers in single cells. Plasmid. 2012;67:167–173. doi: 10.1016/j.plasmid.2012.01.004. [DOI] [PMC free article] [PubMed] [Google Scholar]
- 22.Huh D, Paulsson J. Random partitioning of molecules at cell division. Proc. Natl. Acad. Sci. U.S.A. 2011;108:15004–15009. doi: 10.1073/pnas.1013171108. [DOI] [PMC free article] [PubMed] [Google Scholar]
- 23.Taheri-Araghi S, et al. Cell-Size Control and Homeostasis in Bacteria. Current Biology. 2015;25:385–391. doi: 10.1016/j.cub.2014.12.009. [DOI] [PMC free article] [PubMed] [Google Scholar]
- 24.Lestas I, Vinnicombe G, Paulsson J. Fundamental limits on the suppression of molecular fluctuations. Nature. 2010;467:174–178. doi: 10.1038/nature09333. [DOI] [PMC free article] [PubMed] [Google Scholar]
- 25.Paulsson J, Ehrenberg M. Noise in a minimal regulatory network: plasmid copy number control. Q. Rev. Biophys. 2001;34:1–59. doi: 10.1017/s0033583501003663. [DOI] [PubMed] [Google Scholar]
- 26.Ozbudak EM, Thattai M, Kurtser I, Grossman AD, van Oudenaarden A. Regulation of noise in the expression of a single gene. Nat. Genet. 2002;31:69–73. doi: 10.1038/ng869. [DOI] [PubMed] [Google Scholar]
- 27.Rosenfeld N, Young JW, Alon U, Swain PS, Elowitz MB. Gene regulation at the single-cell level. Science. 2005;307:1962–1965. doi: 10.1126/science.1106914. [DOI] [PubMed] [Google Scholar]
- 28.Haffter P, Fox TD. Nuclear mutations in the petite-negative yeast Schizosaccharomyces pombe allow growth of cells lacking mitochondrial DNA. Genetics. 1992;131:255–260. doi: 10.1093/genetics/131.2.255. [DOI] [PMC free article] [PubMed] [Google Scholar]
- 29.Neumann FR, Nurse P. Nuclear size control in fission yeast. The Journal of Cell Biology. 2007;179:593–600. doi: 10.1083/jcb.200708054. [DOI] [PMC free article] [PubMed] [Google Scholar]
- 30.Hua H, Kearsey SE. Monitoring DNA replication in fission yeast by incorporation of 5-ethynyl-2'-deoxyuridine. Nucleic Acids Research. 2011;39:e60–e60. doi: 10.1093/nar/gkr063. [DOI] [PMC free article] [PubMed] [Google Scholar]
- 31.Skinner SO, lveda LASU, Xu H, Golding I. Measuring mRNA copy number in individual Escherichia coli cells using single-molecule fluorescent in situ hybridization. Nature Protocols. 2013;8:1100–1113. doi: 10.1038/nprot.2013.066. [DOI] [PMC free article] [PubMed] [Google Scholar]
- 32.Sliusarenko O, Heinritz J, Emonet T, Jacobs-Wagner C. High-throughput, subpixel precision analysis of bacterial morphogenesis and intracellular spatiotemporal dynamics. Molecular Microbiology. 2011;80:612–627. doi: 10.1111/j.1365-2958.2011.07579.x. [DOI] [PMC free article] [PubMed] [Google Scholar]
- 33.Wu J-Q, Pollard TD. Counting cytokinesis proteins globally and locally in fission yeast. Science. 2005;310:310–314. doi: 10.1126/science.1113230. [DOI] [PubMed] [Google Scholar]
- 34.Norman TM, Lord ND, Paulsson J, Losick R. Memory and modularity in cellfate decision making. Nature. 2013;503:481–486. doi: 10.1038/nature12804. [DOI] [PMC free article] [PubMed] [Google Scholar]
- 35.Westermann B, Neupert W. Mitochondria-targeted green fluorescent proteins: convenient tools for the study of organelle biogenesis in Saccharomyces cerevisiae. Yeast. 2000;16:1421–1427. doi: 10.1002/1097-0061(200011)16:15<1421::AID-YEA624>3.0.CO;2-U. [DOI] [PubMed] [Google Scholar]
- 36.Bähler J, et al. Heterologous modules for efficient and versatile PCR-based gene targeting in Schizosaccharomyces pombe. Yeast. 1998;14:943–951. doi: 10.1002/(SICI)1097-0061(199807)14:10<943::AID-YEA292>3.0.CO;2-Y. [DOI] [PubMed] [Google Scholar]
- 37.Chu Z, et al. Adaptive expression responses in the Pol-γ null strain of S. pombe depleted of mitochondrial genome. BMC Genomics. 2007;8:323–11. doi: 10.1186/1471-2164-8-323. [DOI] [PMC free article] [PubMed] [Google Scholar]
- 38.Kim D-U, et al. Analysis of a genome-wide set of gene deletions in the fission yeast Schizosaccharomyces pombe. Nat Biotechnol. 2010;28:617–623. doi: 10.1038/nbt.1628. [DOI] [PMC free article] [PubMed] [Google Scholar]
Associated Data
This section collects any data citations, data availability statements, or supplementary materials included in this article.


