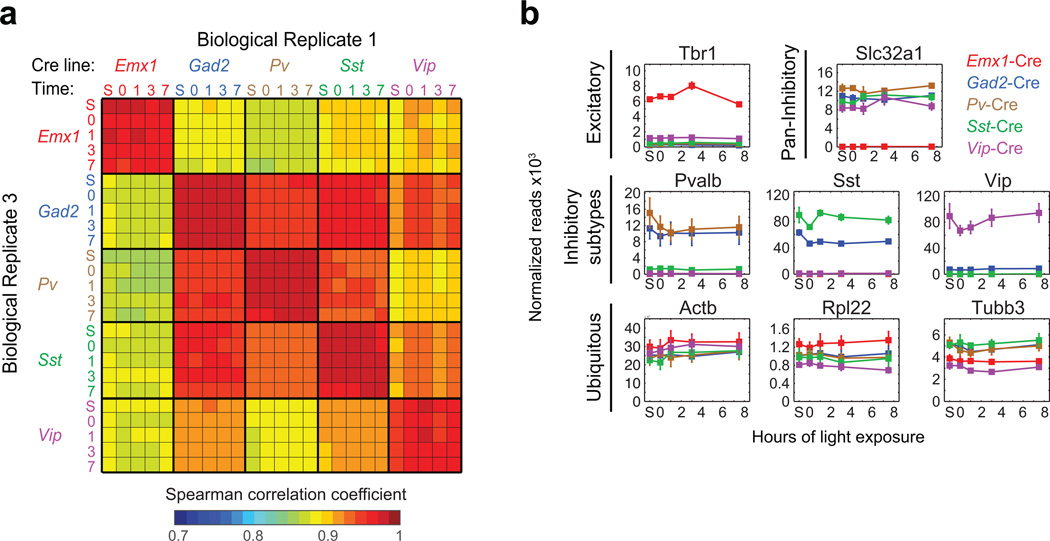
Extended Data Figure 2. Validation of the RiboTag-Seq approach.
a) Matrix of Spearman correlation coefficients between biological replicates across all samples (Scale of correlation coefficients extends from 0.7 to 1, see color bar) (S = standard housing, 0 = dark-housed only, 1/3/7.5 = 1/3/7.5 hours of light exposure after dark housing).
b) Line plots of RNA-Seq data showing the expression values (normalized reads across all exons of a gene) for cell-type-specific marker genes and ubiquitously expressed house-keeping genes in different Cre lines (Emx1-Cre: red; Gad2-Cre: blue, Pv-Cre: brown, Sst-Cre: green, and Vip-Cre: purple) across all time points of the experiment. Data represent the mean and standard error of three biological replicates.

