

Abstract
Background
Recent genome wide association studies (GWAS) have identified 49 single nucleotide polymorphisms (SNPs) associated with clinical CAD. The mechanism by which these loci influence risk remains largely unclear.
Methods and Results
We examined the association between a genetic risk score (GRS) composed of high-risk alleles at the 49 SNPs and the degree of subclinical coronary atherosclerosis in 7,798 participants from six studies stratified into four age groups at the time of assessment (15-34, 35-54, 55-74, >75 years). Atherosclerosis was quantified by staining and direct visual inspection of the right coronary artery in the youngest group, and by scanning for coronary artery calcification in the remaining groups. We defined cases as subjects within the top quartile of degree of atherosclerosis in three groups and as subjects with a CAC>0 in the fourth (35-54 years) where less than one quarter had any CAC. In our meta-analysis of all strata, we found one SD increase in the GRS increased the risk of advanced subclinical coronary atherosclerosis by 36% (p=8.3×10⁻²⁵). This increase in risk was significant in all four age groups including the youngest group where atherosclerosis consisted primarily of raised lesions without macroscopic evidence of plaque rupture or thrombosis. Results were similar when we restricted the GRS to 32 SNPs not associated with traditional risk factors (TRFs) and/or when we adjusted for TRFs.
Conclusions
A GRS for clinical CAD is associated with advanced subclinical coronary atherosclerosis throughout the life-course. This association is apparent even at the earliest, uncomplicated stages of atherosclerosis.
Keywords: genetic epidemiology; genetics, human; coronary artery calcification; coronary atherosclerosis; coronary artery disease
Introduction
Genome wide association studies (GWAS) over the last ∼8 years have identified 49 susceptibility variants robustly associated with clinically significant complications of CAD including myocardial infarction (MI), coronary artery bypass graft surgery (CABG), percutaneous coronary intervention (PCI), and/or angina1. The mechanisms by which most of these CAD loci influence the risk of clinical CAD remain largely unclear.
The effect on the risk of clinical CAD for each of these variants is small. However, the effects are independent and additive. Accordingly, the high-risk alleles at the variants can be aggregated into a single predictor of CAD through a multi-locus genetic risk score (GRS)2-4. Morrison et al. were among the first to illustrate the concept of GRS in the context of predicting CAD prior to the GWAS era, utilizing SNPs within candidate genes5. GRSs are now also routinely incorporated into Mendelian randomization studies as powerful instrumental variables that provide important insights on the nature of associations between various human traits6, 7.
We hypothesized that variants at these loci collectively facilitate the formation of coronary artery plaque throughout the life-course. To test this hypothesis, we investigated the association between a GRS constructed from 49 established susceptibility variants for clinical CAD8 with the presence of subclinical atherosclerosis among subjects with no previous history of clinical CAD. Subclinical atherosclerosis was estimated through direct pathologic examination of the right coronary artery (RCA) in the youngest subjects and through coronary artery calcification scores derived from computed tomography in the remaining subjects9. We selected these methods of assessment of subclinical atherosclerosis for two reasons. First, CAC scores are highly correlated with the overall plaque burden in the coronaries10. However, the prevalence of CAC is extremely low in subjects under the age of ∼50 years especially women11. Second, autopsy studies with direct visualization of coronary plaque provide the best alternative means of assessing the degree of subclinical coronary atherosclerosis in younger subjects. Many such studies have been performed in the past and have established strong correlations between the burden of raised atherosclerotic lesions observed in coronary arteries and the surrounding rates of clinically significant CAD in the community12-15.
Material and Methods
Study Population
The older control group in the Atherosclerotic Disease, Vascular functioN, and genetiC Epidemiology (ADVANCE)16 study served as our initial cohort for this analysis. To broaden our range of age at the time of assessment of subclinical atherosclerosis, we extended our analyses to several clinical and genetic datasets available through the NCBI's database of Genotypes and Phenotypes (dbGAP)17. These studies included the SNPs and the Extent of Atherosclerosis (SEA) study, an ancillary genetics study of the NIH sponsored Pathobiological Determinants of Atherosclerosis in Youth (PDAY) Study18, as well as four longstanding NHLBI prospective cohort studies: the Coronary Artery Risk Development in Young Adults Study (CARDIA)19, the Multi Ethnic Study of Atherosclerosis (MESA)20, the Framingham Heart Study (FHS)21, and the Cardiovascular Health Study (CHS)22. The Institutional Review Board at Stanford University approved the use of data from dbGAP to conduct this study. Furthermore, an institutional review committee approved each of the six studies and all living subjects gave informed consent. Data Supplement Table S1 lists accession numbers and embargo dates for all dbGAP files used.
We stratified subjects within each study into one of four age groups at the time of assessment of subclinical coronary atherosclerosis (15-34, 35-54, 55-74, >75 years). We formed the first age group based on the inclusion criteria for SEA. As the first age stratum included a range of age of 20 years, we selected the next 2 age-cutoffs to be at 20-year intervals as well. These cutoffs, while somewhat arbitrary, result in age groups that overlap reasonably well with clinically meaningful onset of disease (i.e. premature onset at <35 years of age observed almost exclusively in Mendelian disorders such familial hypercholesterolemia, early onset between 35 and 55 years of age, typical onset between 56 and 75 years especially for males, and late onset >75 years of age). As all SNPs to be tested were identified in European and/or South Asian populations, we restricted our analyses to study participants who self-reported European ancestry.
Phenotype measurement and Case definition
The subset of participants from these studies all had either a post mortem pathologic determination of the degree of subclinical coronary atherosclerosis (SEA) or an assessment of subclinical coronary atherosclerosis through a CAC study at a point in time when they had no history of clinical CAD (all other studies). Detailed descriptions the methods used to quantify subclinical atherosclerosis have been previously published18, 23-28 We provide a description of each study focused on the events leading up to participants' assessment for subclinical atherosclerosis as well as complete details on the methods of assessment of subclinical atherosclerosis in the Data Supplement.
We defined cases within each study and age stratum as those subjects within the stratum that were in the top sex-specific quartile of degree of subclinical atherosclerosis. In SEA, we ranked individual's degree of subclinical atherosclerosis by their sex-specific percent surface area of the RCA affected by “raised lesions”. We used the RCA because this was the only coronary artery where a global assessment of atherosclerosis extent was calculated18. We provide the definition and the characteristics of a “raised lesion” as well as a clear justification for selecting this phenotype in SEA over other atherosclerosis phenotypes documented in SEA in the Data Supplement. In the remaining studies, we ranked subjects by their sex-specific CAC score within each age stratum. For both males and females in CARDIA between the ages of 35-54, and for females in both FHS and MESA between the ages of 35-54, we defined cases as subjects with a CAC score > 0 as the 75% percentile CAC score was still 0 in these strata.
SNP Selection and Imputation
For the construction of the GRS, we selected independent SNPs (LD-pruned, r2 < 0.2) that had reached genome-wide significance at any time during the GWAS era (referred to as either “known” or “novel” CAD GWAS SNPs in Supplementary Table 9 of the CARDIOGRAMplusC4D manuscript1). Of the 153 “low false discovery rate” SNPs for CAD in that table, 49 met these criteria. As expected, only a small fraction of the 49 SNPs were genotyped in participants of the six studies given the various arrays used. To minimize the need to search for proxies, we used the genotype data within each study to impute additional SNPs. Each study was imputed separately using MaCH (v1.0.18.c)29 and Minimac software30. A two-stage imputation procedure was followed. First, we used MaCH to phase individuals across chromosome to estimate the haplotypes after first excluding SNPs with minor allele frequency (MAF) < 0.01, Hardy-Weinberg equilibrium (HWE) P < 1 × 10⁻⁶, call rate < 95% or large allele frequency discrepancies compared to the 1000 Genomes Project reference data using PLINK31. To ensure good quality of phased haplotypes, MaCH was run with the 20 rounds and 200 states for parameter estimation. Then, the phased haplotypes were compared to 1000 Genomes Project haplotypes (version 3 March 2012 release) for imputation using the OpenMP protocol based multi-threaded version of Minimac software with 20 rounds and 300 states for each chromosome.
Construction of the GRS
We calculated a weighted multi-locus GRS (wGRSs) for each individual by taking the sum of the products between the dosage of the high-risk alleles at each SNP and its corresponding β coefficient from the CARDIOGRAMplusC4D meta-analysis combining Stage 1 and 23. An un-weighted multi-locus GRS (GRS) was constructed by simply taking the sum of the dosage of high-risk alleles observed at the 49 SNPs. We further calculated a wGRS and GRS restricted to the subset of 32 SNPs not related to traditional risk factors in the assessment of the CARDIoGRAM+C4D consortium, which reported that 12 of the 49 SNPs were associated with lipids and 5 with blood pressure8.
Statistical Analysis
We used logistic regression to estimate the association between either a SNP or a GRS and case-control status. We adjusted for age and sex in our minimally adjusted models to account for any residual confounding by these variables within an age stratum. In all studies with CAC measures, we ran a second model that further adjusted for the presence of traditional risk factors assessed at the time of scanning including diabetes, smoking status (current, past, never), systolic blood pressure, use of antihypertensive drugs, total cholesterol, HDL cholesterol, and use of lipid-lowering agents. Further adjustment in SEA for traditional risk factors was not possible because such data was either not uniformly collected in the original autopsy cohort or not available in dbGAP.
We calculated overall odds ratios within each age stratum and across all age strata using random effects meta-analyses, and summarized our results using forest plots. We also calculated I2 to assess the proportion of observed variance in effect sizes across studies32.
To ensure that the data from the RCA in the SEA study could be expected to reflect coronary atherosclerosis more generally, we sought external evidence of correlation between the presence of subclinical atherosclerosis in the RCA and the left coronary arteries. First, we calculated the Pearson correlation between the prevalence of raised/fibrous lesions for each one-centimeter segment of the three arteries in the International Atherosclerosis Project (IAP) for up to 12 cm from their origin33. In addition, we calculated the Pearson correlation coefficients between the CAC scores in the RCA and the Left Main, LAD, and circumflex, respectively, in the CARDIA study.
Results
We analyzed a total of 7,798 participants of white/European ancestry from six studies covering a very broad age range at the time of assessment of subclinical atherosclerosis (18 to >85)(Table 1). Overall, 3,539 (45.4%) of all subjects had evidence of subclinical atherosclerosis based on either a percent surface area with raised lesions in the RCA that was > 0 or a CAC score that was > 0. A subset of 1,673 of these 3,539 subjects (21% of all subjects) across all cohorts met our case definition.
Table 1.
Descriptive statistics and quality control metrics for genetic data used to construct the GRS, stratified by age categories of interest.
| AGE STRATUM | <35 | 35-54 | 55-74 | 75+ | ||||||
|---|---|---|---|---|---|---|---|---|---|---|
|
| ||||||||||
| STUDY |
SEA (n = 564) |
CARDIA (n = 1084) |
FHS (n = 1980) |
MESA (n = 561) |
FHS (n = 978) |
MESA (n = 1215) |
ADVANCE (n = 633) |
FHS (n = 133) |
MESA (n = 340) |
CHS (n = 310) |
|
| ||||||||||
| Age: mean (SD) | 26.7 (5.0) | 41.2 (2.9) | 45.1 (5.2) | 49.8 (2.9) | 63.3 (5.7) | 64.7 (5.6) | 65.3 (2.9) | 78.3 (2.5) | 78.3 (2.6) | 79.8 (3.6) |
| Female (%) | 22.7 | 50.7 | 45.6 | 52.9 | 55.2 | 49.8 | 36.5 | 54.9 | 50.3 | 62.6 |
| 75th percentile for % surface area of RCA with raised lesions | ||||||||||
| Males | 1.6 | -- | -- | -- | -- | -- | -- | -- | -- | -- |
| Females | 0.4 | -- | -- | -- | -- | -- | -- | -- | -- | -- |
| 75th percentile CAC score | ||||||||||
| Males | -- | 0.0 | 14.0 | 23.2 | 520.6 | 342.2 | 537.1 | 1581.0 | 1084.0 | 1364.0 |
| Females | -- | 0.0 | 0.0 | 0.0 | 80.2 | 56.9 | 47.6 | 381.6 | 280.2 | 659.0 |
| No. (%) of cases using 75th percentile* | 140 (24.8) | 138 (12.7) | 376 (19.0) | 114 (20.3) | 245 (25.1) | 304 (25.0) | 159 (25.1) | 34 (25.6) | 85 (25.0) | 78 (25.2) |
| Raised lesions % surface area: mean | ||||||||||
| Cases | 16.3 | -- | -- | -- | -- | -- | -- | -- | -- | -- |
| Controls | 0.1 | -- | -- | -- | -- | -- | -- | -- | -- | -- |
| No. (%) with raised lesion % surface area = 0 | 383 (67.9) | -- | -- | -- | -- | -- | -- | -- | -- | -- |
| CAC: mean | ||||||||||
| Cases | -- | 77.1 | 175.0 | 137.6 | 806.9 | 682.6 | 979.7 | 1784.5 | 1416.2 | 1701.1 |
| Controls | -- | 0.0 | 0.4 | 0.6 | 61.5 | 39.8 | 83.1 | 306.5 | 158.4 | 281.6 |
| No. (%) with CAC = 0 | -- | 946 (87.3) | 1480 (74.7) | 413 (73.6) | 326 (33.3) | 483 (39.8) | 143 (22.6) | 10 (7.5) | 47 (13.8) | 28 (9) |
|
| ||||||||||
| GENOTYPING PLATFORM | Perlegen | Affymetrix 6.0 | Affymetrix 500K+50K | Affymetrix 500K+50K | Affymetrix 500K+50K | Affymetrix 6.0 | Metabochip | Affymetrix 500K+50K | Affymetrix 6.0 | Human CNV370v1 |
|
| ||||||||||
| No. of SNPs on Array | 106,285 | 909,622 | 549,782 | 549,782 | 549,782 | 909,622 | 196,725 | 549,782 | 909,622 | 339,971 |
| No. of 49 GRS SNPs on Array | 0 | 10 | 11 | 11 | 11 | 18 | 45 | 11 | 18 | 12 |
| No. of SNP used for imputation | 66,166 | 492,371 | 284,965 | 284,965 | 284,965 | 604,312 | 107,809 | 284,965 | 604,312 | 275,298 |
| Average r2 for imputed SNPs | 0.27 | 0.84 | 0.85 | 0.85 | 0.85 | 0.87 | 0.97 | 0.85 | 0.87 | 0.80 |
| Imputed SNPs with r2 > 0.3 (%) | 34.7 | 87.8 | 93.9 | 93.9 | 93.9 | d | 100.0 | 93.9 | 95.9 | 95.9 |
| weighted GRS: mean (SD) | 3.5 (0.22) | 3.6 (0.34) | 3.6 (0.34) | 3.6 (0.34) | 3.6 (0.34) | 3.6 (0.33) | 3.6 (0.37) | 3.6 (0.34) | 3.6 (0.33) | 3.6 (0.3) |
| GRS: mean (SD) | 48.2 (2.5) | 49 (4.2) | 48.9 (4.2) | 49.1 (4.3) | 48.8 (4.2) | 49.1 (4.2) | 49.1 (4.6) | 49.4 (4.1) | 48.8 (4.4) | 48.6 (3.8) |
SEA: SNPs and the Extent of Atherosclerosis; CARDIA: Coronary Artery Risk Development in Young Adults Study; FHS: Framingham Heart Study; MESA: Multi Ethnic Study of Atherosclerosis; ADVANCE: Atherosclerotic Disease Vascular functioN and genetiC Epidemiology; CHS: Cardiovascular Health Study; SD: standard deviation; CAC: coronary artery calcium; SF: surface area; RCA: right coronary artery;
when the 75th percentile for CAC score was equal to zero, we defined cases as subjects with a CAC > 0
As expected, the average imputation r2 for SEA was lower (0.27) than for the other studies (0.87), since it was based on a modest-sized custom SNP array, rather than a full commercial GWAS array (Table 1). None of the SNPs showed a significant departure from HWE in any population cohort. The mean weighted and un-weighted GRS involving all 49 SNPs was similar across studies and across age-strata (Table 1).
Consistent with studies using clinical endpoints as the outcomes, we found the two SNPs in the 9p21 region (rs1333049) to have the strongest association with subclinical disease (rs1333049: OR 1.45, 95% CI 1.31 to 1.61 and rs3217992: OR 1.27, 95% CI 1.14 to 1.40) (Data Supplement Table S2 and, Figure S1). The next strongest signals were for SNPs in the COL4A1/COL4A2 and CXCL12 loci. Associations between risk factors and CAC were as expected (Data Supplement Table S3).
The wGRS based on all 49 SNPs was strongly associated with subclinical CAD, both before and after adjusting for all traditional risk factors (Figure 1). The meta-analysis results for our minimally adjusted analysis demonstrates a 36% increase in risk of being a case with each SD increase in the wGRS (p=8.28×10⁻²⁵). The increase in risk was significant in every age stratum (meta-analysis .02 > p >1.54×10⁻¹³; I2 = 0%, p for test of heterogeneity = 0.89). Results were virtually unchanged after full adjustment for risk factors in the CAC studies. Results were similar when the wGRS was restricted to the 32 non-risk factor SNPs (Figure 2) as well as in the corresponding analyses using the unweighted GRS (Data Supplement Figures 2, 3).
Figure 1.


Forest plot of Odds Ratio for being in the top quartile of degree of subclinical atherosclerosis per SD increase of the weighted GRS constructed with 49 SNPs associated with clinical CAD in the CARDIoGRAM+C4D study. A. Odds ratios adjusted for age and sex. B. Odds Ratios further adjusted for traditional risk factors in the studies with coronary artery calcification scores. Box sizes are inversely proportional to the magnitude of the standard error for each study and indicate the relative weight of each study in the meta-analysis. A diamond indicates the summary effect estimate and 95% confidence interval. SEA indicates SNPs and the Extent of Atherosclerosis; CARDIA, Coronary Artery Risk Development in Young Adults Study; FHS, Framingham Heart Study; MESA, Multi Ethnic Study of Atherosclerosis; ADVANCE, Atherosclerotic Disease Vascular functioN and genetiC Epidemiology; CHS, Cardiovascular Health Study.
Figure 2.


Forest plot of Odds Ratio for being in the top quartile of degree of subclinical atherosclerosis per SD increase of the weighted GRS constructed with 32 SNPs associated with clinical CAD in the CARDIoGRAM+C4D study but not associated with traditional risk factors. A. Odds ratios adjusted for age and sex. B. Odds Ratios further adjusted for traditional risk factors in the studies with coronary artery calcification scores. See figure 1 for information on forest plot and study acronyms.
In the SEA study, most subjects defined as cases had between 1% and 30% of the surface area of their RCA covered with raised lesions (Figure 3). We could not exclude the subset of cases with evidence of more advanced and complex raised lesions, as an indicator variable for this phenotype is not available in dbGAP. However, we calculated that no more than 3.9% of the white SEA subjects we studied with raised lesions could have evidence of such lesions (Data Supplement Table S4).
Figure 3.
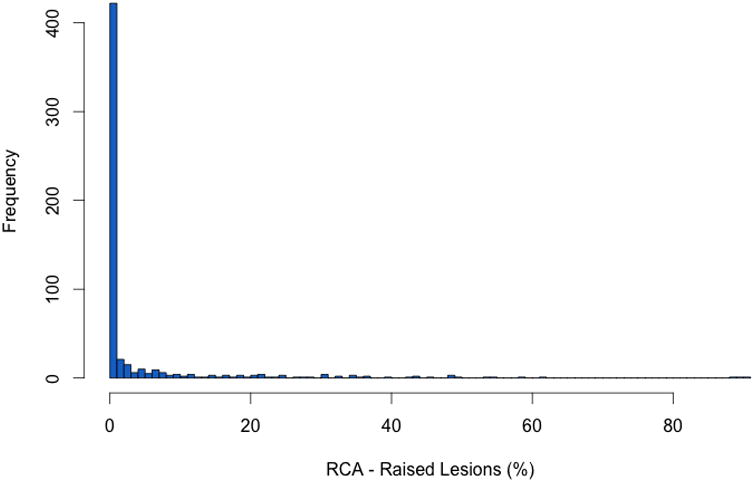
Distribution of the percentage of raised lesions in the right coronary artery in the SNPs and the Extent of Atherosclerosis study.
Figure 4 summarizes the ORs in SEA after applying three imputation quality cutoffs (r2> 0.3, r2>0.5, and r2>0.8). The strongest association was observed for a cutoff of r2> 0.3 which allowed for 17 of the 49 SNPs to be used in the construction of the GRS. However, we observed substantial overlap in the confidence intervals of all GRSs (Data Supplement Table S5). We also observed substantial variability in the imputation quality and the association results for each of the 49 SNPs in SEA (Data Supplement Table S6).
Figure 4.

Odds Ratio for being in the top quartile of degree of subclinical atherosclerosis in the SEA study as a function of the quality of the imputation (imputation r2) in SEA of the SNPs included in the weighted GRS. A higher imputation r2 threshold indicates more reliable imputation of genotypes. The number of SNPs included in the GRS at a given imputation threshold is included within brackets. GRS49 begins with all 49 SNPs associated with clinical CAD in the CARDIoGRAM+C4D study while GRS32 begins with the subset of SNPs that are not associated with traditional risk factors of CAD.
We found very high correlations between the prevalence of raised/fibrous lesions in the one-centimeter segments of the RCA and the LAD (r = 0.96, p < 0.001), the RCA and the CIRC (r = 0.91, p < 0.001), and the LAD and the CIRC (r = 0.97, p < 0.001) in the International Atherosclerosis Project (Data Supplement Table S7). We also found very high correlations between CAC scores in the RCA and the LAD (r = 0.91, p < 0.001) as well as the RCA and the CIRC (r = 0.94, p < 0.001) among CARDIA participants. These high correlations were maintained even when we restricted our analyses to subjects with CAC > 0 either in the RCA or the LAD (Data Supplement Table S8).
Discussion
We found that a multi-locus genetic risk score derived from the high risk alleles of SNPs associated with clinically evident CAD to be strongly associated with the presence of advanced subclinical atherosclerosis. The association was evident starting in young adulthood where subclinical coronary atherosclerosis consists almost exclusively of raised lesions without evidence of plaque rupture or thrombosis. We found the effect estimates to be similar across four age groups that spanned almost the entire life-course. Overall, an increase in the GRS by one standard deviation was associated with ∼36% increase in the risk of being in the quartile with the highest degree of subclinical coronary atherosclerosis.
Our findings were consistent in three sets of sensitivity analyses. First, we repeated all analyses after removing from the GRS 17 SNPs that are most likely influencing clinical CAD through effects on traditional risk factors8 and we ran secondary models adjusting for all traditional risk factors for CAD. We performed these sensitivity analyses to ensure that the associations observed were not being driven by traditional risk factors. Dyslipidemia, in particular, has already been unequivocally linked to the rate of development of subclinical atherosclerosis both in human and animal studies34-37. We found that the strength of the associations overall and within each age stratum persists even after full adjustment. The reason for this persistence is unclear but is consistent with previous studies testing the same (or very similar) GRS for association with clinical endpoints2, 3, 38. One possibility is that risk-factor SNPs retain the ability to predict CAD outcomes even after adjusting for a single measure of the risk factors due to the phenomenon of regression dilution39.
Our second sensitivity analysis explored the effects of weighting the GRS. We found that weighting increased the overall effect size and the statistical significance of the association between our GRS and subclinical CAD. On the other hand, weighting led to a minimal increase in the heterogeneity for the 32 SNP GRS manifested by a lower but still non-significant p value for the test of heterogeneity.
Our third sensitivity analysis was focused on SEA. This study was unique not only because of the method of assessment of subclinical atherosclerosis but also because of the genotyping platform used, which consisted of an early Perlegen GWAS array that included only ∼106,000 SNPs. Only ∼2/3 of the SNPs genotyped using this platform passed our standard pre-imputation quality control. Consequently, the mean imputation quality for SEA was significantly lower than all other studies. In the 4 models we tested, we invariably found the highest point estimates and the lowest p values for the analyses that restricted the GRS to the subset of SNPs with an imputation r2 > 0.3 although these differences were not large when compared to the models that used all 49 SNPs. Imposing an even higher imputation score threshold led to a further substantial restriction of SNPs as well as a degradation of the association signal. The relatively large difference in the OR for the two GRS models restricted to the small number SNPs with high imputation quality (r2 > 0.8) is likely a consequence of the removal of rs6544713, a SNP associated with LDL that coincidentally also has one the best combinations of imputation quality, magnitude of effect, and strength of association in the SEA study. Collectively, these circumstances and observations suggest that the OR for the GRS in SEA may represent a substantial underestimate of the true OR due to extensive misclassification of the genotype in both cases and controls. Additional genotyping of the PDAY cohort could provide evidence in support or against this possibility.
Our study had three additional limitations worthy of mention. First, we were unable to anatomically match the assessment of subclinical coronary atherosclerosis across all studies since the SEA study was restricted to the RCA and the other studies assessed the degree of subclinical atherosclerosis in all three coronary arteries combined. However, we provide evidence of a high correlation of subclinical disease between arteries assessed directly or through CAC scanning. Additional evidence of a semi-quantitative nature for a high correlation between the presence of raised lesions in the RCA and the left coronary artery is provided by the World Health Organization study in five European towns40. Second, we had more limited power to detect associations in the extreme age strata where overall number of subjects available for study was lower. Nevertheless, we observed nominally significant associations in these age strata in our main analysis and most of our sensitivity analyses. Third, the identification of the quartile of subjects with the highest degree of subclinical atherosclerosis in the age stratum of 35 to 54 age strata was hampered by a low overall prevalence of subjects with any CAC. Thus, the percent of subjects with CAC > 0 was less than 25 and the size of the case group ranged from 12.7% to 20.3%. The ORs of association in these strata may be biased towards the null because the control group includes some subjects with more advanced but non-calcified plaque. A possible underestimate of the OR in this age range combined with a possible underestimate of the OR in SEA may be one reason we observe a fairly homogeneous association across age groups. Conversely, the sampling of “extremes” in PDAY by SEA investigators may have biased the OR upwards but we suspect that such a selection bias is likely small in comparison to that related to poor imputation.
Our findings have several implications. First, they are consistent with the hypothesis that susceptibility loci for CAD discovered to date through GWAS predispose an individual to clinical complications of CAD from birth primarily through the modulation of the rate of formation of coronary plaque. This predisposition becomes apparent early in life and continues throughout one's life-course with evidence of predisposition persistent into the ninth decade of life. However, the cross sectional nature of our analyses combined with the possible biased estimates of effect in our youngest age groups does not allow us to conclude with certainty whether this predisposition is causally-operative at all ages. For example, it is possible that the GRS predisposes only to very early lesions and then has no further impact over the life-course. Second, our observations raise the possibility that the genetic risk associated with GWAS loci for clinical CAD may not involve a specific predisposition to intra-plaque rupture, intraluminal plaque rupture, or thrombosis given it appears at a very young age when plaques are generally too small to be prone to these structural complications41, 42. This hypothesis is best supported by the associations we observed in SEA, which were largely driven by the presence of early-stage, minimally raised, and uncomplicated atherosclerotic lesions involving the RCA. We acknowledge that it is difficult to prove this hypothesis based solely on our observations given we did not directly examine these plaque phenotypes. Furthermore, we cannot rule out the possibility of atherosclerosis progression through either plaque fissuring with thrombus incorporation and/or intra-lesional hemorrhage within the early stage lesions observed in PDAY. However, multiple prior autopsy studies suggest that such events are extremely rare among the Stary Type IV and V lesions observed in the PDAY/SEA study12-15, 41, 42. Lastly, our findings bolster prior observations from several epidemiological studies demonstrating CAC to be a strong independent predictor of incident clinical CAD43.
We note two reasons contemporary GWA studies of clinical CAD may be at a disadvantage in identifying loci that specifically predispose to plaque rupture and/or thrombosis First, such studies are hampered by the possibility that a sizable fraction of all controls are actually not at risk of rupture and thrombosis because they possess a very low burden of atherosclerosis as suggested by a CAC score of 0 (Table 1)44-46. Second, the rate of misclassification of controls may be high even in studies where the burden of atherosclerosis is better matched between cases and controls (e.g. comparing control subjects with CAD and no MI to case subjects with CAD and MI) because many controls may have still experienced subclinical plaque ruptures and/or thrombosis47-49.
In conclusion, we have shown that risk alleles for clinical CAD are collectively associated with subclinical atherosclerosis throughout the life course. This association is not driven by alleles that are associated with traditional risk factors and it is apparent even at the earliest, uncomplicated stages of atherosclerosis. We found the magnitude of this association to be homogenous across age groups although we may have substantially underestimated it in the younger age groups due to technical limitations. Our observations suggest that susceptibility loci for CAD discovered to date predispose to clinical complications of CAD predominantly by promoting the formation of coronary plaque. However, additional population genetic and mechanistic studies are warranted to further test this hypothesis.
Supplementary Material
Acknowledgments
Funding Sources: The ADVANCE study was supported by a grant from the Reynold's Foundation and the National Heart Lung Blood Institute grant HL087647. TLA was supported by an NIH career development award K23DK088942.
Footnotes
Conflict of Interest Disclosures: None
References
- 1.CARDIoGRAMplusC4D C. Deloukas P, Kanoni S, Willenborg C, Farrall M, Assimes TL, et al. Large-scale association analysis identifies new risk loci for coronary artery disease. Nat Genet. 2013;45:25–33. doi: 10.1038/ng.2480. [DOI] [PMC free article] [PubMed] [Google Scholar]
- 2.Ganna A, Magnusson PK, Pedersen NL, de Faire U, Reilly M, Arnlov J, et al. Multilocus Genetic Risk Scores for Coronary Heart Disease Prediction. Arterioscler Thromb Vasc Biol. 2013;33:2267–2272. doi: 10.1161/ATVBAHA.113.301218. [DOI] [PubMed] [Google Scholar]
- 3.Goldstein BA, Knowles JW, Salfati E, Ioannidis JP, Assimes TL. Simple, standardized incorporation of genetic risk into non-genetic risk prediction tools for complex traits: coronary heart disease as an example. Front Genet. 2014;5:254. doi: 10.3389/fgene.2014.00254. [DOI] [PMC free article] [PubMed] [Google Scholar]
- 4.Ripatti S, Tikkanen E, Orho-Melander M, Havulinna AS, Silander K, Sharma A, et al. A multilocus genetic risk score for coronary heart disease: case-control and prospective cohort analyses. Lancet. 2010;376:1393–1400. doi: 10.1016/S0140-6736(10)61267-6. [DOI] [PMC free article] [PubMed] [Google Scholar]
- 5.Morrison AC, Bare LA, Chambless LE, Ellis SG, Malloy M, Kane JP, et al. Prediction of coronary heart disease risk using a genetic risk score: the Atherosclerosis Risk in Communities Study. Am J Epidemiol. 2007;166:28–35. doi: 10.1093/aje/kwm060. [DOI] [PubMed] [Google Scholar]
- 6.Burgess S, Thompson SG. Use of allele scores as instrumental variables for Mendelian randomization. Int J Epidemiol. 2013;42:1134–1144. doi: 10.1093/ije/dyt093. [DOI] [PMC free article] [PubMed] [Google Scholar]
- 7.Burgess S, Butterworth A, Thompson SG. Mendelian randomization analysis with multiple genetic variants using summarized data. Genet Epidemiol. 2013;37:658–665. doi: 10.1002/gepi.21758. [DOI] [PMC free article] [PubMed] [Google Scholar]
- 8.Consortium CAD. Deloukas P, Kanoni S, Willenborg C, Farrall M, Assimes TL, et al. Large-scale association analysis identifies new risk loci for coronary artery disease. Nat Genet. 2013;45:25–33. doi: 10.1038/ng.2480. [DOI] [PMC free article] [PubMed] [Google Scholar]
- 9.Chen Z, Karaplis AC, Ackerman SL, Pogribny IP, Melnyk S, Lussier-Cacan S, et al. Mice deficient in methylenetetrahydrofolate reductase exhibit hyperhomocysteinemia and decreased methylation capacity, with neuropathology and aortic lipid deposition. Hum Mol Genet. 2001;10:433–443. doi: 10.1093/hmg/10.5.433. [DOI] [PubMed] [Google Scholar]
- 10.Sangiorgi G, Rumberger JA, Severson A, Edwards WD, Gregoire J, Fitzpatrick LA, et al. Arterial calcification and not lumen stenosis is highly correlated with atherosclerotic plaque burden in humans: a histologic study of 723 coronary artery segments using nondecalcifying methodology. J Am Coll Cardiol. 1998;31:126–133. doi: 10.1016/s0735-1097(97)00443-9. [DOI] [PubMed] [Google Scholar]
- 11.McClelland RL, Chung H, Detrano R, Post W, Kronmal RA. Distribution of coronary artery calcium by race, gender, and age: results from the Multi-Ethnic Study of Atherosclerosis (MESA) Circulation. 2006;113:30–37. doi: 10.1161/CIRCULATIONAHA.105.580696. [DOI] [PubMed] [Google Scholar]
- 12.General findings of the International Atherosclerosis Project. Lab Invest. 1968;18:498–502. [PubMed] [Google Scholar]
- 13.McGill HC., Jr Introduction to the geographic pathology of atherosclerosis. Lab Invest. 1968;18:465–467. [PubMed] [Google Scholar]
- 14.Tejada C, Strong JP, Montenegro MR, Restrepo C, Solberg LA. Distribution of coronary and aortic atherosclerosis by geographic location, race, and sex. Lab Invest. 1968;18:509–526. [PubMed] [Google Scholar]
- 15.Eggen DA, Solberg LA. Variation of atherosclerosis with age. Lab Invest. 1968;18:571–579. [PubMed] [Google Scholar]
- 16.Assimes TL, Knowles JW, Basu A, Iribarren C, Southwick A, Tang H, et al. Susceptibility locus for clinical and subclinical coronary artery disease at chromosome 9p21 in the multi-ethnic ADVANCE study. Hum Mol Genet. 2008;17:2320–2328. doi: 10.1093/hmg/ddn132. [DOI] [PMC free article] [PubMed] [Google Scholar]
- 17.Tryka KA, Hao L, Sturcke A, Jin Y, Wang ZY, Ziyabari L, et al. NCBI's Database of Genotypes and Phenotypes: dbGaP. Nucleic Acids Res. 2014;42:D975–979. doi: 10.1093/nar/gkt1211. [DOI] [PMC free article] [PubMed] [Google Scholar]
- 18.Strong JP, Malcom GT, McMahan CA, Tracy RE, Newman WP, 3rd, Herderick EE, et al. Prevalence and extent of atherosclerosis in adolescents and young adults: implications for prevention from the Pathobiological Determinants of Atherosclerosis in Youth Study. JAMA. 1999;281:727–735. doi: 10.1001/jama.281.8.727. [DOI] [PubMed] [Google Scholar]
- 19.Hughes GH, Cutter G, Donahue R, Friedman GD, Hulley S, Hunkeler E, et al. Recruitment in the Coronary Artery Disease Risk Development in Young Adults (Cardia) Study. Control Clin Trials. 1987;8:68S–73S. doi: 10.1016/0197-2456(87)90008-0. [DOI] [PubMed] [Google Scholar]
- 20.Bild DE, Bluemke DA, Burke GL, Detrano R, Diez Roux AV, Folsom AR, et al. Multi-ethnic study of atherosclerosis: objectives and design. Am J Epidemiol. 2002;156:871–881. doi: 10.1093/aje/kwf113. [DOI] [PubMed] [Google Scholar]
- 21.Dawber TR, Meadors GF, Moore FE., Jr Epidemiological approaches to heart disease: the Framingham Study. Am J Public Health Nations Health. 1951;41:279–281. doi: 10.2105/ajph.41.3.279. [DOI] [PMC free article] [PubMed] [Google Scholar]
- 22.Tell GS, Fried LP, Hermanson B, Manolio TA, Newman AB, Borhani NO. Recruitment of adults 65 years and older as participants in the Cardiovascular Health Study. Ann Epidemiol. 1993;3:358–366. doi: 10.1016/1047-2797(93)90062-9. [DOI] [PubMed] [Google Scholar]
- 23.Chuang ML, Massaro JM, Levitzky YS, Fox CS, Manders ES, Hoffmann U, et al. Prevalence and distribution of abdominal aortic calcium by gender and age group in a community-based cohort (from the Framingham Heart Study) Am J Cardiol. 2012;110:891–896. doi: 10.1016/j.amjcard.2012.05.020. [DOI] [PMC free article] [PubMed] [Google Scholar]
- 24.Fair JM, Kiazand A, Varady A, Mahbouba M, Norton L, Rubin GD, et al. Ethnic differences in coronary artery calcium in a healthy cohort aged 60 to 69 years. Am J Cardiol. 2007;100:981–985. doi: 10.1016/j.amjcard.2007.04.038. [DOI] [PubMed] [Google Scholar]
- 25.Hoffmann U, Massaro JM, Fox CS, Manders E, O'Donnell CJ. Defining normal distributions of coronary artery calcium in women and men (from the Framingham Heart Study) Am J Cardiol. 2008;102:1136–1141. 1141 e1131. doi: 10.1016/j.amjcard.2008.06.038. [DOI] [PMC free article] [PubMed] [Google Scholar]
- 26.Kannel WB, Feinleib M, McNamara PM, Garrison RJ, Castelli WP. An investigation of coronary heart disease in families. The Framingham offspring study. Am J Epidemiol. 1979;110:281–290. doi: 10.1093/oxfordjournals.aje.a112813. [DOI] [PubMed] [Google Scholar]
- 27.Kronmal RA, McClelland RL, Detrano R, Shea S, Lima JA, Cushman M, et al. Risk factors for the progression of coronary artery calcification in asymptomatic subjects: results from the Multi-Ethnic Study of Atherosclerosis (MESA) Circulation. 2007;115:2722–2730. doi: 10.1161/CIRCULATIONAHA.106.674143. [DOI] [PubMed] [Google Scholar]
- 28.Newman AB, Naydeck B, Sutton-Tyrrell K, Edmundowicz D, Gottdiener J, Kuller LH. Coronary artery calcification in older adults with minimal clinical or subclinical cardiovascular disease. J Am Geriatr Soc. 2000;48:256–263. doi: 10.1111/j.1532-5415.2000.tb02643.x. [DOI] [PubMed] [Google Scholar]
- 29.Li Y, Willer CJ, Ding J, Scheet P, Abecasis GR. MaCH: using sequence and genotype data to estimate haplotypes and unobserved genotypes. Genet Epidemiol. 2010;34:816–834. doi: 10.1002/gepi.20533. [DOI] [PMC free article] [PubMed] [Google Scholar]
- 30.Howie B, Fuchsberger C, Stephens M, Marchini J, Abecasis GR. Fast and accurate genotype imputation in genome-wide association studies through pre-phasing. Nat Genet. 2012;44:955–959. doi: 10.1038/ng.2354. [DOI] [PMC free article] [PubMed] [Google Scholar]
- 31.Purcell S, Neale B, Todd-Brown K, Thomas L, Ferreira MA, Bender D, et al. PLINK: a tool set for whole-genome association and population-based linkage analyses. Am J Hum Genet. 2007;81:559–575. doi: 10.1086/519795. [DOI] [PMC free article] [PubMed] [Google Scholar]
- 32.Higgins JP, Thompson SG, Deeks JJ, Altman DG. Measuring inconsistency in meta-analyses. BMJ. 2003;327:557–560. doi: 10.1136/bmj.327.7414.557. [DOI] [PMC free article] [PubMed] [Google Scholar]
- 33.Montenegro MR, Eggen DA. Topography of atherosclerosis in the coronary arteries. Lab Invest. 1968;18:586–593. [PubMed] [Google Scholar]
- 34.Report of the National Cholesterol Education Program Expert Panel on Detection, Evaluation, and Treatment of High Blood Cholesterol in Adults. The Expert Panel. Arch Intern Med. 1988;148:36–69. [PubMed] [Google Scholar]
- 35.Grundtman C. In: Inflammation and Atherosclerosis. Georg Wick CG, editor. Wien: Springer-Verlag; 2012. [Google Scholar]
- 36.Romm PA, Green CE, Reagan K, Rackley CE. Relation of serum lipoprotein cholesterol levels to presence and severity of angiographic coronary artery disease. Am J Cardiol. 1991;67:479–483. doi: 10.1016/0002-9149(91)90007-8. [DOI] [PubMed] [Google Scholar]
- 37.Steinberg D, Witztum JL. Oxidized low-density lipoprotein and atherosclerosis. Arterioscler Thromb Vasc Biol. 2010;30:2311–2316. doi: 10.1161/ATVBAHA.108.179697. [DOI] [PubMed] [Google Scholar]
- 38.Tikkanen E, Havulinna AS, Palotie A, Salomaa V, Ripatti S. Genetic risk prediction and a 2-stage risk screening strategy for coronary heart disease. Arterioscler Thromb Vasc Biol. 2013;33:2261–2266. doi: 10.1161/ATVBAHA.112.301120. [DOI] [PMC free article] [PubMed] [Google Scholar]
- 39.Lieb W, Jansen H, Loley C, Pencina MJ, Nelson CP, Newton-Cheh C, et al. Genetic predisposition to higher blood pressure increases coronary artery disease risk. Hypertension. 2013;61:995–1001. doi: 10.1161/HYPERTENSIONAHA.111.00275. [DOI] [PMC free article] [PubMed] [Google Scholar]
- 40.Vanecek R. Atherosclerosis of the coronary arteries in five towns. Bull World Health Organ. 1976;53:509–518. [PMC free article] [PubMed] [Google Scholar]
- 41.Stary HC, Chandler AB, Glagov S, Guyton JR, Insull W, Jr, Rosenfeld ME, et al. A definition of initial, fatty streak, and intermediate lesions of atherosclerosis. A report from the Committee on Vascular Lesions of the Council on Arteriosclerosis, American Heart Association. Circulation. 1994;89:2462–2478. doi: 10.1161/01.cir.89.5.2462. [DOI] [PubMed] [Google Scholar]
- 42.Stary HC, Chandler AB, Dinsmore RE, Fuster V, Glagov S, Insull W, Jr, et al. A definition of advanced types of atherosclerotic lesions and a histological classification of atherosclerosis. A report from the Committee on Vascular Lesions of the Council on Arteriosclerosis, American Heart Association. Circulation. 1995;92:1355–1374. doi: 10.1161/01.cir.92.5.1355. [DOI] [PubMed] [Google Scholar]
- 43.Sunkara N, Wong ND, Malik S. Role of coronary artery calcium in cardiovascular risk assessment. Expert Rev Cardiovasc Ther. 2014;12:87–94. doi: 10.1586/14779072.2014.868305. [DOI] [PubMed] [Google Scholar]
- 44.Wacholder S, McLaughlin JK, Silverman DT, Mandel JS. Selection of controls in case-control studies. I. Principles. Am J Epidemiol. 1992;135:1019–1028. doi: 10.1093/oxfordjournals.aje.a116396. [DOI] [PubMed] [Google Scholar]
- 45.Sarwar A, Shaw LJ, Shapiro MD, Blankstein R, Hoffmann U, Cury RC, et al. Diagnostic and prognostic value of absence of coronary artery calcification. JACC Cardiovasc Imaging. 2009;2:675–688. doi: 10.1016/j.jcmg.2008.12.031. [DOI] [PubMed] [Google Scholar]
- 46.de Carvalho MS, de Araujo Goncalves P, Garcia-Garcia HM, de Sousa PJ, Dores H, Ferreira A, et al. Prevalence and predictors of coronary artery disease in patients with a calcium score of zero. Int J Cardiovasc Imaging. 2013;29:1839–1846. doi: 10.1007/s10554-013-0267-x. [DOI] [PubMed] [Google Scholar]
- 47.Reilly MP, Li M, He J, Ferguson JF, Stylianou IM, Mehta NN, et al. Identification of ADAMTS7 as a novel locus for coronary atherosclerosis and association of ABO with myocardial infarction in the presence of coronary atherosclerosis: two genome-wide association studies. Lancet. 2011;377:383–392. doi: 10.1016/S0140-6736(10)61996-4. [DOI] [PMC free article] [PubMed] [Google Scholar]
- 48.Burke AP, Kolodgie FD, Farb A, Weber DK, Malcom GT, Smialek J, et al. Healed plaque ruptures and sudden coronary death: evidence that subclinical rupture has a role in plaque progression. Circulation. 2001;103:934–940. doi: 10.1161/01.cir.103.7.934. [DOI] [PubMed] [Google Scholar]
- 49.Hong MK, Mintz GS, Lee CW, Park KM, Lee BK, Kim YH, et al. Plaque ruptures in stable angina pectoris compared with acute coronary syndrome. Int J Cardiol. 2007;114:78–82. doi: 10.1016/j.ijcard.2006.01.008. [DOI] [PubMed] [Google Scholar]
Associated Data
This section collects any data citations, data availability statements, or supplementary materials included in this article.