Abstract
This paper contains new, representative reference equations for the thermal conductivity of carbon dioxide. The equations are based in part upon a body of experimental data that has been critically assessed for internal consistency and for agreement with theory whenever possible. In the case of the dilute-gas thermal conductivity, we incorporated recent theoretical calculations to extend the temperature range of the experimental data. Moreover, in the critical region, the experimentally observed enhancement of the thermal conductivity is well represented by theoretically based equations containing just one adjustable parameter. The correlations are applicable for the temperature range from the triple point to 1100 K and pressures up to 200 MPa. The overall uncertainty (at the 95% confidence level) of the proposed correlation varies depending on the state point from a low of 1% at very low pressures below 0.1 MPa between 300 K and 700 K, to 5% at the higher pressures of the range of validity.
Keywords: carbon dioxide, critical phenomena, thermal conductivity, transport properties
1. Introduction
Carbon dioxide is a widely used industrial fluid with many applications including as a solvent for supercritical extraction1, as a refrigerant2, to aid in enhanced oil recovery3 and most recently as a potential working fluid in supercritical Brayton cycles that may be used in solar, geothermal, or other power cycle applications4. It is therefore important to have available accurate formulations for the thermodynamic and transport properties of this fluid.
In 1990, Vesovic et al.5 published a reference correlation for the thermal conductivity surface of carbon dioxide valid over the temperature range from 200 K to 1000 K and up to 100 MPa. In 2006, Scalabrin et al.6 developed a new correlation that extended the upper pressure limit to 200 MPa. The uncertainty of both of these formulations, however, is limited due to the data available at the time. Recently, new measurements have been made7 that will allow improvements in the uncertainty of a CO2 thermal conductivity correlation, especially in the liquid phase. In addition, there have been recent improvements in the potential energy surface that provide values for the thermal conductivity in the dilute-gas limit8 that can be used to guide the behavior of the dilute gas, especially at low and high temperatures where quality data are scarce or unavailable. The present work aims to incorporate both new data and theory to provide an improved wide-ranging correlation for the thermal conductivity of carbon dioxide that is valid over gas, liquid, and supercritical states.
In a series of recent papers, reference correlations for the thermal conductivity of normal and parahydrogen,9 SF6,10 toluene,11 benzene,12 xylenes and ethylbenzene,13 n-hexane,14 n-heptane,15 methanol,16 ethanol,17 and water,18 as well as a series of reference correlations for the viscosity of fluids,19–22 covering a wide range of conditions of temperature and pressure, were reported. In this paper, the work is extended to the thermal conductivity of carbon dioxide.
2. Methodology
The thermal conductivity λ is expressed as the sum of three independent contributions, as
| (1) |
where ρ is the density, T is the temperature, and the first term, λο(T) = λ(0,T), is the contribution to the thermal conductivity in the dilute-gas limit, where only two-body molecular interactions occur. The final term, Δλc(ρ,T), the critical enhancement, arises from the long-range density fluctuations that occur in a fluid near its critical point, which contribute to divergence of the thermal conductivity at the critical point. Finally, the term Δλ(ρ,T), the residual property, represents the contribution of all other effects to the thermal conductivity of the fluid at elevated densities including many-body collisions, molecular-velocity correlations, and collisional transfer.
The identification of these three separate contributions to the thermal conductivity and to transport properties in general is useful because it is possible, to some extent, to treat both λο(T) and Δλc(ρ,T) theoretically. In addition, it is possible to derive information about λο(T) from experiment. In contrast, there is almost no theoretical guidance concerning the residual contribution, Δλ(ρ,T), so that its evaluation is based entirely on experimentally obtained data.
The analysis described above should be applied to the best available experimental data for the thermal conductivity. Thus, a prerequisite to the analysis is a critical assessment of the experimental data. For this purpose, two categories of experimental data are defined: primary data employed in the development of the correlation, and secondary data used simply for comparison purposes. According to the recommendation adopted by the Subcommittee on Transport Properties (now known as The International Association for Transport Properties) of the International Union of Pure and Applied Chemistry, the primary data are identified by a well-established set of criteria.23 These criteria have been successfully employed to establish standard reference values for the viscosity and thermal conductivity of fluids over wide ranges of conditions, with uncertainties in the range of 1%. However, in many cases, such a narrow definition unacceptably limits the range of the data representation. Consequently, within the primary data set, it is also necessary to include results that extend over a wide range of conditions, albeit with a poorer accuracy, provided they are consistent with other more accurate data or with theory. In all cases, the accuracy claimed for the final recommended data must reflect the estimated uncertainty in the primary information.
3. The Correlation
Table 1 summarizes, to the best of our knowledge, the experimental measurements7,24–112 of the thermal conductivity of carbon dioxide reported in the literature. Eighty nine sets are included in the table. From these sets, 21 were considered as primary data. We started with the same data sets that were considered as primary in the work of Vesovic et al.5 in Tables 2 and 7 of that work. This includes the work of Millat et al.,25 Johns et al.,26 Clifford et al.,29 Scott et al.,28 Bakulin et al.,33 Keyes,41 Lenoir and Comings,42 Johnston and Grilly,43 Dickins,44 Snel et al.,30 and LeNeindre et al.35–38 Initially we considered the single point of Franck89 at 197 K that was considered primary in Vesovic et al.5, but it was later not used as discussed in the dilute-gas section. For Millat et al.,25 following Vesovic et al.5, we also did not select any data from the 425 K isotherm. We included all points of Johns et al.26 (except for one at a nominal temperature of 430 K and 20.4 MPa which is anomalously lower than others at that isotherm). All points from Clifford et al.,29 Dickins,44 Johnston and Grilly,43 and Snel et al.30 were included in the primary set. Following Vesovic, we also excluded the 316 K isotherm from Scott et al.28 from the primary set. Initially all points in Keyes41 were included in the primary set but two points at the highest pressures at 273 K were later excluded. In addition, we added to the primary set the data from Keyes40 as they extended down to 207 K. From Lenoir and Comings,42 we included only the points at atmospheric pressure as the density dependence of the other data in this set were inconsistent with other data. All points from the data of Bakulin et al.,33 made with a steady-state hot-wire apparatus, were included in the primary set. In addition, we added another set of Bakulin’s measurements32 to the primary set, but excluded data above 1000 K, as we rely on the theoretical calculations of Hellmann8 in this region as will be discussed below. We also included the data of LeNeindre et al.35–38 in the primary data set. All data from LeNeindre’s work were included, including the highest temperature data extending to 951 K, with the exception of several points that appeared to have typographical errors or that were clearly inconsistent with other data. This included one point from the Ref.(37) at 298 K, 30 MPa, and 3 points at 366 K and 70.3 MPa, at 372.45 K and 41.6 MPa, and 529 K, 35.2 MPa, from Ref. (35).
TABLE 1.
Thermal conductivity measurements of carbon dioxide
| 1st author | Year Publ. | Technique employeda | Purity (%) | Uncertainty (%) | No. of data | Temperature range (K) | Pressure range (MPa) |
|---|---|---|---|---|---|---|---|
| Primary data | |||||||
| Perkins7,b | 2016 | THW,SSHW | 99.994 | 0.5–3 | 4824 | 218–757 | 0.1–68.7 |
| Li24 | 1994 | THW | 99.999 | 1.6 | 14 | 324 | 0.19–2.1 |
| Millat25,b | 1987 | THW | 99.995 | 1 | 91 | 305–425 | 0.68–6.7 |
| Johns26 | 1986 | THW | 99.995 | 1 | 46 | 380–474 | 1.83–30.6 |
| Imaishi27 | 1984 | THW | 99.9 | 0.5 | 23 | 300–301 | 0.62–3.9 |
| Scott28,b | 1983 | THW | 99.995 | 1 | 92 | 301–349 | 0.3–24.6 |
| Clifford29 | 1979 | THW | 99.999 | 0.5 | 22 | 301–304 | 0.6–5.9 |
| Snel30 | 1979 | HW | 99.99 | 1 | 133 | 298–323 | 0.004–5.5 |
| Tarzimanov31,b | 1978 | SSHW,CC | 99.9 | 3 | 94 | 292–678 | 0.1–196 |
| Bakulin32,b | 1976 | HF | na | 5 | 10 | 400–1300 | 0.015 |
| Bakulin33 | 1975 | HF | na | 5 | 28 | 225–316 | 0.1–2 |
| Haarman34 | 1973 | THW | na | 1 | 8 | 328–468 | 0.1 |
| Le Neindre35, 36 | 1973 | CC | na | 2–5 | 536 | 293–961 | 0.1–128 |
| LeNeindre37,b | 1972 | CC | na | 2–5 | 194 | 298–951 | 0.1–120 |
| Le Neindre38,b | 1968 | CC | na | 2–5 | 31 | 294–309 | 0.1–104 |
| Michels39,b | 1962 | PP | na | 2 | 253 | 298–322 | 0.1–18 |
| Keyes40 | 1955 | CC | na | 5 | 2 | 207–273 | 0.1 |
| Keyes41 | 1951 | CC | na | 5 | 9 | 273–423 | 0.1–6 |
| Lenoir42,b | 1951 | CC | 99.5 | 2 | 32 | 314–340 | 0.1–20.7 |
| Johnston43,b | 1946 | HW | 99.999 | 1–5 | 14 | 186–379 | 0.001 |
| Dickins44 | 1934 | HW | na | 1 | 6 | 285 | 0.0001–0.001 |
|
| |||||||
| Secondary data | |||||||
| Tomida45 | 2010 | THW | na | 3 | 19 | 273–294 | 4–15 |
| Patek46 | 2005 | THW | 99.98 | 1.2 | 77 | 298–428 | 0.5–15 |
| Heinemann47 | 2000 | THW | na | 5 | 3 | 323–420 | 0.1 |
| Chen48 | 1999 | TM | na | 2 | 66 | 304–316 | 1.5–13 |
| Dohrn49 | 1999 | THW | na | 5 | 7 | 300–420 | 0.1 |
| Zheng50 | 1984 | CC | 99.5 | 3 | 13 | 298 | 0.10–5.4 |
| Yorizane51 | 1983 | CC | 99.0 | 3 | 15 | 303–323 | 0.1–4.5 |
| Becker52,c | 1978 | HolInt | 99.994 | 3–5 | 216 | 298–308 | 3–49 |
| Ulybin53 | 1977 | HW | na | 5 | 14 | 225–312 | 0.112–1.01 |
| Chen54 | 1975 | TEM | 99.995 | 5 | 34 | 350–2000 | 0.1 |
| Salmanov55 | 1973 | SSHW | 99.9 | 3 | 19 | 222–282 | 2–9 |
| Shashkov56 | 1973 | SSHW | na | 4 | 9 | 315–403 | 0.1 |
| Dijkema57 | 1972 | CC | na | na | 2 | 298–333 | 0.1 |
| Gupta58 | 1970 | HW | na | 5 | 11 | 373–1348 | 0.07 |
| Maczek59 | 1970 | SSHW | na | 3 | 1 | 323 | 0.1 |
| Murthy60 | 1970 | PP | 99.99 | 3 | 53 | 305–310 | 7.5–8.3 |
| Murthy61 | 1970 | PP | 99.99 | 3 | 3 | 305–307 | 0.1–8.2 |
| Tarzimanov62 | 1970 | SSHW | 99.9 | 3 | 52 | 299–678 | 0.1–98.1 |
| Golubev63 | 1969 | CC | na | 1.5–3 | 733 | 180–1400 | 0.1–51.0 |
| Rosenbaum64 | 1969 | CC | na | 3 | 50 | 335–434 | 3–69 |
| Barua65 | 1968 | HW | 99.5 | 1 | 5 | 283–473 | 0.1 |
| Shingarev66 | 1968 | SSHW | na | na | 23 | 231–326 | 1–19.6 |
| van Dael67 | 1968 | HW | 99.95 | 0.5 | 1 | 296 | 0.1 |
| Freud68 | 1967 | TEM | 99.9 | 10 | 42 | 298 | 0.48–56 |
| Mukhopadhyay69 | 1967 | HW | na | 1 | 7 | 258–473 | 0.1 |
| Mukhopadhyay70 | 1967 | HW | na | 2 | 5 | 273–473 | 0.1 |
| Baker71 | 1964 | HW | na | na | 1 | 478 | 0.1 |
| Senftleben72 | 1964 | na | na | 4 | 8 | 273–673 | 0.1 |
| Amirkhanov73 | 1963 | PP | 99.96 | 1 | 20 | 293–304 | 5.7–7.2 |
| Cheung74 | 1962 | CC | na | 5 | 2 | 376–593 | 0.1 |
| Guildner75 | 1962 | CC | 99.5 | 5 | 39 | 277–348 | 0.21–30 |
| Westenberg76 | 1962 | TWHW | na | 3 | 3 | 299–500 | 0.1 |
| Geier77 | 1961 | CC | na | 2 | 23 | 273–1273 | 0.1 |
| Vines78 | 1960 | CC | na | 1 | 4 | 543–1174 | 0.1 |
| Chaikin79 | 1958 | HW | na | 10 | 5 | 293–503 | 0.1 |
| Guildner80 | 1958 | CC | 99.99 | 5 | 22 | 304–348 | 0.2–30.4 |
| Waelbroeck81 | 1958 | HW | na | na | 1 | 313 | 0.1 |
| Salceanu82 | 1956 | HW | na | na | 1 | 303 | 0.05 |
| Kulakov83 | 1955 | HW | na | na | 2 | 338, 603 | 0.1 |
| Rothman84 | 1955 | CC | 99.5 | 1 | 2 | 651–842 | 0.099–0.100 |
| Filippov85 | 1954 | HW | na | 3 | 6 | 288–363 | 0.1 |
| Thomas86 | 1954 | SSHW | na | 0.04–0.2 | 4 | 313–337 | 0 |
| Davidson87 | 1953 | CC | na | 5 | 1 | 273 | 0.1 |
| Rothman88 | 1953 | CC | 99.5 | 7.5 | 25 | 631–1047 | 0.1 |
| Franck89 | 1951 | HW | na | na | 7 | 197–598 | 0.02–0.04 |
| Kannuiluik90 | 1950 | HW | na | 0.3 | 9 | 275 | 0.001–0.11 |
| Stolyarov91 | 1950 | HW | 99 | 3 | 17 | 280–475 | 0.1–30 |
| Borovik92 | 1949 | HW | na | na | 18 | 283–313 | 5.1–9.1 |
| Keyes93 | 1949 | CC | na | 5 | 8 | 223–623 | 0.1 |
| Stops94 | 1949 | HW | na | na | 1 | 273 | 0.1 |
| Timrot95 | 1949 | HW | 99.0 | 4 | 160 | 293–473 | 0.1–29 |
| Kannuiluik96 | 1947 | HW | na | 5 | 26 | 196–373 | 0.1 |
| Vargaftik97 | 1946 | HW | na | na | 13 | 325–881 | 0.1 |
| Eucken98 | 1940 | HW | na | na | 6 | 195–598 | 0.1 |
| Koch99 | 1940 | na | na | 5 | 71 | 283–313 | 0.1–9 |
| Sherratt100 | 1939 | HW | na | na | 10 | 339–565 | 0.1 |
| Archer101 | 1935 | HW | na | 0.4 | 11 | 285–591 | 0.1 |
| Kannuiluik102 | 1934 | HW | na | 2 | 1 | 273 | 0.1 |
| Kardos103 | 1934 | na | na | na | 6 | 273–308 | 5.9–8.8 |
| Sellschopp104 | 1934 | HW | na | 2.5 | 50 | 284–323 | 0.10–9.15 |
| Trautz105 | 1933 | HW | na | 1 | 19 | 273 | 0.24–1.19 |
| Kornfeld106 | 1931 | HW | na | na | 1 | 298 | 0.1 |
| Gregory107 | 1927 | HW | 99.82 | na | 6 | 278–286 | 0.1 |
| Weber 108 | 1927 | HW | na | 1 | 1 | 273 | 0.1 |
| Weber109 | 1917 | HW | na | na | 1 | 273 | 0.1 |
| Schleiermacher110 | 1888 | HW | na | na | 1 | 298 | 0.1 |
| Graetz111 | 1881 | HW | na | na | 1 | 273 | 0.1 |
| Winkelmann112 | 1880 | HW | na | na | 1 | 298 | 0.1 |
CC, coaxial cylinder; HF, hot filament; HolInt, Heated plate observed by holographic interferometry; HW, hot wire; na, not available; PP, parallel plate; SSHW, steady-state hot wire; TEM, Thermoelectric method; THW, transient hot wire; TWHW, Thermal wake following hot wire heating.
only selected points considered primary
thermal diffusivity
TABLE 2.
Primary data considered for dilute-gas analysis
| 1st author | No. of Data | Uncertainty (%) | T range (K) | Density (kg m−3) |
|---|---|---|---|---|
| Perkins7 | 1129 | 2–3 | 218–751 | 0.8–47.8 |
| Li24 | 14 | 1.6 | 324 | 3–38 |
| Millat25 | 4 | 1 | 308–426 | 0 |
| Johns26 | 3 | 1 | 380–470 | 0 |
| Imaishi27 | 1 | 0.5 | 301 | 0 |
| Scott28 | 19 | 1 | 301–349 | 5–48 |
| Clifford29 | 1 | 0.5 | 301 | 0 |
| Snel30 | 3 | 1 | 293–323 | 0 |
| Bakulin32 | 7 | 5 | 400–1000 | 0.1–0.2 |
| Bakulin33 | 28 | 5 | 225–316 | 2–49 |
| Haarman34 | 8 | 1 | 328–468 | 1.1–1.6 |
| Le Neindre35, 36 | 78 | 2–3 | 296–961 | 0.7–50 |
| Le Neindre37 | 37 | 2–3 | 298–951 | 0.6–1.8 |
| Le Neindre38 | 7 | 2–3 | 296–309 | 1.7–46 |
| Michels39 | 20 | 1 | 298–348 | 1.6–49 |
| Keyes40 | 2 | 5 | 207–273 | 2.0–2.5 |
| Keyes41 | 6 | 5 | 273–423 | 1.3–38 |
| Lenoir42 | 5 | 2 | 314–340 | 1.7–40 |
| Keyes93 | 5 | 5 | 223–473 | 23–48 |
| Johnston43 | 14 | 1–5 | 186–380 | 0.02–0.04 |
| Dickins44 | 6 | 1 | 285 | 0.03–0.2 |
TABLE 7.
Sample points for computer verification of the correlating equations.
| T (K) | ρ (kg m−3) | λ (mW m−1 K−1) |
|---|---|---|
| 250.0 | 0.0 | 12.99 |
| 250.0 | 2.0 | 13.05 |
| 250.0 | 1058.0 | 140.00 |
| 310.0 | 400.0 | 73.04a |
| 310.0 | 400.0 | 72.28b |
| 310.0 | 400.0 | 76.05c |
| 310.0 | 400.0 | 39.92d |
Computed with modified Olchowy–Sengers critical enhancement; the viscosity at this point for use in Eq. (5) was taken as η = 28.048 μPa s from Ref. 126 (see Section 3.3.1). Thermodynamic properties required for the enhancement term Eq. (5)–(8) are from Span and Wagner114
Computed with modified Olchowy–Sengers critical enhancement; the viscosity at this point for use in Eq. (5) was taken as η = 28.706 μPa s from Ref. 124. Thermodynamic properties required for the enhancement term Eq. (5)–(8) are from Span and Wagner114
Computed with empirical critical enhancement Eq. (10).
Computed without any critical enhancement term.
Although not considered as primary measurements in Vesovic’s5 analysis, we included all measurements of Haarman34 and those of Imaishi et al.27 as primary data. Haarman’s measurements34 were made in a transient hot-wire apparatus and cover 328 K to 468 K at atmospheric pressure. Imaishi et al.27 were also transient hot-wire measurements, but cover a very small temperature region around 301 K at pressures to 4 MPa. Finally, sources of primary data that focus on the critical region (Michels et al.,39) were included although in the development of the background equation points within 1 K of critical were not used. Michels et al.39 measured the thermal conductivity in the critical region with a parallel plate apparatus, and in addition to points within 1 K of critical we also excluded some points near the coexistence line (298 K, 6.4249 MPa; 298 K, 6.4208–6.4338 MPa; 303 K, 7.202–7.209 MPa), and any points that were marked with an asterisk in their tables. The thermal diffusivity data of Becker and Grigull52 were only used for analysis and validation of the critical region and were not used in the development of the background function, and will be discussed further in the critical enhancement discussion in Sec. 3.3.
Surprisingly, since Vesovic et al.5 made their correlation more than twenty years ago, in 1990, very few new measurements have been made.7, 24, 45–49 The only new measurements suitable as primary are those of Li et al.24 and the most recent work of Perkins.7 Li’s work was done with a transient hot-wire instrument with an estimated uncertainty of 1.6%, but is limited to one isotherm at 324 K; all of these points were included in the primary data set. The measurements of Perkins7 were obtained with two hot-wire instruments; a low-temperature apparatus (218 K to 340 K), and a high-temperature apparatus (300 K to 750 K) at pressures up to 70 MPa. Both steady state and transient hot wire measurements were made, with uncertainties ranging from a low of 0.5 % for the liquid, increasing to 3 % for gas below 1 MPa, for temperatures above 500 K, and in the critical region. The data set of Perkins7 is large compared to the others, and not all points from Perkins were used as primary data. We included in the primary set the data measured with double platinum hot wires, but only points measured with a single platinum wire where the temperature ranges did not overlap since the double-wire data were considered of lower uncertainty and were preferred for primary data. We also did not include transient data from Perkins7 for low-density gas at temperatures above 505 K in the primary set, since for transient hot-wire measurements, the correction for the finite outer boundary containing the gas becomes increasingly large, due to the increasing thermal diffusivity of the gas, as the pressure of the gas decreases. This correction becomes even more significant as the temperature increases and for outer boundaries less than 1 cm diameter, and is why we do not include in the primary data the low-density (< 50 kg m−3) measurements made above 505 K. Steady-state hot-wire measurements of the dilute gas require much smaller corrections and have lower uncertainty than such transient hot-wire measurements with relatively large corrections for the finite outer boundary, and all steady-state low-density measurements made with double wires were included in the primary set, and single-wire steady-state measurements above 655 K. We also excluded from primary several point in the liquid phase where the equation of state calculated densities in the wrong phase for the given experimental temperature and pressure.
Finally, to extend the range of the measurements to high pressures, we added 11 points from Tarzimanov and Arslanov31 that are in the liquid phase to the primary data, and also 15 high-temperature (>550 K) high-pressure ( >98 MPa) supercritical points. These measurements reported in Table 1 in Tarzimanov and Arslanov31 were made with a coaxial cylinder apparatus, and those in Table 2 are from a steady-state hot-wire apparatus; we have assigned an uncertainty of 3% to both sets.
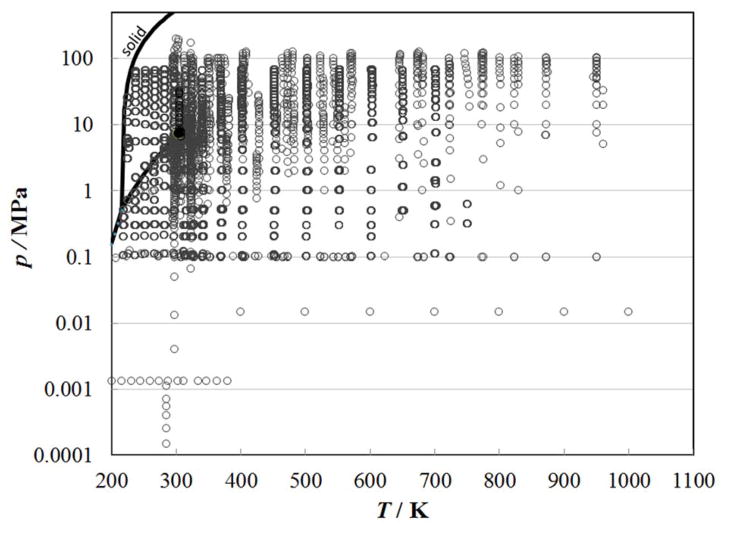
Figure 1 shows the temperature and pressure range of the primary measurements outlined in Table 1 considered for use as primary data. The critical point, solid-liquid, solid-vapor, and vapor-liquid lines are also indicated. With the inclusion of the recent data of Perkins,7 there is now good coverage of the liquid-phase region up to 70 MPa. Temperatures for all data were converted to the ITS-90 temperature scale.113 The development of the correlation requires densities; Span and Wagner114 in 1996 reviewed the thermodynamic properties of carbon dioxide and developed an accurate, wide-ranging equation of state valid for the fluid region from the triple point to 1100 K at pressures up to 800 MPa. The estimated uncertainty in density ranges from 0.03% to 0.05% in the density at pressures up to 30 MPa and temperatures to 523 K. Special interest was given to the description of the critical region, and the extrapolation behavior of the equation. We also adopt the values for the critical point and triple point from this equation of state; the critical temperature, Tc, and the critical density, ρc, were taken to be equal to 304.1282 K and 467.6 kg m−3, respectively, and the triple-point temperature is 216.592 K.114 We also adopt Span and Wagner’s correlation114 for the isobaric ideal-gas heat capacity, used in the theoretical model for the critical enhancement.
Figure 1.
Temperature and pressure ranges of the primary experimental thermal conductivity data for carbon dioxide.
3.1. The dilute-gas limit
To develop the zero-density correlation, we follow the procedure used in the development of a standard reference formulation for the thermal conductivity of water,18 which uses the concept of Key Comparison Reference Values115 to consider the uncertainties from different data sources. We first incorporated data sources25, 26, 28, 29, 33, 40, 42–44, 89 used in Table 2 of the 1990 Vesovic correlation,5 with the uncertainty estimates as given in Table 1. As mentioned above, we retained only data at densities less than 50 kg m−3. To those points, we added the zero-density point of Imaishi et al.27 obtained by analysis of an isotherm at 301 K at a range of densities in a transient hot-wire instrument, and three zero-density points presented in Snell et al.30 that resulted from their analysis of a range of densities for three isotherms obtained in a hot-wire apparatus. One additional publication by Keyes41 was included, considering only points at densities under 50 kg m−3. We also considered all points at densities below our cutoff from the work of Haarman,34 LeNeindre et al.,35, 37, 38 Li et al.,24 Michels et al.,39 and Bakulin et al. 32 In addition, for Bakulin et al.,32 we considered only points at or below 1000 K. Finally, we included all double-wire measurements from the recent work of Perkins7 that were below the cutoff density except the transient data from Perkins7 for temperatures above 505 K as discussed earlier.
All low-density, primary data points were then arranged into bins encompassing a range of 8 K or less, with at least 4 data points in each bin. The average bin size was less than 3 K. Points that were already at zero-density 25–27, 29, 30 were not put into bins and were treated as separate isotherms. It was not possible to bin all points, since some exceeded the 8 K limit or failed to have at least 4 points. For example, it was not possible to include in a bin the data point of Franck at 197 K, so this point was not included in the primary data. This resulted in a total of 1328 points from 22 sources, obtained with a variety of experimental techniques and with a range of uncertainties.
The nominal temperature of an isotherm “bin” was computed as the average temperature of all points in a bin. The thermal conductivity of each point was then corrected to the nominal temperature, Tnom, by use of the following equation:
| (2) |
where the calculated values were obtained from the Vesovic et al.5 thermal conductivity formulation.
Weighted linear regression was then used to extrapolate the nominal isotherms in order to obtain the value at zero density, λ0. The difference between the zero-density thermal conductivity and the value at a density of 50 kg m−3 is small enough so that a linear expression can be used to extrapolate to zero density, but needs to be taken into account; for example, at 500 K the difference is about 5 %. Points were weighted with a factor equal to the inverse of the square of the estimated relative uncertainty. Confidence intervals of 95% were constructed from the regression statistics. Isotherms with large inconsistencies in the underlying data were rejected from further consideration. The resulting set of zero-density isotherms contained 47 points from 219 K to 751 K.
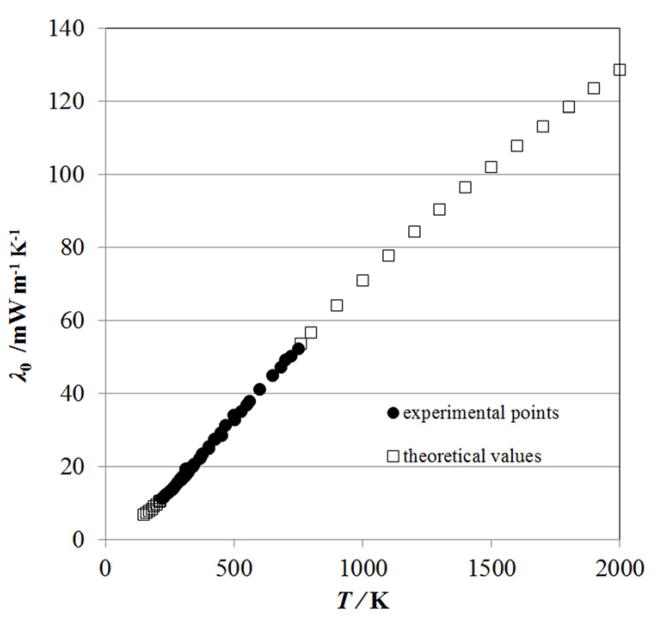
In order to supplement the experimental data set at very low and at high temperatures where data are unavailable or sparse, we incorporated selected theoretical data points from the recent work of Hellmann et al.8 The theoretical calculations were made with a new four-dimensional rigid-rotor potential energy surface, and the classical-trajectory method. We first adjusted the theoretical values by increasing their magnitude by a factor of 1.011 and ascribed to the theoretical values an uncertainty as recommended by Hellmann,8 namely 1% for points between 300 K and 700 K, increasing to 2% at 150 K and 2000 K. The adjustment of 1.011 was recommended by Hellmann based on comparisons with the best available experimental data and accounts for uncertainties in the intermolecular potential. We included 8 points from 150 K to 215 K, and 14 points from 760 K to 2000 K, so that the final set of zero-density values range from 150 K to 2000 K.
The zero-density values were fit using the orthogonal distance regression package ODRPACK116 to the same form of equation used in the water formulation18 for the dimensionless thermal conductivity in the limit of zero density,
| (3) |
where Tr= T/Tc is a reduced temperature, and λo is in mW m−1 K−1. We used the critical temperature from the Span and Wagner equation of state,114 Tc=304.1282 K.
The final set of λo values contained 69 data points from 150 K to 2000 K and is shown in Fig. 2. The coefficients obtained from the regression are given in Table 3; we found a total of four terms were necessary. The initial weights were equal to the inverse of the square of the estimated uncertainty.
Figure 2.
Dataset for λo used in the regression.
Table 3.
Coefficients in Eq. (3) for λo
| k | Lk |
|---|---|
| 0 | 1.518 743 07×10−2 |
| 1 | 2.806 740 40×10−2 |
| 2 | 2.285 641 90×10−2 |
| 3 | −7.416 242 10×10−3 |
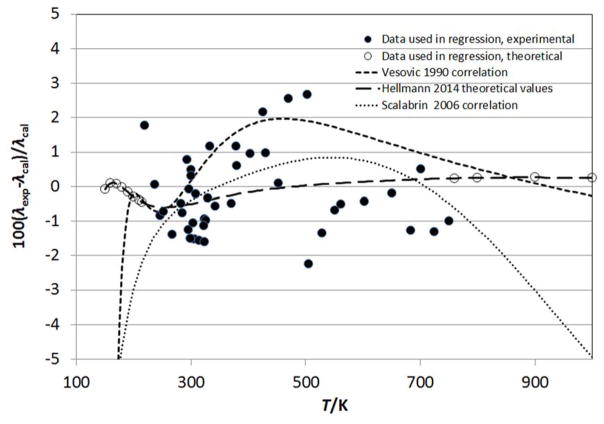
Figure 3 displays the percent deviation (100·(λo,exp–λo,cal)/λo,cal) between the λo data and Eq.(3). Also shown are deviations with respect to the correlations of Vesovic et al.5 and Scalabrin et al.,6 and also with the theoretical calculations of Hellmann.8 The values of Hellmann8 have been scaled upward by a factor of 1.011 as mentioned earlier. The correlations of Vesovic et al.5 and Scalabrin et al.6 were valid only over the range 200 K to 1000 K, and it is obvious that at low temperatures both do not extrapolate well. At high temperatures, the Vesovic et al.5 correlation extrapolates much better than Scalabrin et al.6 since Vesovic included theoretical considerations in the high-temperature behavior. The present work uses the theoretical calculations of Hellmann8 to guide both the low (150 < T /K < 215) and high temperature (760 < T /K< 2000) behavior of the correlation, outside of the range of the best experimental data. Equation (3) may be extrapolated safely to 2000 K, the limit of the theoretical data included in the fit, although it does not take into account partial dissociation of CO2 at high temperatures.117 The correlation of Vesovic et al.5 relied heavily on the works Millat et al.25 and Johns et al.26 particularly in the region 330 K to 470 K, while this work considered additional data (primarily Perkins7) that tended to be lower than of Millat et al.25 and Johns et al.26 and that are in closer agreement with Hellmann.8 Since there is considerable scatter in the experimental points, with many of the underlying data not in agreement within their stated uncertainties, we consider the comparisons with the scaled theoretical values of Hellmann8 to assess the uncertainty of the dilute-gas correlation. The theoretical values have an estimated uncertainty of 1 % between 300 K and 700 K, increasing to 2 % at both 150 K and 2000 K, and we adopt those values for our uncertainty estimate for Eq. (3).
Figure 3.
Comparison of λo correlations with the theoretical and experimental data.
3.2. The residual thermal conductivity
The thermal conductivities of pure fluids exhibit an enhancement over a large range of densities and temperatures around the critical point and become infinite at the critical point. This behavior can be described by models that produce a smooth crossover from the singular behavior of the thermal conductivity asymptotically close to the critical point to the residual values far away from the critical point.118–120 The density-dependent terms for thermal conductivity can be grouped according to Eq. (1) as [Δλ(ρ,T) + Δλc(ρ,T)]. To assess the critical enhancement either theoretically or empirically, we need to evaluate, in addition to the dilute-gas thermal conductivity, the residual thermal-conductivity contribution. The procedure adopted during this analysis used ODRPACK (Ref. 116) to fit the primary data to determine the coefficients Bij of the background thermal conductivity, Eq. (4), while maintaining the values of the dilute-gas thermal-conductivity data obtained by Eq. (3) and calculating the critical enhancement with the model discussed in the next section. The density values employed were obtained by the equation of state of Span and Wagner.114 The residual thermal conductivity was represented with a polynomial in temperature and density:
| (4) |
During the regression process, it was found that the residual contribution as given by Eq. (4) does not require the temperature-dependent coefficients B2,i for representation of supercritical and vapor-phase data. This also was pointed out by Vesovic et al.5 However, we found that allowing for temperature dependence of the residual contribution improved the representation of the liquid-phase data at high pressures (especially above 70 MPa), and we have included temperature coefficients B2,i in our correlation. The coefficients B1,i and B2,i are shown in Table 4.
TABLE 4.
Coefficients of Eq. (4) for the residual thermal conductivity of carbon dioxide.
| i | B1,i (W m−1 K−1) | B2,i (W m−1 K−1) |
|---|---|---|
| 1 | 1.001 28 × 10−2 | 4.308 29 × 10−3 |
| 2 | 5.604 88 × 10−2 | −3.585 63 × 10−2 |
| 3 | −8.116 20 × 10−2 | 6.714 80 × 10−2 |
| 4 | 6.243 37 × 10−2 | −5.228 55 × 10−2 |
| 5 | −2.063 36 × 10−2 | 1.745 71 × 10−2 |
| 6 | 2.532 48 × 10−3 | −1.964 14 × 10−3 |
3.3. The critical enhancement
The thermal conductivity and viscosity of a pure fluid diverge at the critical point.121, 122 The thermal diffusivity, a = λ/ρCp, approaches zero at the critical point since the isobaric specific heat, Cp, diverges more rapidly than the thermal conductivity.122 Data for thermal diffusivity can be converted to thermal conductivity data when accurate values for the density and isobaric specific heat are available or can be calculated at the measurement conditions with an equation of state. Thermal conductivity data obtained from thermal diffusivity data have additional uncertainty associated with the ρ and Cp values that must be considered. Thus, it was decided to base the correlation on direct determinations of the thermal conductivity.
Thermal diffusivity data from light scattering are available much closer to the critical point and have the advantage in the critical region of not requiring a macroscopic temperature gradient, with a corresponding density gradient that can drive convection during thermal conductivity measurements. It was further decided to validate the critical enhancement model with the thermal diffusivity data very close to the critical point where thermal conductivity data are not available.
3.3.1. Simplified crossover model
The theoretically based crossover model proposed by Olchowy and Sengers118–120 is complex and requires solution of a quartic system of equations in terms of complex variables. A simplified crossover model has also been proposed by Olchowy and Sengers.123 The critical enhancement of the thermal conductivity from this simplified model is given by
| (5) |
with
| (6) |
and
| (7) |
In Eqs. (5) – (7), kB is Boltzmann’s constant, η̄ is the viscosity, and Cp and Cv are the isobaric and isochoric specific heat. All thermodynamic properties were obtained from the equation of state of Span and Wagner.114 To estimate the viscosity, one can use either the correlation of Fenghour124 or a new correlation just developed.126 Both are implemented in the REFPROP (Ref. 125) program, the results reported here use the new formulation.126 The correlation length ξ is given by
| (8) |
This crossover model requires the universal constants121 RD = 1.02, ν = 0.63, and γ = 1.239, and system-dependent amplitudes Γ and ξ0. For this work, as was done previously by Vesovic et al.,5 we adopted the values Γ = 0.052 and ξ0 = 1.50×10⁻¹⁰ m, determined specifically for carbon dioxide127 instead of using the general-method presented by Perkins et al.121 The reference temperature Tref, far above the critical temperature where the critical enhancement is negligible, was calculated by Tref = (3/2) Tc,121 which for carbon dioxide is 456.19 K. The only critical-region parameter that needs to be determined is q̄D. We used the effective cutoff wavelength found in Vesovic et al.,5 4.0 ×10⁻¹⁰ m. The equation of state of Span and Wagner114 displays some non-physical behavior at temperatures very close to the critical point that affects the heat capacity and the derivative of density with respect to pressure, so all data within 1 K of the critical point were excluded from the regression, and the set of B1,i coefficients were obtained. The scaled equation of state of Albright et al.127 was then used to validate this value of q̄D and the background coefficients of Eq. (4), with both thermal conductivity and thermal diffusivity data within 1 K of critical as discussed in Sec. 3.3.2.
Table 5 summarizes comparisons of the primary data with the correlation. We have defined the percent deviation as PCTDEV = 100·(λexp–λcal)/λcal, where λexp is the experimental value of the thermal conductivity and λcal is the value calculated from the correlation. Thus, the average absolute percent deviation (AAD) is found with the expression AAD = (Σ|PCTDEV|)/n, where the summation is over all n points, the bias percent is found with the expression BIAS = (ΣPCTDEV)/n. Table 6 summarizes the deviations over all data sets.
TABLE 5.
Evaluation of the carbon dioxide thermal-conductivity correlation for the primary data.a
| 1st author | Year Publ. | Nο. of Data | AAD (%) | BIAS (%) |
|---|---|---|---|---|
| Perkins7 | 2016 | 4095 | 1.42 | −0.63 |
| Li24 | 1994 | 14 | 0.39 | 0.12 |
| Millat25 | 1987 | 78 | 0.80 | −0.70 |
| Johns26 | 1986 | 46 | 0.40 | −0.04 |
| Imaishi27 | 1984 | 23 | 0.56 | −0.27 |
| Scott28 | 1983 | 47 | 1.23 | −0.96 |
| Clifford29 | 1979 | 20 | 0.49 | −0.23 |
| Snel30 | 1979 | 93 | 1.63 | −1.63 |
| Tarzimanov31 | 1978 | 26 | 1.92 | 1.80 |
| Bakulin32 | 1976 | 7 | 1.31 | −1.05 |
| Bakulin33 | 1975 | 28 | 1.33 | 0.08 |
| Haarman34 | 1973 | 8 | 0.37 | −0.35 |
| Le Neindre35, 36 | 1973 | 528 | 1.57 | −0.28 |
| LeNeindre37 | 1972 | 193 | 1.47 | 0.27 |
| Le Neindre38 | 1968 | 27 | 2.14 | 0.64 |
| Michels39,a | 1962 | 162 | 2.79 | −1.69 |
| Keyes40 | 1955 | 2 | 0.98 | −0.55 |
| Keyes41 | 1951 | 7 | 0.95 | 0.18 |
| Lenoir42 | 1951 | 3 | 0.70 | 0.70 |
| Johnston43 | 1946 | 14 | 0.82 | −0.05 |
| Dickins44 | 1934 | 6 | 0.81 | −0.81 |
| Entire data set | 5427 | 1.5 | −0.6 |
Data within +/− 1 K of the critical temperature excluded
TABLE 6.
Evaluation of the carbon dioxide thermal-conductivity correlation for all data sets.
| 1st author | Year Publ. | No. of data | AAD (%) | BIAS (%) |
|---|---|---|---|---|
| Perkins7 | 2016 | 4824 | 4.1 | 2.2 |
| Tomida45 | 2010 | 19 | 1.3 | −0.6 |
| Patek46 | 2005 | 77 | 0.7 | −0.4 |
| Heinemann47 | 2000 | 3 | 4.7 | 4.7 |
| Chen48 | 1999 | 66 | 38.6 | 35.7 |
| Dohrn49 | 1999 | 7 | 4.3 | 4.3 |
| Li24 | 1994 | 14 | 0.4 | 0.1 |
| Millat25 | 1987 | 91 | 0.8 | −0.4 |
| Johns26 | 1986 | 47 | 0.5 | −0.2 |
| Imaishi27 | 1984 | 23 | 0.6 | −0.3 |
| Zheng50 | 1984 | 13 | 0.5 | −0.2 |
| Scott28 | 1983 | 92 | 2.1 | 0.6 |
| Yorizane51 | 1983 | 15 | 1.2 | 0.3 |
| Clifford29 | 1979 | 22 | 0.5 | −0.2 |
| Snel30 | 1979 | 133 | 1.4 | −1.4 |
| Becker52 | 1978 | 217 | 7.7 | −1.0 |
| Tarzimanov31 | 1978 | 94 | 2.8 | 2.5 |
| Ulybin53 | 1977 | 14 | 2.0 | 0.6 |
| Bakulin32 | 1976 | 10 | 2.7 | −2.6 |
| Bakulin33 | 1975 | 28 | 1.3 | 0.1 |
| Chen54 | 1975 | 34 | 4.6 | −4.6 |
| Haarman34 | 1973 | 8 | 0.4 | −0.4 |
| LeNeindre35, 36 | 1973 | 536 | 1.6 | −0.2 |
| Salmanov55 | 1973 | 19 | 3.3 | 3.3 |
| Shashkov56 | 1973 | 9 | 1.4 | −1.0 |
| Dijkema57 | 1972 | 2 | 4.0 | −4.0 |
| LeNeindre37 | 1972 | 194 | 1.5 | 0.2 |
| Gupta58 | 1970 | 11 | 5.2 | −5.2 |
| Maczek59 | 1970 | 1 | 1.9 | −1.9 |
| Murthy60 | 1970 | 3 | 1.3 | 0.9 |
| Murthy61 | 1970 | 53 | 33.3 | 29.4 |
| Tarzimanov62 | 1970 | 52 | 50.3 | 49.1 |
| Golubev63 | 1969 | 733 | 9.9 | 9.1 |
| Rosenbaum64 | 1969 | 50 | 2.8 | 0.3 |
| Barua65 | 1968 | 5 | 2.2 | −2.1 |
| LeNeindre38 | 1968 | 31 | 2.2 | 0.8 |
| Shingarev66 | 1968 | 23 | 3.8 | −0.8 |
| van Dael67 | 1968 | 1 | 1.5 | −1.5 |
| Freud68 | 1967 | 42 | 6.0 | 1.6 |
| Mukhopadhyay69 | 1967 | 7 | 1.7 | −0.9 |
| Mukhopadhyay70 | 1967 | 5 | 2.2 | −2.1 |
| Baker71 | 1964 | 1 | 1.9 | −1.9 |
| Senftleben72 | 1964 | 8 | 2.3 | 0.9 |
| Amirkhanov73 | 1963 | 20 | 22.6 | −22.2 |
| Michels39 | 1962 | 253 | 11.8 | 6.4 |
| Cheung74 | 1962 | 2 | 1.1 | −1.1 |
| Guildner75 | 1962 | 39 | 10.3 | 8.0 |
| Westenberg76 | 1962 | 3 | 1.5 | −1.5 |
| Geier77 | 1961 | 23 | 9.6 | −8.9 |
| Vines78 | 1960 | 4 | 1.2 | 0.5 |
| Chaikin79 | 1958 | 5 | 5.4 | −5.4 |
| Guildner80 | 1958 | 22 | 15.6 | 13.5 |
| Waelbroeck81 | 1958 | 1 | 1.0 | −1.0 |
| Salceanu82 | 1956 | 1 | 6.2 | −6.2 |
| Keyes40 | 1955 | 2 | 1.0 | −0.6 |
| Kulakov83 | 1955 | 2 | 64.9 | −64.9 |
| Rothman84 | 1955 | 2 | 4.9 | −4.9 |
| Filippov85 | 1954 | 6 | 13.1 | 4.3 |
| Thomas86 | 1954 | 4 | 1.5 | −1.5 |
| Davidson87 | 1953 | 1 | 3.8 | −3.8 |
| Rothman88 | 1953 | 25 | 3.6 | −2.2 |
| Franck89 | 1951 | 7 | 4.8 | −4.8 |
| Keyes41 | 1951 | 9 | 1.6 | 1.0 |
| Lenoir42 | 1951 | 32 | 4.4 | 4.4 |
| Kannuiluik90 | 1950 | 9 | 2.7 | −2.7 |
| Stolyarov91 | 1950 | 17 | 8.0 | 3.1 |
| Borovik92 | 1949 | 18 | 7.0 | −6.8 |
| Keyes93 | 1949 | 8 | 4.6 | −4.5 |
| Stops94 | 1949 | 1 | 1.3 | 1.3 |
| Timrot95 | 1949 | 160 | 11.8 | −0.7 |
| Kannuiluik96 | 1947 | 15 | 1.6 | 1.5 |
| Johnston43 | 1946 | 14 | 0.8 | 0.0 |
| Vargaftik97 | 1946 | 13 | 2.7 | −2.7 |
| Eucken98 | 1940 | 6 | 5.3 | −4.8 |
| Koch99 | 1940 | 54 | 5.2 | −4.8 |
| Sherratt100 | 1939 | 10 | 2.0 | 1.8 |
| Archer101 | 1935 | 11 | 6.4 | −6.4 |
| Dickins44 | 1934 | 6 | 0.8 | −0.8 |
| Kannuiluik102 | 1934 | 1 | 2.3 | −2.3 |
| Kardos103 | 1934 | 6 | 150.2 | 150.2 |
| Sellschopp104 | 1934 | 50 | 7.7 | 0.6 |
| Trautz105 | 1933 | 19 | 29.2 | 22.6 |
| Kornfeld106 | 1931 | 1 | 2.6 | 2.6 |
| Gregory107 | 1927 | 6 | 0.6 | 0.2 |
| Weber 108 | 1927 | 1 | 2.6 | −2.6 |
| Weber109 | 1917 | 1 | 3.7 | −3.7 |
| Schleiermacher110 | 1888 | 1 | 2.0 | 2.0 |
| Graetz111 | 1881 | 1 | 11.1 | −11.1 |
| Winkelmann112 | 1880 | 1 | 13.5 | −13.5 |
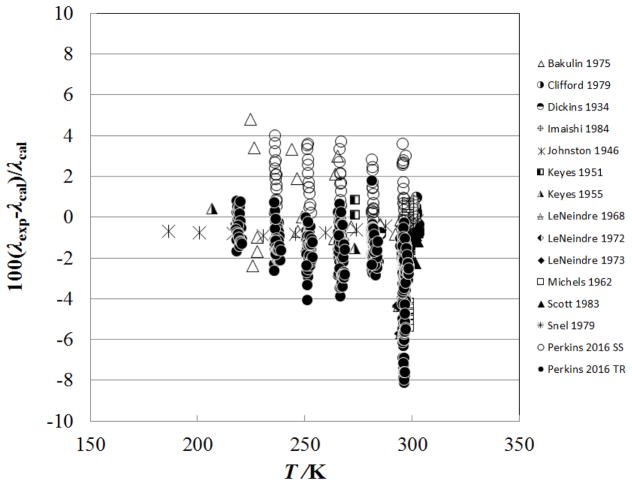
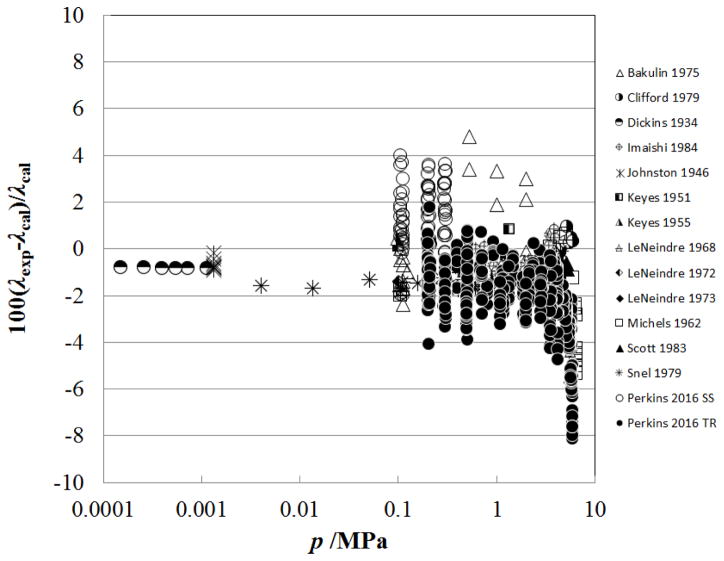
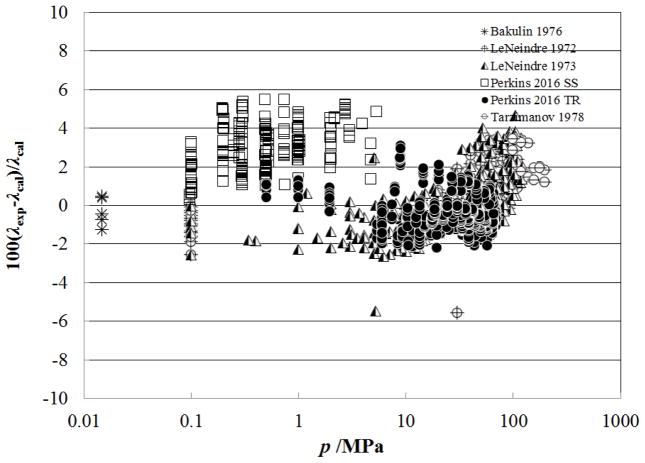
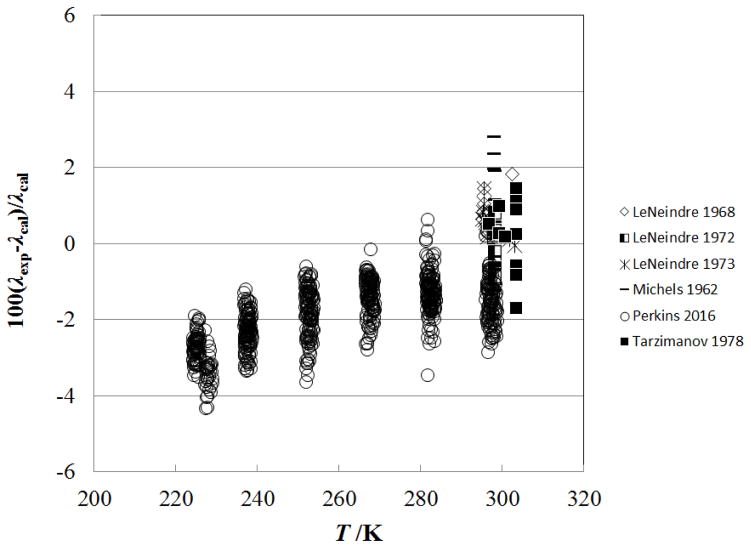
Figure 4 shows the percentage deviation of the primary data for the sub-critical vapor region (densities from 0.02–341.81 kg m−3, pressures from 0.0001 MPa to 7.2 MPa) as a function of temperature, while Fig. 5 shows the deviations as a function of pressure. The data sets with the lowest uncertainties cover only the region very close to 300 K (298 K – 304 K) and are Imaishi et al.,27 Clifford et al.,29 and Snel et al.30 There is a systematic offset for Snel et al.30 due to the dilute-gas correlation, but all three of these data sets are represented to within 1%. The measurements of Perkins7 cover the broader range of temperatures from 218 K to 299 K, at pressures from 0.1 MPa to 5.5 MPa. The steady-state measurements of Perkins with the low-temperature apparatus are systematically higher than the transient results, but still generally within the estimated uncertainty of ±3 %. This is likely due to increased uncertainty in the temperature rise measurement; the low-temperature instrument only has three leads within the pressure vessel so the potential across each hot–wire is measured with wires that also carry the measurement current. As the critical temperature and pressure are approached, the Michels et al.39 data show larger deviations; data within 1 K of critical have been excluded from the plot.
Figure 4.
Percentage deviations of primary experimental data of carbon dioxide from the values calculated by the present model as a function of temperature, for the vapor region.
Figure 5.
Percentage deviations of primary experimental data of carbon dioxide from the values calculated by the present model as a function of pressure, for the vapor region.
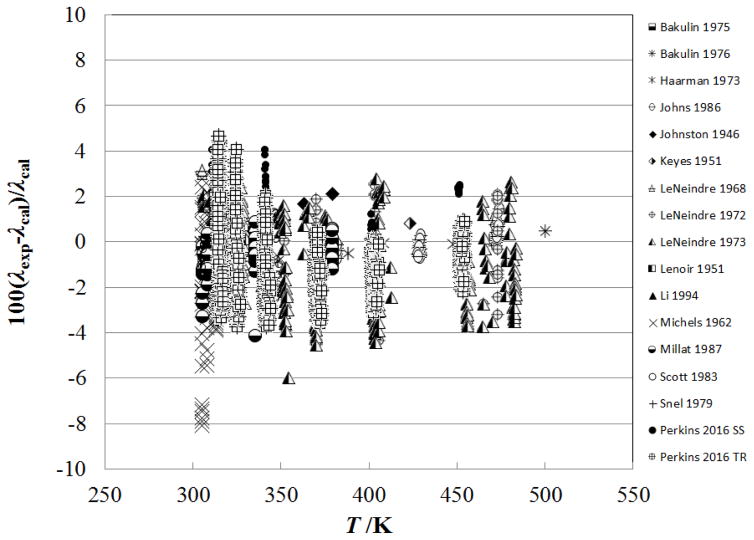
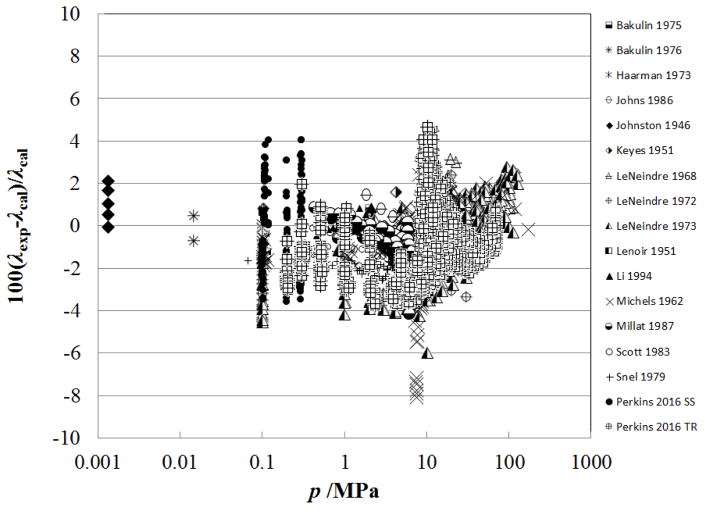
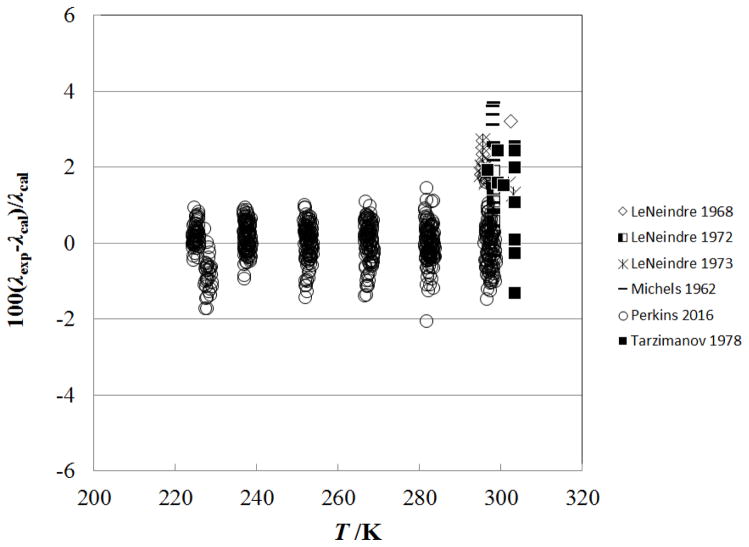
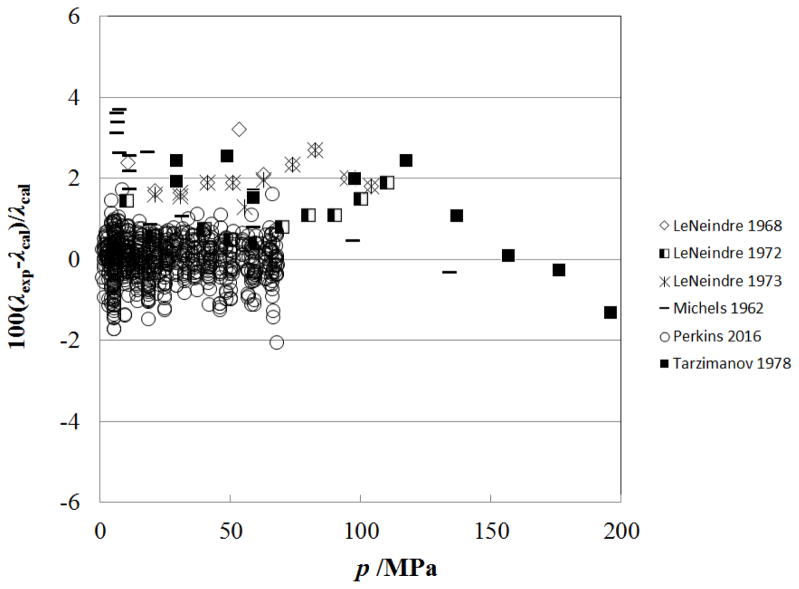
Figure 6 shows the percentage deviation of the primary data for the supercritical region at temperatures up to 500 K (densities from 0.02–341.81 kg m−3, pressures from 0.0001 MPa to 7.2 MPa) as a function of temperature, while Fig. 7 shows the deviations as a function of pressure. In this region, the measurements of Haarman34 and Snel et al.30 are represented to within 1%, although there is a systematic offset for Snel et al.30 due to the dilute-gas correlation. The steady-state hot-wire measurements of Perkins range up to 70 MPa and are represented to within their experimental uncertainty of 2%. The other measurements (transient method) of Perkins in the temperature region from the critical temperature to 500 K, have a slightly higher uncertainty, 3% and are also represented to within 2%.
Figure 6.
Percentage deviations of primary experimental data of carbon dioxide from the values calculated by the present model as a function of temperature, for the supercritical region at temperatures to 500 K.
Figure 7.
Percentage deviations of primary experimental data of carbon dioxide from the values calculated by the present model as a function of pressure, for the supercritical region at temperatures to 500 K.
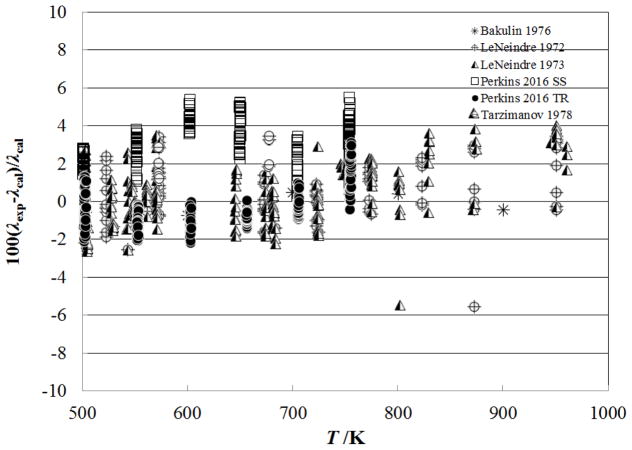
Figure 8 shows the percentage deviation of the primary data for temperatures above 500 K as a function of temperature, while Fig. 9 shows the deviations as a function of pressure. The measurements of Perkins7, extending to 70 MPa, are represented to within their estimated uncertainty, 3%. The measurements of LeNeindre et al.,35, 37 Bakulin et al.,32 and Tarzimanov and Arslanov31 also fall within 3%.
Figure 8.
Percentage deviations of primary experimental data of carbon dioxide from the values calculated by the present model as a function of temperature, for the supercritical region at temperatures above 500 K.
Figure 9.
Percentage deviations of primary experimental data of carbon dioxide from the values calculated by the present model as a function of pressure, for the supercritical region at temperatures above 500 K.
Figure 10 shows the percentage deviations of the primary data in the liquid phase as a function of temperature, and Fig. 11 shows the same as a function of pressure, excluding data within 1 K of critical. The measurements of Perkins in this region have an estimated uncertainty of 0.5%, and the correlation represents the data to within 1%. Comparisons with the data of Tarzimanov and Arslanov31 show deviations lower than 3% at pressures to 196 MPa. As the critical region is approached, the deviations become larger. One of the motivations for this work was to incorporate the new liquid-phase measurements of Perkins7 to allow improvement in the representation of the liquid phase. Figures 12 and 13 show the percentage deviations of the primary data in the liquid phase as a function of temperature for the previous correlations, that of Vesovic et al.5 (Fig. 12) and Scalabrin et al.6 (Fig. 13). Upon comparing these two figures with Fig. 10, the improvement in the representation of the liquid phase is shown.
Figure 10.
Percentage deviations of primary experimental data of carbon dioxide from the values calculated by the present model as a function of temperature, for the liquid phase.
Figure 11.
Percentage deviations of primary experimental data of carbon dioxide from the values calculated by the present model as a function of pressure, for the liquid phase.
Figure 12.
Percentage deviations of primary experimental data of carbon dioxide from the values calculated by the Vesovic et al.5 model as a function of temperature, for the liquid phase.
Figure 13.
Percentage deviations of primary experimental data of carbon dioxide from the values calculated by the Scalabrin et al.6 model as a function of temperature, for the liquid phase.
3.3.2. Thermal diffusivity validation
The thermal conductivity model described above is based entirely on reliable thermal conductivity data that were measured at temperatures where the equation of state of Span and Wagner114 is accurate. The scaled equation of state of Albright et al.127 provides better values for the thermodynamic properties in the temperature region (303.1282 ≤ T / K ≤ 305.1282) with densities (350 ≤ ρ / kg m−3 ≤ 530). The Albright et al.127 equation of state was also used in the 1990 correlation of Vesovic et al.5 where it was required over a larger temperature region (301.15 ≤ T / K ≤ 323) K and density region (290 ≤ ρ/ kg m−3 ≤ 595). The Albright et al.127 scaled equation of state was based on the IPTS–68 temperature scale so we have used it here with the ITS–90 values for the critical point of CO2 from the equation of state of Span and Wagner114 to effectively convert it to the ITS–90 temperature scale.
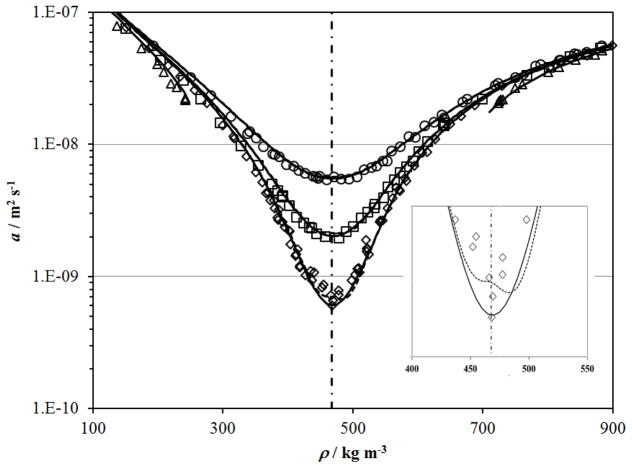
The thermal diffusivity of CO2 was measured with transient interferometry of the fluid below a horizontal heated surface near its critical point by Becker and Grigull.52 These measurements were reported along one liquid isotherm at 298.147 K and three supercritical isotherms at 304.362 K, 305.228 K and 307.958 K (converted to ITS-90), and are shown in Figure 14 along with curves calculated with the correlation described above and thermodynamic properties from the Albright et al.127 scaled equation of state. Only the isotherm at 304.362 K requires the scaled equation of state127 but it is valid at all of these temperatures. Non–physical behavior is visible in the values calculated with the Span and Wagner114 equation of state, dashed line, at 304.362 K, seen more easily in the inset in Figure 14.
Figure 14.
Thermal diffusivity of CO2 measured with a interferometry of the fluid sample below a transient heated plate by Becker and Grigull52 along isotherms near the critical point. The isotherms are designated by symbols: △, 298.147 K; ◇, 304.362 K; □, 305.228 K, ○, 307.958 K. The dashed lines show the calculated thermal diffusivity with the present correlation with the Span and Wagner114 equation of state and the solid lines show the calculated thermal diffusivity with the present correlation with the Albright et al. 127 scaled equation of state. The critical density is shown with the dot–dashed line.
The thermal diffusivity of CO2 was also determined from light–scattering measurements of the width of the Rayleigh line.128–131 Here we will focus on the measurements of Swinney and Henry128 where tabular results were given. The other light–scattering measurements are consistent with these results. Swinney and Henry128 provide the Rayleigh line width, Γ, and the magnitude of the scattering vector, q, as a function of (T–Tc) along the critical isochore. The thermal diffusivity can be obtained from these values with the expression
| (9) |
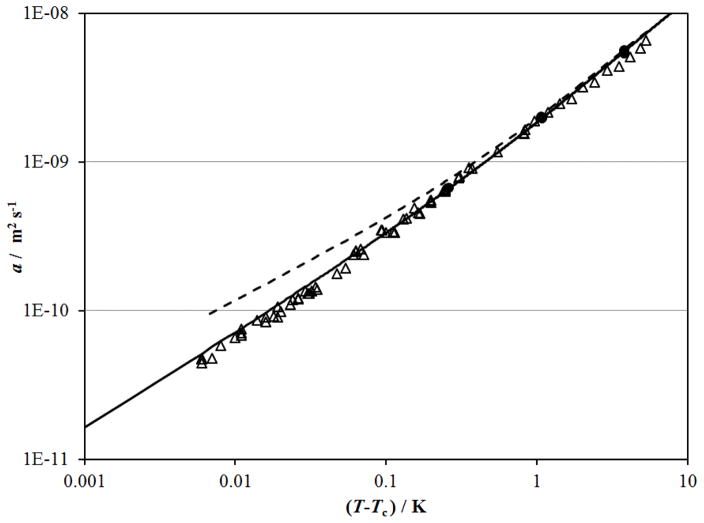
as shown by Kawasaki132 and applied by Henry et al.133 Equation (9) requires values for the correlation length, ξ, that were calculated with the Albright et al.127 scaled equation of state. Alternatively, along the critical isochore ξ= ξ0 [(T–Tc)/Tc]−ν with ξ0 and ν given in Sec. 3.3.1. Values of the thermal diffusivity, a, calculated from the light-scattering data of Swinney and Henry128 with Eq. (9) are shown in Fig. 15. The correlation for thermal conductivity developed here is consistent with the thermal diffusivity from light scattering to within (T–Tc)=0.006 K when used with the Albright et al. 127 scaled equation of state. The equation of state of Span and Wagner114 exhibits increasing errors near the critical point as indicated by the dashed line.
Figure 15.
Thermal diffusivity of CO2 along the critical isochore close to the critical temperature from the Rayleigh scattering line width from Swinney and Henry128 (△) and the transient interferometry measurements of Becker and Grigull52 (●). Solid curve is from the correlation for thermal conductivity described here with thermodynamic properties from the Albright et al. 127 equation of state. Dashed curve is based on properties from the Span and Wagner114 equation of state.
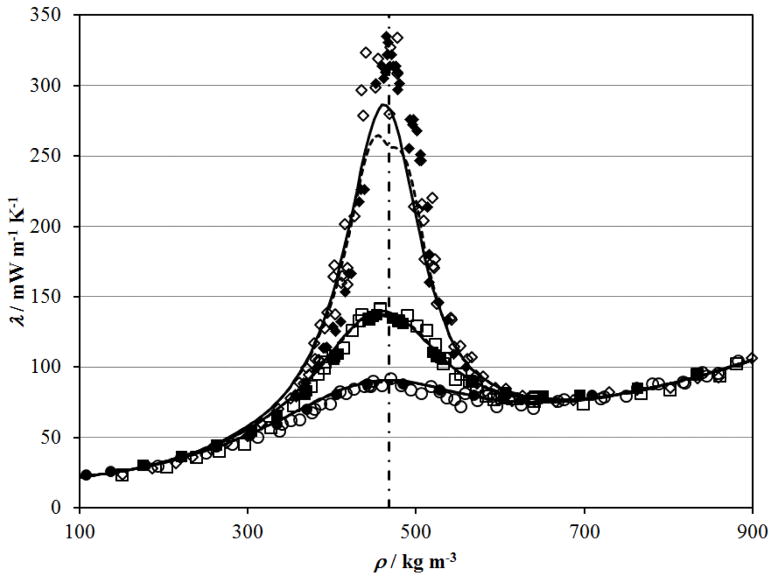
Finally, the thermal diffusivity data of Becker and Grigull52 are converted to thermal conductivity values for comparison with the direct thermal conductivity measurements of Michels et al.39 made with a steady–state parallel plate apparatus in the critical region. The thermal conductivity isotherms are shown in Fig. 16. Good agreement is found between the thermal conductivity data of Michels et al.39 and the thermal conductivity obtained from the thermal diffusivity data of Becker and Grigull.52 As in Fig. 14, the values calculated for thermal conductivity at 304.36 K exhibit non–physical behavior for the Span and Wagner114 equation of state (dashed line).
Figure 16.
Thermal conductivity along isotherms near the critical point measured directly by Michels et al. 39 and calculated from the thermal diffusivity data of Becker and Grigull52 with ρ and Cp from the Albright et al. equation of state. 127 Michels et al.39 thermal conductivity isotherms are designated by symbols; ◆, 304.357 K; ■,305.271 K; ●, 307.848 K. Becker and Grigull52 isotherms are designated by symbols: ◇, 304.362 K; □, 305.228 K, ○, 307.958 K. The dashed lines show the calculated thermal conductivity with the present correlation with the Span and Wagner114 equation of state and the solid lines show the calculated thermal conductivity with the present correlation with the Albright et al. 127 scaled equation of state. The critical density is shown with the dot–dashed line.
3.3.3. Empirical critical enhancement
For engineering applications at state points that are more than 10 K from the critical point, the critical enhancement in mW m−1 K−1 is represented to within about 5% by the following empirical expression:
| (10) |
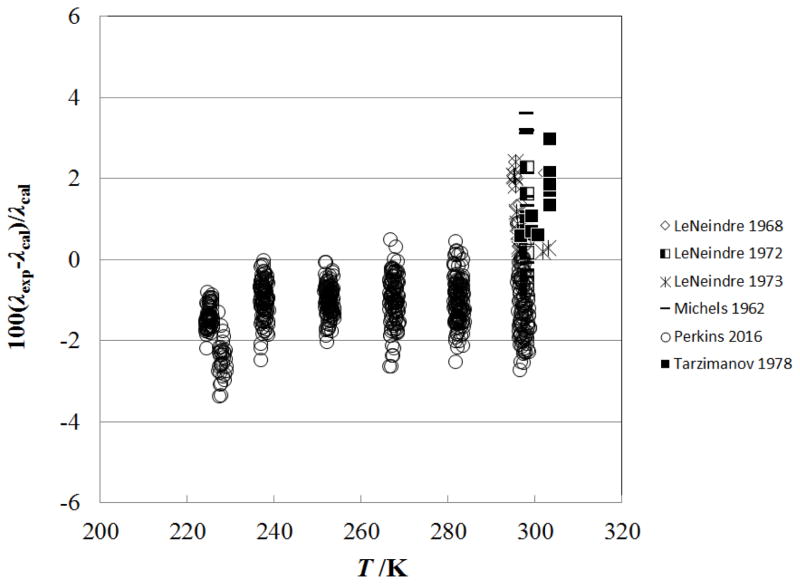
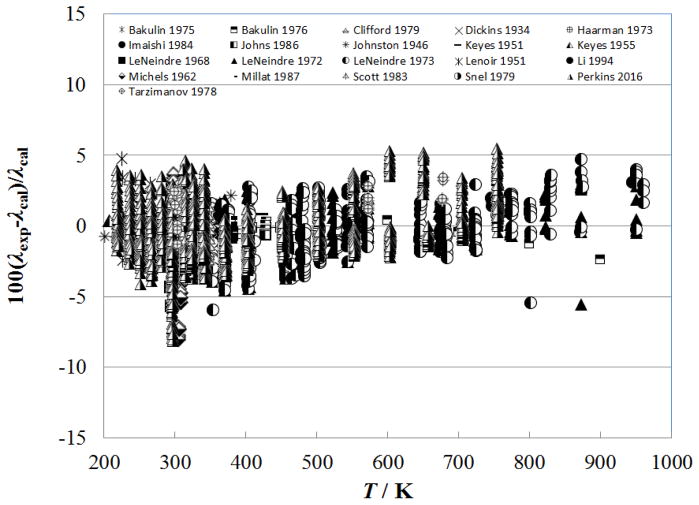
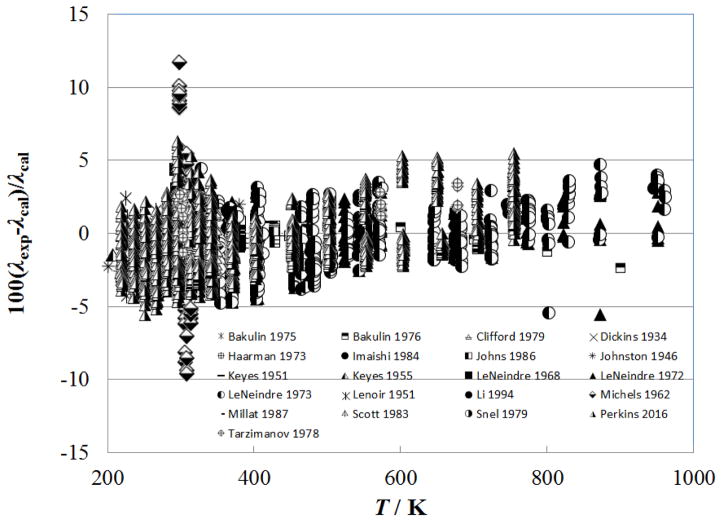
where ΔTc = (T/Tc) – 1 and Δρc = (ρ/ρc) – 1. This equation does not require accurate information on the compressibility, specific heat, and viscosity of carbon dioxide in the critical region, as does the theory of Olchowy and Sengers.69 However, it has no theoretical basis at all, and does not go to the theoretical limit at the critical point. It was obtained by using a symbolic regression program134 to fit the primary data with the background (Eqs. (3) and (4) ) coefficients fixed. This is an unusual function with poles, but they occur well within the two phase region and do not affect the calculation of the enhancement. Simpler empirical enhancement terms such as those used in previous publications were investigated, 11–17 but Eq. (10) gave superior results. Figure 17 shows the percentage deviations between all primary data (excluding values within 1 K of critical) and the values calculated by Eqs. (1), (3), (4) and (5–8), as a function of the temperature, while Fig. 18 shows the same calculated instead with Eqs. (1), (3), (4) and (10). By comparing these two figures, it can be seen that employing Eq. (10) is an adequate empirical representation of the thermal conductivity surface excluding the region within 10 K of the critical temperature.
Figure 17.
Percentage deviations of all primary experimental data of carbon dioxide from the values calculated by the full model Eq. (1), (3), (4) and (5)–(8) as a function of temperature.
Figure 18.
Percentage deviations of all primary experimental data of carbon dioxide from the values calculated by the empirical critical enhancement model Eq. (1), (3), (4) and (10) as a function of temperature.
4.0 Uncertainty assessments
4.1 Uncertainty outside of the critical region
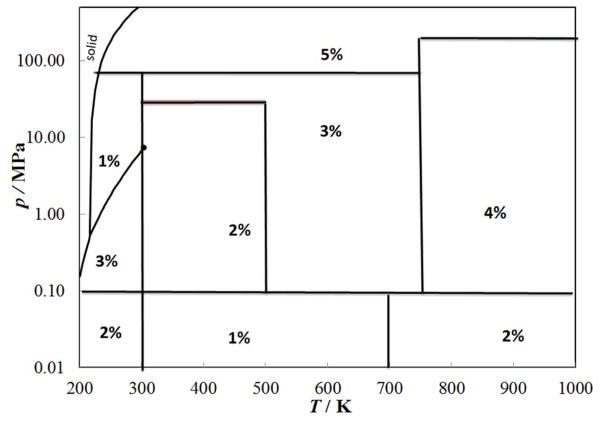
Figure 19 shows the estimated uncertainty of the correlation at a 95% confidence level. As indicated in the figure, for the vapor region below critical at pressures from 0.1 MPa to slightly below the critical pressure (~7 MPa) the estimated uncertainty is 3%. This is an improvement over the previous correlation of Vesovic et al.5 which had an uncertainty of 5% in this region. The improvement is due to the availability of the new data of Perkins.7 The liquid region, at temperatures from 224 K to 299 K at pressures to 70 MPa, is another region where the availability of new data has enabled improvements in the surface. Previously, the correlation of Vesovic et al.5 had an uncertainty estimate of 5% in this region; the present correlation has 1% uncertainty. Similarly, the availability of the new data of Perkins at temperatures to 750 K and pressures to 70 MPa made it possible to lower the uncertainty to 3% for this supercritical region. At very low pressures below 0.1 MPa, the correlation has an estimated uncertainty of uncertainty of 1% between 300 K and 700 K, increasing to 2% at both 150 K and 2000 K. Additional future measurements in the remaining areas of the pressure-temperature space at high temperatures and high pressures are desirable to allow further reductions in uncertainty for the thermal conductivity surface.
Figure 19.
Estimated uncertainty for the correlation excluding the critical region.
4.2 Uncertainty in the critical region
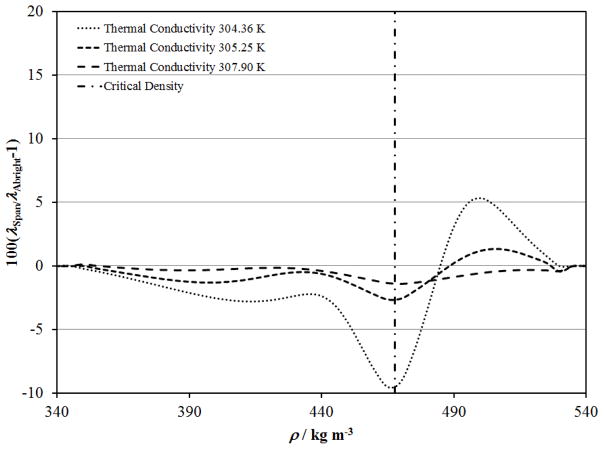
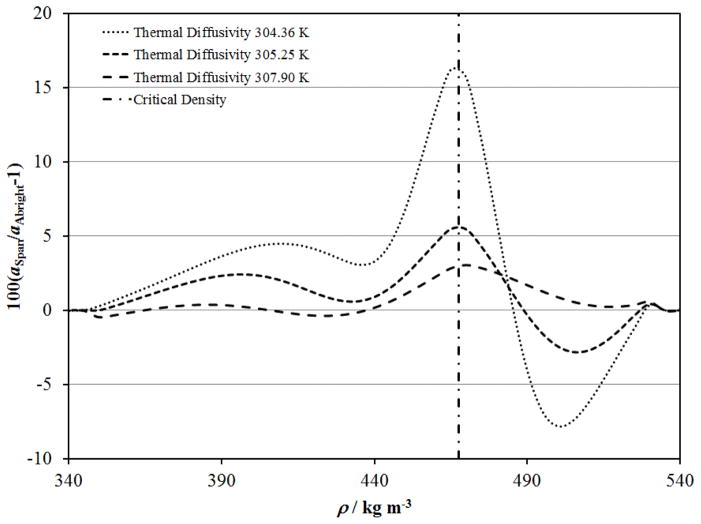
Figures 14 to 16 show that the critical enhancement calculated with ξ and Cp from the Albright et al. 127 scaled equation of state better represents the data in the critical region due to the limitations of the Span and Wagner114 equation of state. Figures 20 and 21 show differences between λ and a respectively, calculated with each of these equations of state along the isotherms near 304.36 K, 305.25 K and 307.90 K where reliable thermal conductivity and thermal diffusivity data are available. The data at 304.36 K are within 0.2 K of the critical temperature and were not included in the primary data set, while the thermal conductivity data of Michels et al. 39 near 305.25 K and 307.90 K were used with ξ and Cp from the Span and Wagner114 equation of state. Errors in λ and a due to non–physical behavior of the Span and Wagner114 equation of state in the critical region are less than 3% and 5% respectively near 305.25 K and 2% and 3% respectively near 307.90 K. The largest errors are near the critical density with systematic deviations in terms of density. The systematic errors in the Span and Wagner114 equation of state contribute to increased deviations for the Michels et al. 39 data at 305.25 K and 307.9 K in Figs. 6 and 7 on the supercritical isotherms, and similarly for the near-critical liquid and vapor in Figs. 10 and 11, and Figs. 4 and 5, respectively.
Figure 20.
Deviations in λ for the present correlation with thermodynamic properties calculated with the equation of state of Span and Wagner114 relative to the Albright et al.. 127 scaled equation of state in the critical region.
Figure 21.
Deviations in a for the present correlation with thermodynamic properties calculated with the equation of state of Span and Wagner114 relative to the Albright et al.. 127 scaled equation of state in the critical region.
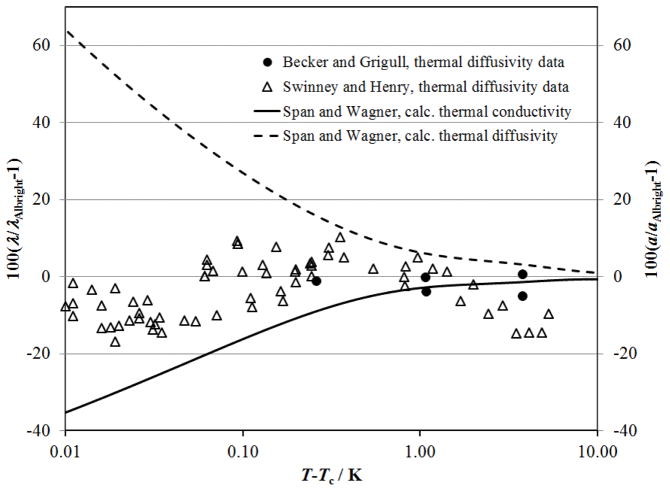
Figure 22 shows the deviations between the correlation developed here when the equation of state of Span and Wagner114 is used along the critical isochore relative to the same correlation with the scaled equation of state of Albright et al. 127 These deviations represent the maximum deviation observed at any given temperature in the critical region and increase dramatically as the critical temperature is approached. The thermal diffusivity is overestimated by about 65 % with (T–Tc)=0.01 K, while the thermal conductivity is underestimated by about 35 % when the Span and Wagner114 equation of state is used. Deviations between the available thermal diffusivity data and the correlation with thermodynamic properties from the scaled equation of state of Albright et al. 127 are also shown for reference. Clearly, the scaled equation of state of Albright et al. 127 should be used at temperatures very close to the critical temperature, when |(T–Tc)| < 1 K.
Figure 22.
Deviations in λ and a for the present correlation with thermodynamic properties calculated with the equation of state of Span and Wagner114 relative to the Albright et al. 127 scaled equation of state near the critical temperature, along the critical isochore. The solid line show deviations for thermal conductivity and the dashed line show deviations for thermal diffusivity. Deviations for measured thermal diffusivity data are shown with symbols: △, Swinney and Henry128 ; ●, Becker and Grigull.52
5. Computer–Program Verification and Recommended Values
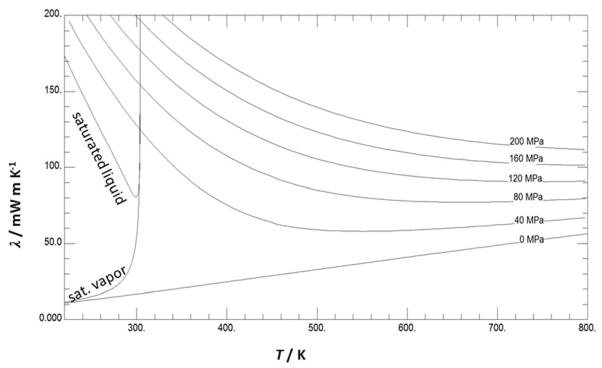
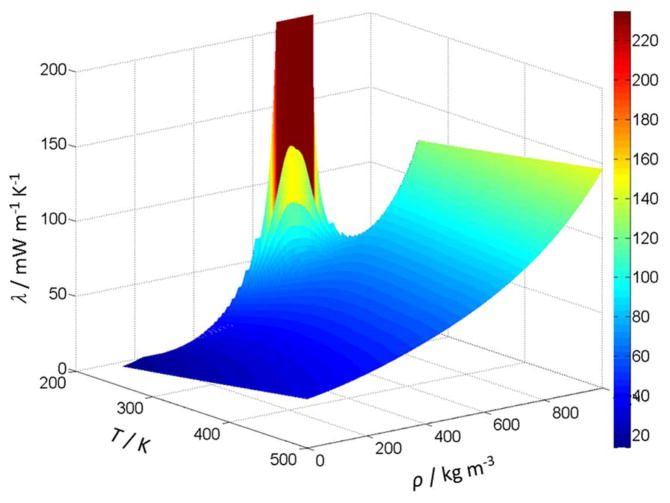
Table 7 is provided to assist the user in computer–program verification. The thermal–conductivity calculations are based on the tabulated temperatures and densities. Note that the point at 310 K has a very significant contribution from the enhancement term–approximately half of the thermal conductivity is the result of the enhancement term. Table 8 provides some recommended values over the thermal conductivity surface. Finally, Fig. 23 shows the thermal conductivity of CO2 as a function of temperature for different pressures calculated with the full model, Eq. (1), (3), (4) and (5)–(8), while Fig. 24 shows a portion of the 3-dimensional thermal conductivity surface, including the critical enhancement, which theoretically approaches infinity at the critical point and has been truncated at 240 mW m−1 K−1in this figure.
TABLE 8.
Recommended values of CO2 thermal conductivity (mW m−1 K−1)
| Pressure (MPa) | Temperature (K) | |||||||||
|---|---|---|---|---|---|---|---|---|---|---|
| 240 | 300 | 400 | 500 | 600 | 700 | 800 | 900 | 1000 | 1100 | |
| 0 | 12.28 | 16.72 | 24.67 | 32.84 | 40.93 | 48.80 | 56.41 | 63.72 | 70.75 | 77.51 |
| 0.1 | 12.34 | 16.77 | 24.72 | 32.88 | 40.96 | 48.83 | 56.44 | 63.75 | 70.78 | 77.53 |
| 20 | 165.5 | 106.0 | 47.40 | 43.17 | 48.04 | 54.31 | 60.97 | 67.67 | 74.28 | 80.74 |
| 40 | 180.2 | 127.4 | 75.10 | 58.84 | 57.97 | 61.23 | 66.04 | 71.50 | 77.23 | 83.05 |
| 60 | 193.1 | 143.3 | 92.68 | 72.94 | 68.47 | 69.29 | 72.34 | 76.47 | 81.18 | 86.17 |
| 80 | 204.7 | 156.8 | 106.5 | 84.55 | 77.80 | 77.02 | 78.85 | 81.97 | 85.81 | 90.06 |
| 100 | 215.5 | 168.8 | 118.5 | 94.66 | 86.01 | 84.00 | 84.96 | 87.38 | 90.60 | 94.27 |
| 120 | 225.7 | 179.9 | 129.5 | 103.9 | 93.50 | 90.33 | 90.56 | 92.45 | 95.22 | 98.49 |
| 140 | 190.3 | 139.8 | 112.6 | 100.5 | 96.20 | 95.70 | 97.12 | 99.55 | 102.5 | |
| 160 | 200.1 | 149.5 | 121.0 | 107.3 | 101.8 | 100.5 | 101.5 | 103.6 | 106.3 | |
| 180 | 209.5 | 158.8 | 129.2 | 114.0 | 107.2 | 105.1 | 105.5 | 107.3 | 109.8 | |
| 200 | 218.7 | 167.9 | 137.2 | 120.6 | 112.6 | 109.6 | 109.5 | 110.9 | 113.1 | |
Figure 23.
Thermal conductivity of CO2 as a function of temperature for different pressures.
Figure 24.
Thermal conductivity surface of CO2.
6. Conclusion
New wide-ranging correlations for the thermal conductivity of carbon dioxide were developed based on critically evaluated experimental data. The correlations are valid from the triple point to 1100 K, and at pressures up to 200 MPa. The correlations are expressed in terms of temperature and density, and the densities were obtained from the equation of state of Span and Wagner.114 The range of validity of this equation of state is 1100 K and 800 MPa. We recommend the use of the present thermal conductivity correlation only to 200 MPa, as there were no data available for validation at pressures above 200 MPa. The new formulation incorporates new experimental data of Perkins7 in the liquid phase, and recent theoretical calculations Hellmann8 for the dilute gas region. The overall uncertainty (at the 95% confidence level) of the proposed correlation varies depending on the state point from a low of 1% at very low pressures below 0.1 MPa between 300 K and 700 K, to 5% at the higher pressures of the range of validity. Representation of data very near the critical point is adversely affected by some anomalous behavior of the equation of state; future improvements in the equation of state would permit improvements in the critical region. In addition, there is room for improvement in the high pressure region (100 MPa-200 MPa) due to limited data in this region.
Acknowledgments
Funding for much of this work was provided by the U.S. Department of Energy, National Energy Technology Laboratory, under Interagency Agreement DE–FE0003931. We acknowledge David J.N. Wynne (Univ. Colorado Boulder) for helpful suggestions.
Footnotes
Partial contribution of NIST, not subject to copyright in the U.S.
References
- 1.Williams JR, Clifford AA, editors. Supercritical Fluid Methods and Protocols. Humana Press; Totowa, NJ: 2000. [Google Scholar]
- 2.Bansal PK. Applied Thermal Engineering. 2012;41:18. [Google Scholar]
- 3.Carbon Dioxide Enhanced Oil Recovery. National Energy Technology Laboratory; 2010. http://www.netl.doe.gov/file%20library/research/oil-gas/CO2_EOR_Primer.pdf. [Google Scholar]
- 4.New Brayton cycle turbines promise giant leap in performance. Sandia Lab News; 2011. http://www.sandia.gov/LabNews/110211.html. [Google Scholar]
- 5.Vesovic V, Wakeham WA, Olchowy GA, Sengers JV, Watson JTR, Millat J. J Phys Chem Ref Data. 1990;19:763. [Google Scholar]
- 6.Scalabrin G, Marchi P, Finezzo F, Span R. J Phys Chem Ref Data. 2006;35:1549. [Google Scholar]
- 7.Perkins RA. J Chem Eng Data. 2015 unpublished. [Google Scholar]
- 8.Hellmann R. Chem Phys Lett. 2014;613:133. [Google Scholar]
- 9.Assael MJ, Assael JAM, Huber ML, Perkins RA, Takata Y. J Phys Chem Ref Data. 2011;40:033101. [Google Scholar]
- 10.Assael MJ, Koini IA, Antoniadis KD, Huber ML, Abdulagatov IM, Perkins RA. J Phys Chem Ref Data. 2012;41:023104. [Google Scholar]
- 11.Assael MJ, Mylona SK, Huber ML, Perkins RA. J Phys Chem Ref Data. 2012;41:023101. [Google Scholar]
- 12.Assael MJ, Mihailidou EK, Huber ML, Perkins RA, Abdulagatov IM. J Phys Chem Ref Data. 2012;41:043102. [Google Scholar]
- 13.Mylona SK, Antoniadis KD, Assael MJ, Huber ML, Perkins RA. J Phys Chem Ref Data. 2014;43:043104. [Google Scholar]
- 14.Assael MJ, Mylona SK, Huber ML, Perkins RA. J Phys Chem Ref Data. 2013;42:013106. [Google Scholar]
- 15.Assael MJ, Bogdanou I, Mylona SK, Huber ML, Perkins RA, Vesovic V. J Phys Chem Ref Data. 2013;42:023101. [Google Scholar]
- 16.Sykioti EA, Assael MJ, Huber ML, Perkins RA. J Phys Chem Ref Data. 2013;42:043101. doi: 10.1063/1.4940892. [DOI] [PMC free article] [PubMed] [Google Scholar]
- 17.Assael MJ, Sykioti EA, Huber ML, Perkins RA. J Phys Chem Ref Data. 2013;42:023102. doi: 10.1063/1.4940892. [DOI] [PMC free article] [PubMed] [Google Scholar]
- 18.Huber ML, Perkins RA, Friend DG, Sengers JV, Assael MJ, Metaxa IN, Miyagawa K, Hellmann R, Vogel E. J Phys Chem Ref Data. 2012;41:033102. [Google Scholar]
- 19.Michailidou EK, Assael MJ, Huber ML, Perkins RA. J Phys Chem Ref Data. 2013;42:033104. [Google Scholar]
- 20.Michailidou EK, Assael MJ, Huber ML, Abdulagatov IM, Perkins RA. J Phys Chem Ref Data. 2014;43:023103. [Google Scholar]
- 21.Huber ML, Perkins RA, Laesecke A, Friend DG, Sengers JV, Assael MJ, Metaxa IN, Vogel E, Mares R, Miyagawa K. J Phys Chem Ref Data. 2009;38:101. [Google Scholar]
- 22.Avgeri S, Assael MJ, Huber ML, Perkins RA. J Phys Chem Ref Data. 2014;43:033103-1. [Google Scholar]
- 23.Assael MJ, Ramires MLV, Nieto de Castro CA, Wakeham WA. J Phys Chem Ref Data. 1990;19:113. [Google Scholar]
- 24.Li SFY, Papadaki M, Wakeham WA. Thermal conductivity of low density polyatomic gases. In: Tong TW, editor. Thermal Conductivity; Paper presented at International Thermal Conductivity Conference; Lancaster, Pennsylvania: Technomic Publishing Company; 1994. pp. 531–542. [Google Scholar]
- 25.Millat J, Mustafa M, Ross M, Wakeham WA, Zalaf M. Physica A. 1987;145:461. [Google Scholar]
- 26.Johns AI, Rashid S, Watson JTR. J Chem Soc, Faraday Trans. 1986;182:2235. [Google Scholar]
- 27.Imaishi N, Kestin J, Wakeham WA. Physica A. 1984;123:50. [Google Scholar]
- 28.Scott AC, Johns AI, Watson JTR, Clifford AA. J Chem Soc, Faraday Trans I. 1983;79:733. [Google Scholar]
- 29.Clifford AA, Kestin J, Wakeham WA. Physica A. 1979;97:287. [Google Scholar]
- 30.Snel JAA, Trappeniers NJ, Botzen A. Proc Koninklijke Nederlandse Akademie van Wetenschappen, Ser B, Palaeontology, geology, physics and chemistry. 1979;82:316. [Google Scholar]
- 31.Tarzimanov AA, Arslanov VA. Teploni Mass V Khim Tekhnol. 1978;3:13. [Google Scholar]
- 32.Bakulin SS, Ulybin SA, Zherdev EP. High Temp. 1976;14:351. [Google Scholar]
- 33.Bakulin SS, Ulybin SA, Zherdev EP. Teplofiz Vys Temp. 1975;13:96. [Google Scholar]
- 34.Haarman JW. AIP Conf Proc. 1973;11:193. [Google Scholar]
- 35.Le Neindre B, Tufeu R, Bury P, Sengers JV. Ber Bunsen-Ges Phys Chem. 1973;77:262. [Google Scholar]
- 36.Le Neindre B, Bury P, Tufeu R, Johannin P, Vodar B. presented at the Ninth Conference on Thermal Conductivity; Ames, Iowa: Iowa State University; 1969. unpublished. [Google Scholar]
- 37.Le Neindre B. Int J Heat Mass Transfer. 1972;15:1. [Google Scholar]
- 38.Le Neindre B, Bury P, Tufeu R, Johannin P, Vodar B. Proceedings of the 7th Conference on Thermal Conductivity. 1968;7:579. [Google Scholar]
- 39.Michels A, Sengers JV, Van der Gulik PS. Physica. 1962;28:1216. [Google Scholar]
- 40.Keyes FG. Trans ASME. 1955;77:1395. [Google Scholar]
- 41.Keyes FG. Trans ASME. 1951;73:597. [Google Scholar]
- 42.Lenoir JM, Comings EW. Chem Eng Progress. 1951;47:223. [Google Scholar]
- 43.Johnston HL, Grilly ER. J Chem Phys. 1946;14:233. [Google Scholar]
- 44.Dickins BG. Proc R Soc London, Ser A. 1934;143:517. [Google Scholar]
- 45.Tomida D, Odashima T, Yokohama C. Soc Chem Eng (Japan) 2010;36:429. [Google Scholar]
- 46.Patek J, Klomfar J, Capla L, Buryan P. Int J Thermophys. 2005;26:577. [Google Scholar]
- 47.Heinemann T, Klaen W, Yourd R, Dohrn R. J Cellular Plastics. 2000;36:45. [Google Scholar]
- 48.Chen Z-H, Tozaki K-I, Nishikawa K. Jpn J Appl Phys. 1999;38:6840. [Google Scholar]
- 49.Dohrn R, Treckmann R, Heinemann T. Fluid Phase Equilib. 1999;158–160:1021. [Google Scholar]
- 50.Zheng X-Y, Yamamoto S, Yoshida H, Masuoka H, Yorizane M. J Chem Eng Jpn. 1984;17:237. [Google Scholar]
- 51.Yorizane M, Yoshimura S, Masuoka H, Yoshida H. Ind Eng Chem Fundam. 1983;22:454. [Google Scholar]
- 52.Becker H, Grigull U. Warme- und Stoffubertragung. 1978;11:9. [Google Scholar]
- 53.Ulybin SA, Bakulin SS. Teploenergetika. 1977;24:85. [Google Scholar]
- 54.Chen SHP, Jain PC, Saxena SC. J Phys B. 1975;8:1962. [Google Scholar]
- 55.Salmanov RS, Tarzimanov AA. Trudy Kazanskogo Khimiko-Tekhnologicheskogo Instituta im Kirova. 1973;51:161. [Google Scholar]
- 56.Shashkov AG, Kamchatov FP. Vestsi Akad Nauka BSSR, Serya Fizika Energetychnykh Navuk. 1973;3:61. [Google Scholar]
- 57.Dijkema KM, Stouthart JC, De Vries DA. Warme- und Stoffubertragung. 1972;5:47. [Google Scholar]
- 58.Gupta GP, Saxena SC. Mol Phys. 1970;19:871. [Google Scholar]
- 59.Maczek AOS, Gray P. Trans Faraday Soc. 1970;66:127. [Google Scholar]
- 60.Murthy MLR, Simon HA. presented at the Fifth Symposium on Thermophysical Properties; Newton, MA. 1970. unpublished. [Google Scholar]
- 61.Murthy MLR, Simon HA. Phys Rev A. 1970;2:1458. [Google Scholar]
- 62.Tarzimanov AA. Trudy Kazanskogo Khimiko-Tekhnologicheskogo Instituta im Kirova. 1970;45:235. [Google Scholar]
- 63.Golubev IF, Kiyashova VP. Chemistry and Technology of Nitrogen fertilizer and Organic Synthesis Products, Physical-Chemical Studies. 1969;70 [Google Scholar]
- 64.Rosenbaum BM, Thodos G. J Chem Phys. 1969;51:1361. [Google Scholar]
- 65.Barua AK, Manna A, Mukhopadhyay P. J Phys Soc Jpn. 1968;25:862. [Google Scholar]
- 66.Shingarev RV. Table 10.2. In: Vukalovich MP, Altunin VA, editors. Thermophysical Properties of CO2. Collets; London: 1968. [Google Scholar]
- 67.Van Dael W, Cauwenbergh H. Physica. 1968;40:165. [Google Scholar]
- 68.Freud PJ, Rothberg GM. Rev Sci Instrum. 1967;38:238. [Google Scholar]
- 69.Mukhopadhyay P, Das Gupta A, Barua AK. Brit J Appl Phys. 1967;18:1301. [Google Scholar]
- 70.Mukhopadhyay P, Barua AK. Trans Faraday Soc. 1967;63:2379. [Google Scholar]
- 71.Baker CE, Brokaw RS. J Chem Phys. 1964;40:1523. [Google Scholar]
- 72.Senftleben H. Z Angew Phys. 1964;17:86. [Google Scholar]
- 73.Amirkhanov KI, Adamov AP. Teploenergetika. 1963;10:77. [Google Scholar]
- 74.Cheung H, Bromley LA, Wilke CR. AIChE J. 1962;8:221. [Google Scholar]
- 75.Guildner LA. J Res NBS. 1962;66A:341. [Google Scholar]
- 76.Westenberg AA, DeHaas N. Phys Fluids. 1962;5:266. [Google Scholar]
- 77.Geier H, Schafer K. Allg Warmetechnik. 1961;10:70. [Google Scholar]
- 78.Vines RG. Trans ASME. 1960;82:48. [Google Scholar]
- 79.Chaikin AM, Markevich AM. Zh Fiz Khim. 1958;32:116. [Google Scholar]
- 80.Guildner LA. Proc Natl Acad Sci U S A. 1958;44:1149. doi: 10.1073/pnas.44.11.1149. [DOI] [PMC free article] [PubMed] [Google Scholar]
- 81.Waelbroeck FG, Zuckerbrodt P. J Chem Phys. 1958;28:523. [Google Scholar]
- 82.Salceanu C, Bojin S. Compt Rend. 1956;243:237. [Google Scholar]
- 83.Kulakov IA. Izv Voronezh Pedagogical Inst. 1955;17:85. [Google Scholar]
- 84.Rothman AJ, Bromley LA. Ind Eng Chem. 1955;47:899. [Google Scholar]
- 85.Filippov LP. Vestnik Moskovskogo Universiteta. 1954;12:45. [Google Scholar]
- 86.Thomas LB, Golike RC. J Chem Phys. 1954;22:300. [Google Scholar]
- 87.Davidson JM, Music JF. Experimental thermal conductivities of gases and gaseous mixtures at zero degrees centigrade. Hanford Atomic Products Operation; Richland, WA: 1953. [Google Scholar]
- 88.Rothman AJ. Thermal conductivity of gases at high temperatures. 1953 [Google Scholar]
- 89.Franck EU. Z Elektrochemie. 1951;55:636. [Google Scholar]
- 90.Kannuluik WG, Donald HB. Austr J Sci Research, Ser A, Phys Sci. 1950;3:417. [Google Scholar]
- 91.Stolyarov EA, Ipatjer VV, Theodorowitsch VP. Zh Fiz Khim. 1950;24:166. [Google Scholar]
- 92.Borovik E. Z Eksperimental’noi: Teoreticheskoi Fiz. 1949;19:561. [Google Scholar]
- 93.Keyes FG. Summary of measurements of heat conductivity carried out under the Office of Naval Research Program from July 1, 1947 to June 15, 1949. 1949 [Google Scholar]
- 94.Stops DW. Nature. 1949;164:966. [Google Scholar]
- 95.Timrot DL, Oskolkova VG. Izvestiya VTI. 1949;18:4. [Google Scholar]
- 96.Kannuluik WG, Law PG. Proc Roy Soc Victoria. 1947;58:142. [Google Scholar]
- 97.Vargaftik NB, Oleshuk ON. Izv Vses Teplotekhn Inst Feliksn Dzerzhinskogo. 1946;15:7. [Google Scholar]
- 98.Eucken A. Forsch Geb Ingenieurwes. 1940;11:6. [Google Scholar]
- 99.Koch B, Fritz W. Wärme und Kältetechnik Zeitschrift für Klimatechnik, Trockentechnik Wärme und Schallschutztechnik. 1940;42:113. [Google Scholar]
- 100.Sherratt GG, Griffiths E. Phil Mag. 1939;27:68. [Google Scholar]
- 101.Archer CT. Phil Mag S. 1935;719:901. [Google Scholar]
- 102.Kannuluik WG, Martin LH. Proc Roy Soc A. 1934;144:496. [Google Scholar]
- 103.Kardos A. Z Ges Kalte Ind. 1934;41:1. [Google Scholar]
- 104.Sellschopp W. Forsch Geb Ingenieurwes. 1934;5:162. [Google Scholar]
- 105.Trautz M, Zundel A. Ann Phys. 1933;17:345. [Google Scholar]
- 106.Kornfeld G, Hilferding K. Bodenstein-Festband. 1931;792 [Google Scholar]
- 107.Gregory H, Marshall S. Proc R Soc London, Ser A. 1927;114:354. [Google Scholar]
- 108.Weber S. Ann Phys. 1927;82:479. [Google Scholar]
- 109.Weber S. Ann Phys. 1917;54:437. [Google Scholar]
- 110.Schleiermacher A. Ann Phys und Chem. 1888;270:623. [Google Scholar]
- 111.Graetz L. Ann Phys und Chem. 1881;14:232. [Google Scholar]
- 112.Winkelmann A. Ann Phys (Leipzig) 1880;11:474. [Google Scholar]
- 113.Preston-Thomas H. Metrologia. 1990;27:3. [Google Scholar]
- 114.Span R, Wagner W. J Phys Chem Ref Data. 1996;25:1509. [Google Scholar]
- 115.Cox MG. Metrologia. 2002;39:589. [Google Scholar]
- 116.Boggs PT, Byrd RH, Rogers JE, Schnabel RB. ODRPACK, Software for Orthogonal Distance Regression, NISTIR 4834, v2013. National Institute of Standards and Technology; Gaithersburg, MD: 1992. [Google Scholar]
- 117.Vargaftik NB. Handbook of Physical Properties of Liquids and Gases: Pure Substances and Mixtures. Hemisphere Publishing Corporation; New York, USA: 1983. [Google Scholar]
- 118.Olchowy GA, Sengers JV. Phys Rev Lett. 1988;61:15. doi: 10.1103/PhysRevLett.61.15. [DOI] [PubMed] [Google Scholar]
- 119.Mostert R, van den berg HR, Van der Gulik PS, Sengers JV. J Chem Phys. 1990;92:5454. [Google Scholar]
- 120.Perkins RA, Roder HM, Friend DG, Nieto de Castro CA. Physica. 1991;173:332. [Google Scholar]
- 121.Perkins RA, Sengers JV, Abdulagatov IM, Huber ML. Int J Thermophys. 2013;34:191. [Google Scholar]
- 122.Sengers JV, Perkins RA. Fluids near Critical Points, Chap. 10. In: Assael ARHGMJ, Vesovic V, Wakeham WA, editors. Experimental Thermodynamics Volume IX- Advances in Transport Properties of Fluids. Royal Society of Chemistry; Cambridge: 2014. pp. 337–361. [Google Scholar]
- 123.Olchowy GA, Sengers JV. Int J Thermophys. 1989;10:417. [Google Scholar]
- 124.Fenghour A, Wakeham WA, Vesovic V. J Phys Chem Ref Data. 1998;27:31. [Google Scholar]
- 125.Lemmon EW, Huber ML, McLinden MO. NIST Standard Reference Database 23, NIST Reference Fluid Thermodynamic and Transport Properties Database (REFPROP): Version 9.1. National Institute of Standards and Technology; Gaithersburg, MD: 2013. [Google Scholar]
- 126.Muzny CD, Laesecke A. 2016 unpublished. [Google Scholar]
- 127.Albright PC, Edwards TJ, Chen ZY, Sengers JV. J Chem Phys. 1987;87:1717. [Google Scholar]
- 128.Swinney HL, Henry DL. Phys Rev A. 1973;8:2586. [Google Scholar]
- 129.Garrabos Y, Tufeu R, LeNeindre B, Zalczer G, Beysens D. J Chem Phys. 1980;72:4637. [Google Scholar]
- 130.Reile E, Jany P, Straub J. Wärme- und Stoffübertragung. 1984;18:99. [Google Scholar]
- 131.Maccabee BS, White JA. Phys Lett A. 1971;35:187. [Google Scholar]
- 132.Kawasaki K. Phys Rev A. 1970;1:1750. [Google Scholar]
- 133.Henry DL, Swinney HL, Cummins HZ. Phys Rev Lett. 1970;25:1170. [Google Scholar]
- 134.EUREQA Formulize v.098.1 (Nutonian Inc., MA, USA). Certain commercial products are identified in this paper to adequately specify the procedures used. Such identification does not imply recommendation or endorsement by the National Institute of Standards and Technology, nor does it imply that the products identified are necessarily the best available for that purpose.


