Abstract
Macroautophagy (hereafter referred to as autophagy) is a catabolic membrane trafficking process that degrades a variety of cellular constituents, and is associated with human diseases1–3. While extensive studies have focused on autophagic turnover of cytoplasmic materials, little is known regarding the role of autophagy in degrading nuclear components. Here we report that the autophagy machinery mediates degradation of nuclear lamina components in mammals. The autophagy protein LC3/Atg8, which is involved in autophagy membrane trafficking and substrate delivery4–6, is present in the nucleus and directly interacts with the nuclear lamina protein Lamin B1, and binds to lamin-associated domains (LADs) on chromatin. This LC3-Lamin B1 interaction does not downregulate Lamin B1 during starvation, but mediates its degradation upon oncogenic insults, such as by activated Ras. Lamin B1 degradation is achieved by nucleus-to-cytoplasm transport that delivers Lamin B1 to the lysosome. Inhibiting autophagy or the LC3-Lamin B1 interaction prevents activated Ras-induced Lamin B1 loss and attenuates oncogene-induced senescence in primary human cells. Our study suggests this new function of autophagy as a guarding mechanism protecting cells from tumorigenesis.
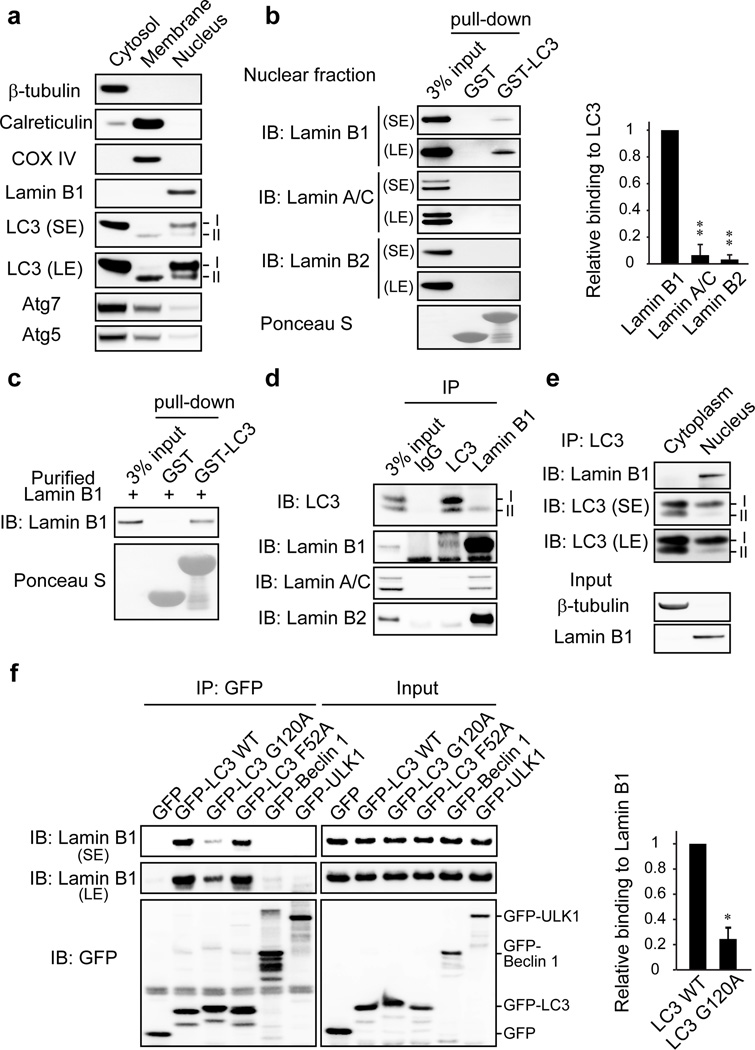
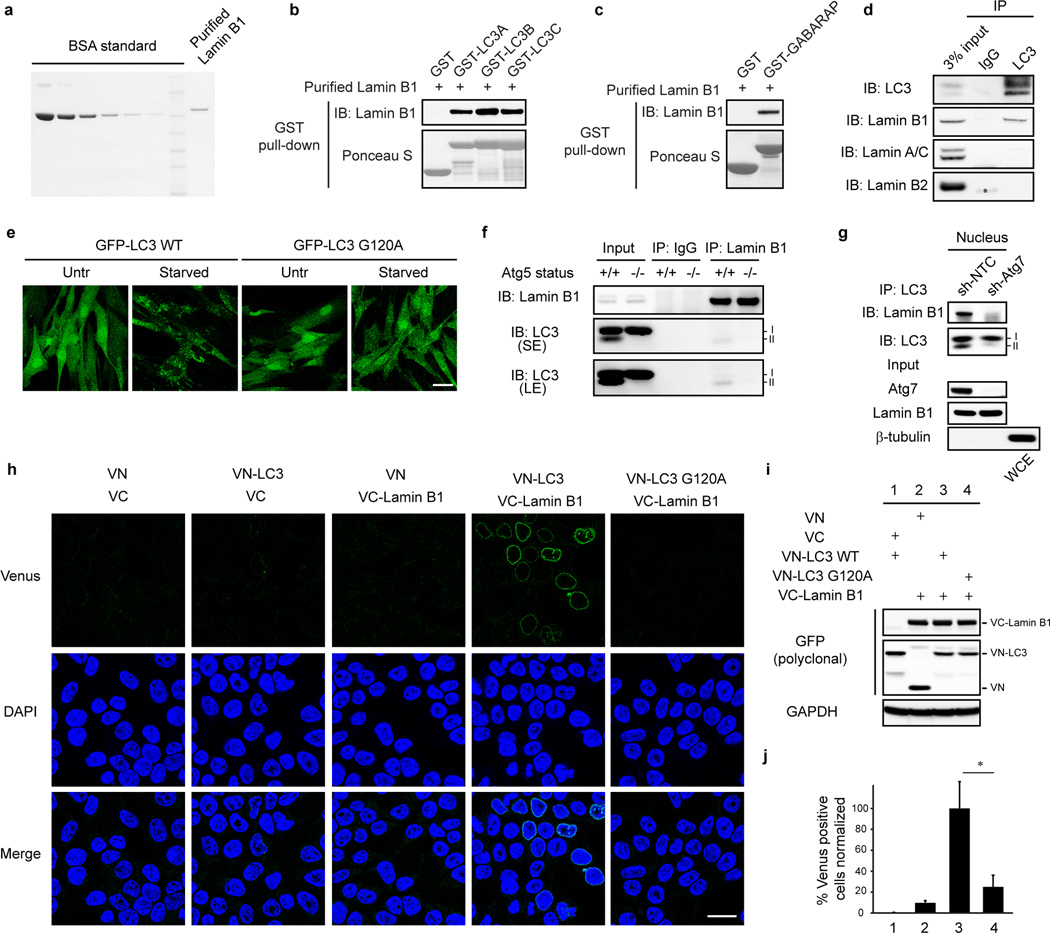
Several mammalian autophagy proteins are present in the nucleus, including LC37,8, Atg59, and Atg710. However, whether nuclear LC3 is involved in degrading nuclear components is not understood. We investigated LC3 distribution by subcellular fractionation of primary human IMR90 cells and found a substantial amount of endogenous LC3 and a small amount of lipidated LC3-II in the nucleus (Fig. 1a). We used bacterially purified GST-LC3B (hereafter “LC3”, unless specified otherwise) to pull down the nuclear fraction (Fig. 1b). One protein that we found to interact with LC3 is the nuclear lamina protein Lamin B1 (Fig. 1b). The nuclear lamina is a fibrillar network located beneath the nuclear envelope whose major components are the four nuclear lamin isoforms, Lamin B1, B2, and A/C, and their associated proteins11. Nuclear lamina provides the nucleus with mechanical strength and regulates higher order chromatin organization, modulating gene expression and silencing11. In contrast to Lamin B1, Lamins A/C and Lamin B2 bind poorly, if at all, to LC3 (Fig. 1b). We detected a direct interaction of purified Lamin B1 (Extended Data Fig. 1a) with LC3B (Fig. 1c) and other members of the Atg8 protein family, including LC3A, LC3C, and GABARAP (Extended Data Fig. 1b,c). Co-immunoprecipitation (co-IP) revealed that LC3-Lamin B1 interaction occurs at the endogenous level in the nucleus (Fig. 1d, e, and Extended Data Fig. 1d). Lipidated LC3-II is involved in mediating Lamin B1 interaction (Fig. 1d and Extended Data Fig. 1e–g), and the LC3 G120A lipidation deficient mutant showed impaired binding to Lamin B1 (Fig. 1f). A bimolecular fluorescence complementation (BiFC) assay12 showed that LC3-Lamin B1 interaction happens at the nuclear lamina and is dependent on LC3 lipidation (Extended Data Fig. 1h–j). Together, these data suggest that LC3 directly interacts with Lamin B1, and that LC3 lipidation facilitates this interaction, possibly by tethering LC3 to the inner nuclear membrane where the interaction with nuclear lamina occurs (see Fig. 5h (a)).
Figure 1. LC3 interacts with nuclear lamina protein Lamin B1.
a, Proliferating young IMR90 cells were subjected to subcellular fractionation and immunoblotting. SE: short-exposure; LE: long-exposure. b, The nuclear fraction of IMR90 was pulled down with bacterially purified GST or GST-LC3B. c, GST-LC3B pulldown of purified Lamin B1 protein. d, Endogenous IP (immuno-precipitation) in IMR90. e, LC3 IP of IMR90 fractions. f, HEK293T transfected were subjected to GFP IP and immunoblotting. Bars are the mean ± s.e.m.; n=3; * P<0.001. ** P<0.0001; one-way ANOVA coupled with Tukey’s post hoc test (b); unpaired two-tailed Student’s t-test (f). Uncropped blots are in Supplementary Figure.
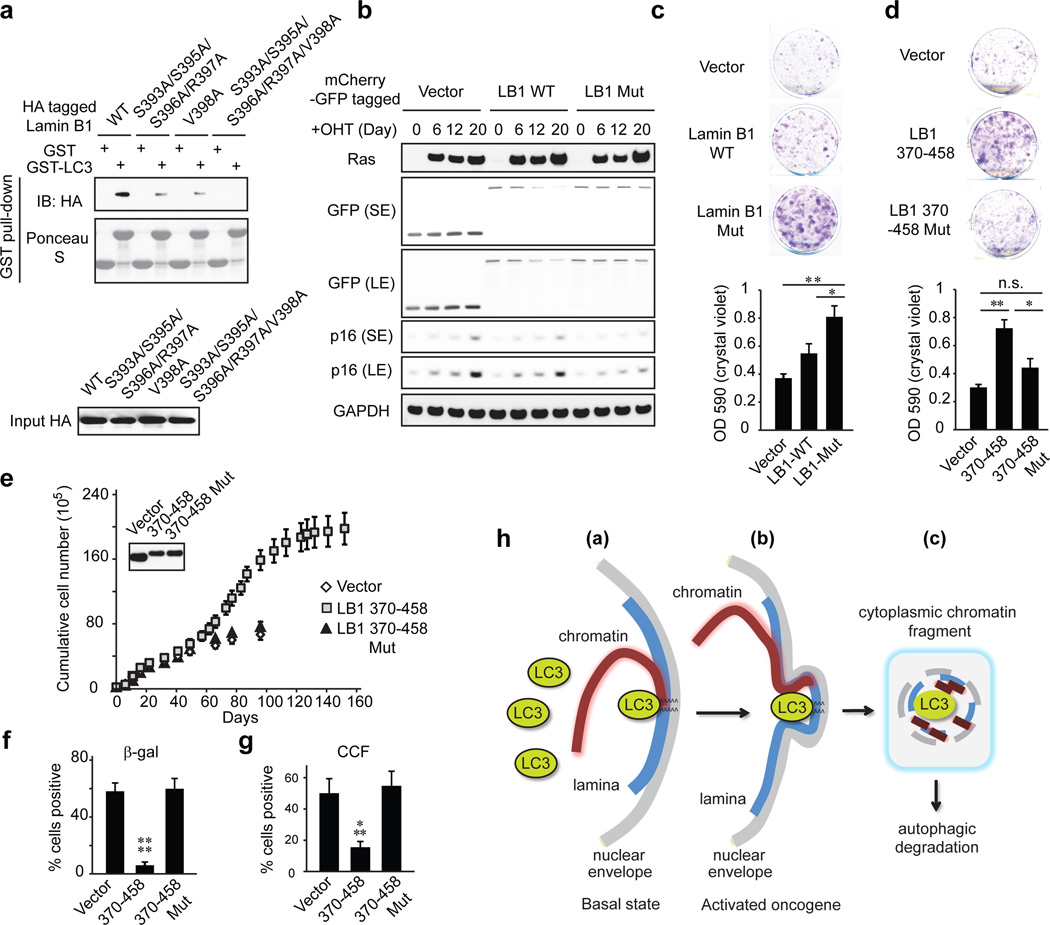
Figure 5. LC3-Lamin B1 interaction is required for Lamin B1 degradation and cellular senescence.
a, In vitro translated proteins were subjected to GST-LC3B pulldown. b, BJ ER:HRasV12 were analyzed by immunoblotting. Uncropped blots are in Supplementary Figure. c, d, Colony formation analysis of BJ ER:HRasV12. e, Mid-life BJ stably expressing mCherry-GFP-tagged constructs were recorded for growth. Uncropped blots are in Supplementary Figure. f, Day 60, quantified for β-gal positivity. g, Day 101, quantified for cytoplasmic DAPI. Bars are the mean ± s.e.m. (c and d), s.d. (f and g); n=3 (c and d), n=4 (f and g); * P<0.05, ** P<0.01, *** P<0.001, **** P<0.0001; n.s., non-significant; one-way ANOVA coupled with Tukey’s post hoc test. h, Schematic illustration of autophagy degradation of nuclear lamina.
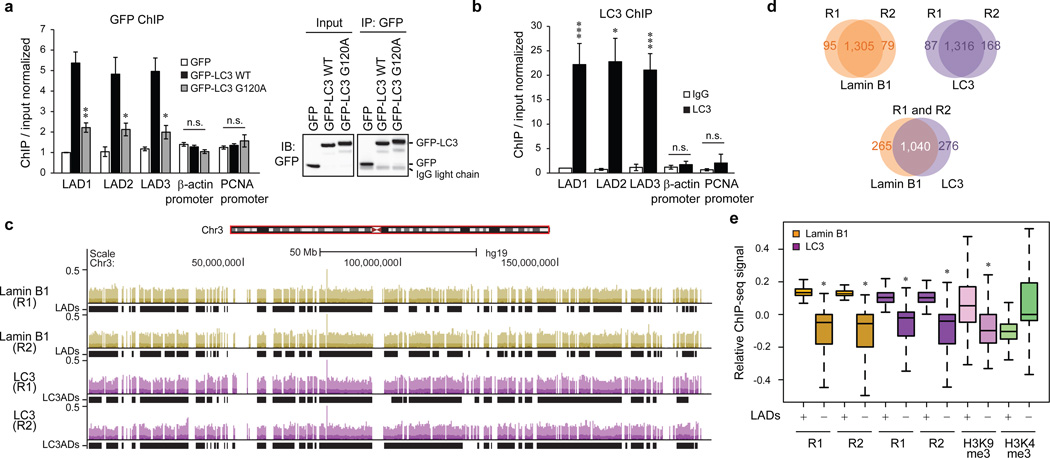
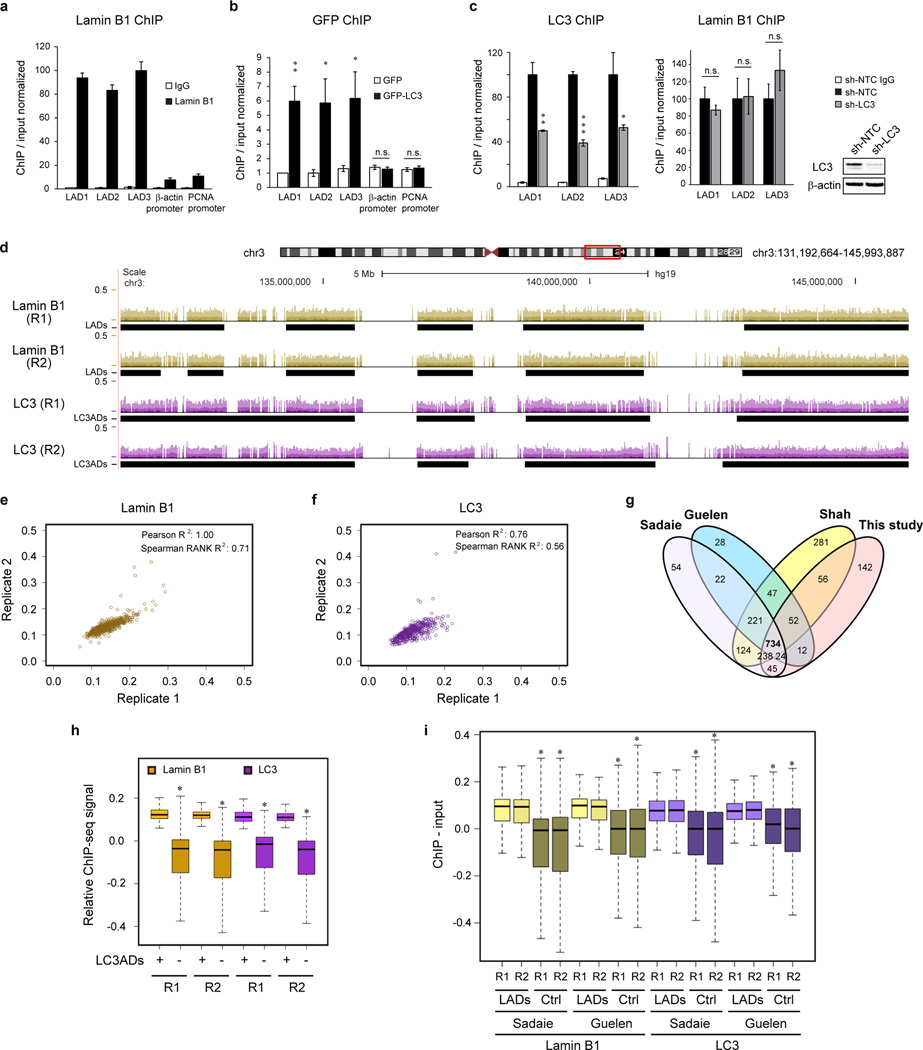
Lamin B1 associates with transcriptionally inactive heterochromatin domains called LADs11,13. We used chromatin immunoprecipitation (ChIP) to investigate the association of LC3 with LADs. ChIP of LC3 showed that in its lipidated form, LC3 associates with LADs but poorly with euchromatin regions, such as β-actin and PCNA promoters, similarly to that of Lamin B1 (Fig. 2a, b and Extended Data Fig. 2a–c). We then performed endogenous Lamin B1 and LC3 ChIP followed by genome-wide sequencing (ChIP-seq), done in two independent biological replicates, R1 and R2 (Fig. 2c for whole chromosome 3 and a zoom-in window in Extended Data Fig. 2d). We used enriched domain detector (EDD), an algorithm which detects wide enrichment domains14 to define LADs and LC3-associated domains (LC3ADs) (Fig. 2c and Extended Data Fig. 2d, black rectangles beneath the tracks). Analyses of Lamin B1 and LC3 ChIP-seq revealed high reproducibility between R1 and R2 over LADs and LC3ADs (Fig. 2d, top two panels, and Extended Data Fig. 2e, f); LADs defined here correlate well with previously identified LADs from Lamin B1 ChIP-seq15,16 and DamID13 (Extended Data Fig. 2g). We further found that LADs and LC3ADs significantly overlap (Fig. 2d, bottom panel, permutation test P < 0.001, 1000 iterations). Comparing LADs to an equal number of size-matched and randomly selected non-LADs control regions, we observed that both Lamin B1 and LC3 are strongly enriched in LADs, for both replicates (Fig. 2e, permutation test for LC3: P < 0.01, 100 iterations, for both replicates). A similar enrichment is also detected over LC3ADs (Extended Data Fig. 2h). As expected, Lys9 trimethylation on histone H3 (H3K9me3) is highly enriched in LADs (Fig. 2e, permutation test P < 0.01, 100 iterations), whereas H3K4me3 is relatively depleted (Fig. 2e, permutation test P = 1, 100 iterations). We also found that both Lamin B1 and LC3 from our ChIP-seq are strongly enriched in LADs mapped by other published studies13,15 relative to non-LADs control regions (Extended Data Fig. 2i), in line with our findings from Fig. 2e. Collectively, these results indicate that LC3 associates with LADs on chromatin at the genome-wide scale (see Fig. 5h (a)).
Figure 2. LC3 associates with LADs on chromatin.
a, IMR90 stably expressing GFP-tagged constructs were subjected to GFP ChIP-qPCR. Uncropped blots are in Supplementary Figure. b, LC3 ChIP-qPCR. Bars are the mean ± s.e.m.; n=3; * P<0.05, ** P<0.01, *** P<0.005; n.s., non-significant; unpaired two-tailed Student’s t-test. c–e, ChIP-sequencing analyses in proliferating IMR90. c, Representative tracks over the whole chromosome 3, for both replicates. d, Overlap of LADs and LC3ADs between two replicates and Lamin B1 and LC3. e, ChIP-seq enrichment over LADs (+) and randomly selected non-LADs control regions (−). One-sided Wilcoxon test; * P<2.2×10⁻¹⁶, P=1 for H3K4me3.
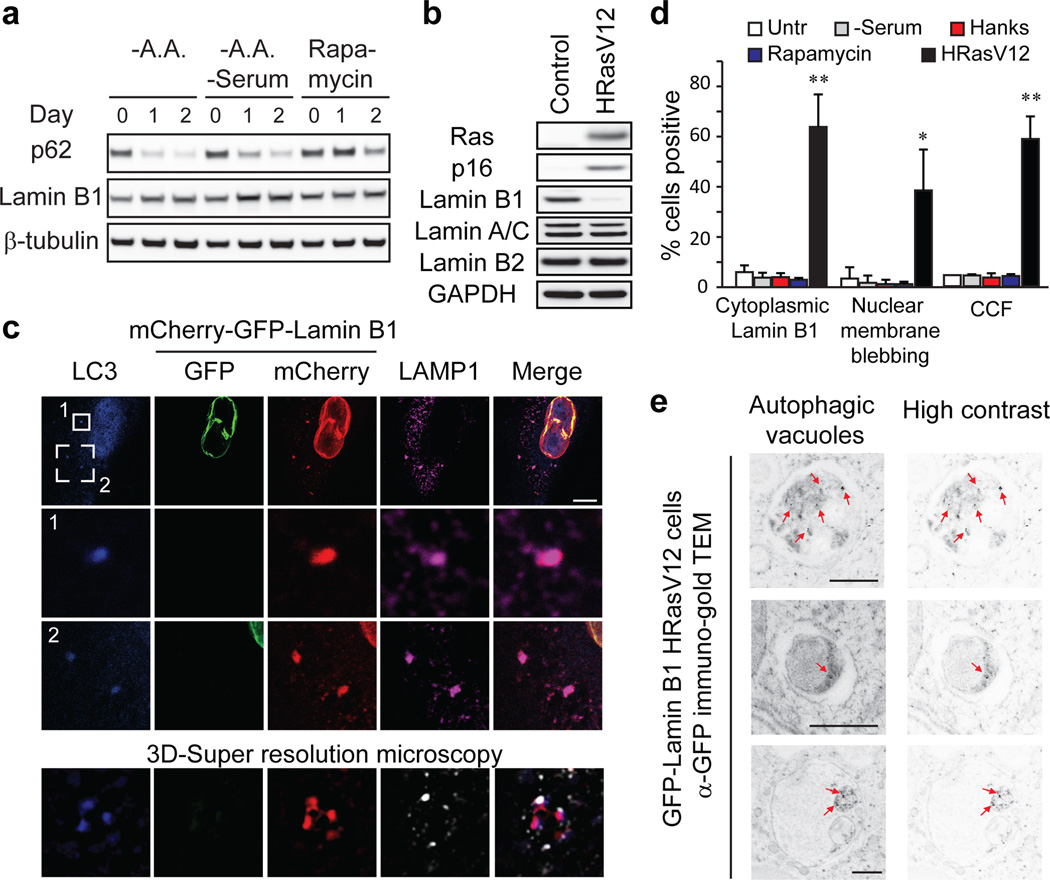
Next, we examined the biological functions of this interaction, and found that neither starvation nor rapamycin treatment downregulates Lamin B1 protein (Fig. 3a), suggesting that autophagy does not degrade Lamin B1 during starvation. One scenario that involves Lamin B1 loss is oncogenic insult, such as induced by oncogenic Ras17–19. In fact, most primary cells and tissues cope with oncogenic Ras activity by inducing cellular senescence, a stable cell cycle arrest that serves as a potent tumor suppressive mechanism20,21. We and others have shown that Lamin B1, but not Lamins A/C or B2, is dramatically downregulated during oncogene-induced senescence (OIS)17–19. Importantly, autophagy is upregulated during OIS, and is required for the mitosis-to-senescence transition22,23. We thus hypothesized that activated oncogenes trigger autophagic degradation of Lamin B1 in primary human cells.
Figure 3. Lamin B1 is an autophagy substrate in response to oncogene activation.
a, b, Primary IMR90 were treated as indicated and subjected to immunoblotting. A.A.: amino acids. Uncropped blots are in Supplementary Figure. c, IMR90 stably expressing mCherry-GFP-Lamin B1 and HRasV12 were stained with LC3 and LAMP1 antibodies, and analyzed by confocal or 3D-super resolution microscopy. Scale bar: 10 µm. d, mCherry-GFP-Lamin B1 IMR90 were treated as indicated. Bars are the mean ± s.d.; n=4; * P<0.01, ** P<0.001; one-way ANOVA coupled with Tukey’s post hoc test. e, Immuno-TEM analysis of IMR90 stably expressing GFP-Lamin B1 and HRasV12. Gold nanoparticles are indicated by arrows, and are highlighted on right.
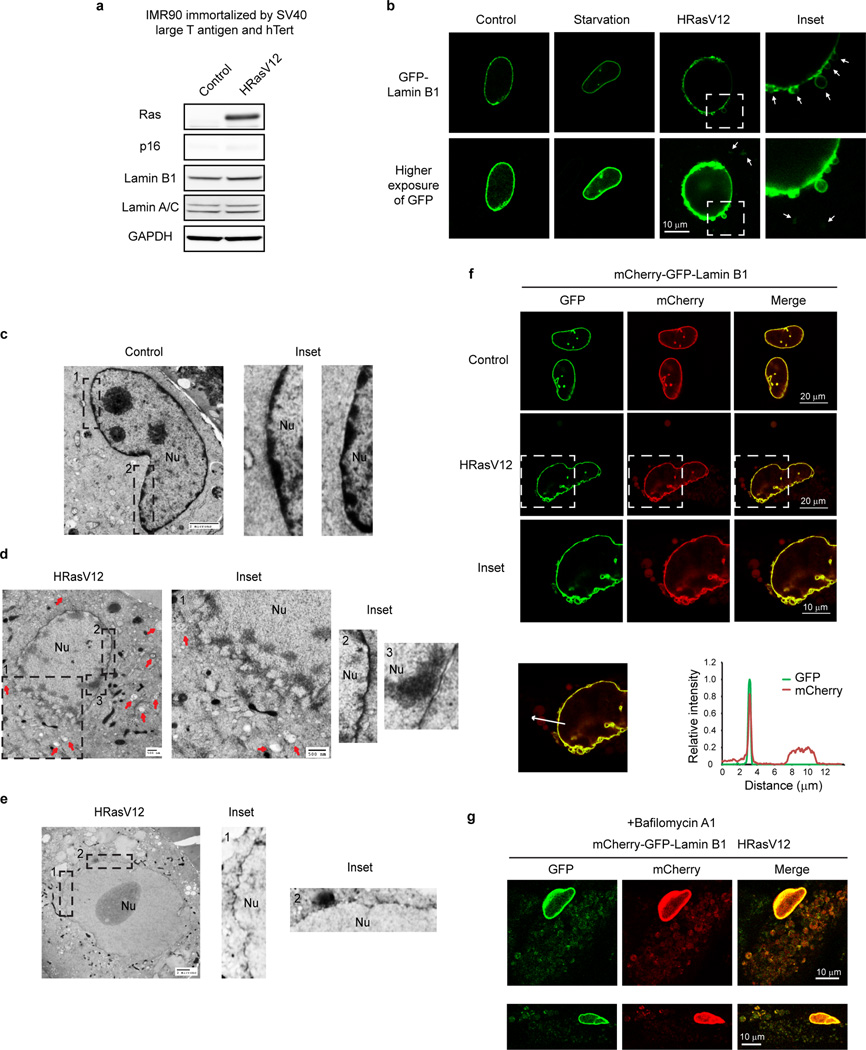
Consistent with previous findings17,18, primary, but not immortalized, human cells show downregulation of Lamin B1 but not other lamin isoforms (Fig. 3b and Extended Data Fig. 3a). While starvation does not alter Lamin B1 nuclear lamina localization, HRasV12 expression induces nuclear membrane blebbing and cytoplasmic Lamin B1 signals (Extended Data Fig. 3b). Transmission electron microscopy (TEM) analysis of HRasV12-expressing cells confirmed the induction of autophagosomes, reduction of perinuclear heterochromatin, and induction of nuclear membrane blebs (Extended Data Fig. 3c–e). Unlike yeast piecemeal microautophagy, in which nuclear blebs directly contact cytoplasmic autophagic vacuoles24, the nuclear blebs in human senescent cells are morphologically distinct and do not directly contact these vacuoles (Extended Data Fig. 3c–e).
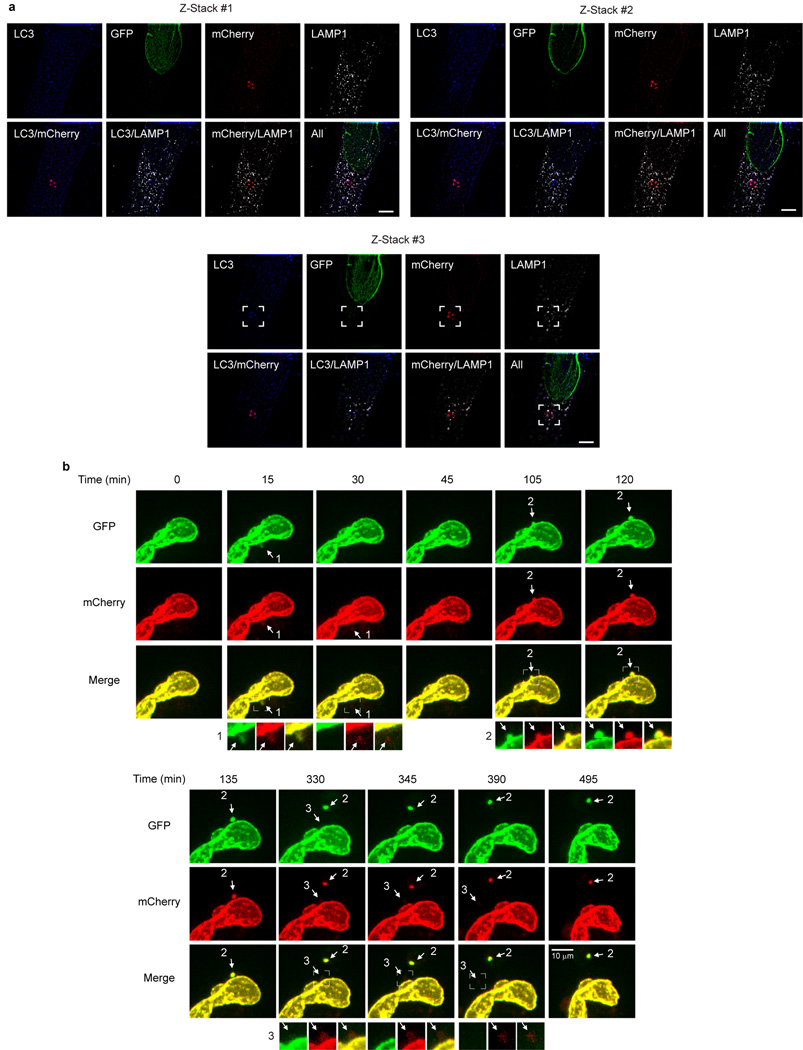
We further used an mCherry-GFP-Lamin B1 construct to investigate the hypothesis that Lamin B1 is degraded by autophagy-lysosome pathway. Here, a yellow signal (due to merged mCherry and GFP) indicates that the fusion protein is in a neutral pH environment, whereas a red signal (due to quenching of GFP) indicates that the protein has entered acidic lysosomes25,26. mCherry-GFP-Lamin B1 showed a merged yellow nuclear peripheral pattern in control cells, but displayed cytoplasmic red-only bodies in HRasV12-expressing cells (Extended Data Fig. 3f). Inhibiting lysosomal acidification by bafilomycin A1 prevents GFP quenching and results in merged yellow signals in the cytoplasm (Extended Data Fig. 3g). Furthermore, we co-stained with antibodies against LC3 and LAMP1, and found that the cytoplasmic mCherry-only Lamin B1 bodies stain positively for endogenous LC3 and LAMP1 (Fig. 3c). Super-resolution microscopy analysis revealed that the cytoplasmic Lamin B1 and LC3 colocalizes within the LAMP1-decorated vesicle (Fig. 3c and Extended Data Fig. 4a). Cytoplasmic Lamin B1 and nuclear membrane blebs are specifically induced by HRasV12, but not by starvation or rapamycin treatment (Fig. 3d). In addition, we performed live-cell imaging on mCherry-GFP-Lamin B1 expressing HRasV12 IMR90 cells, and confirmed a nucleus-to-cytoplasm transport process, through nuclear membrane blebbing, which then leads to Lamin B1 degradation in the cytoplasm (Extended Data Fig. 4b).
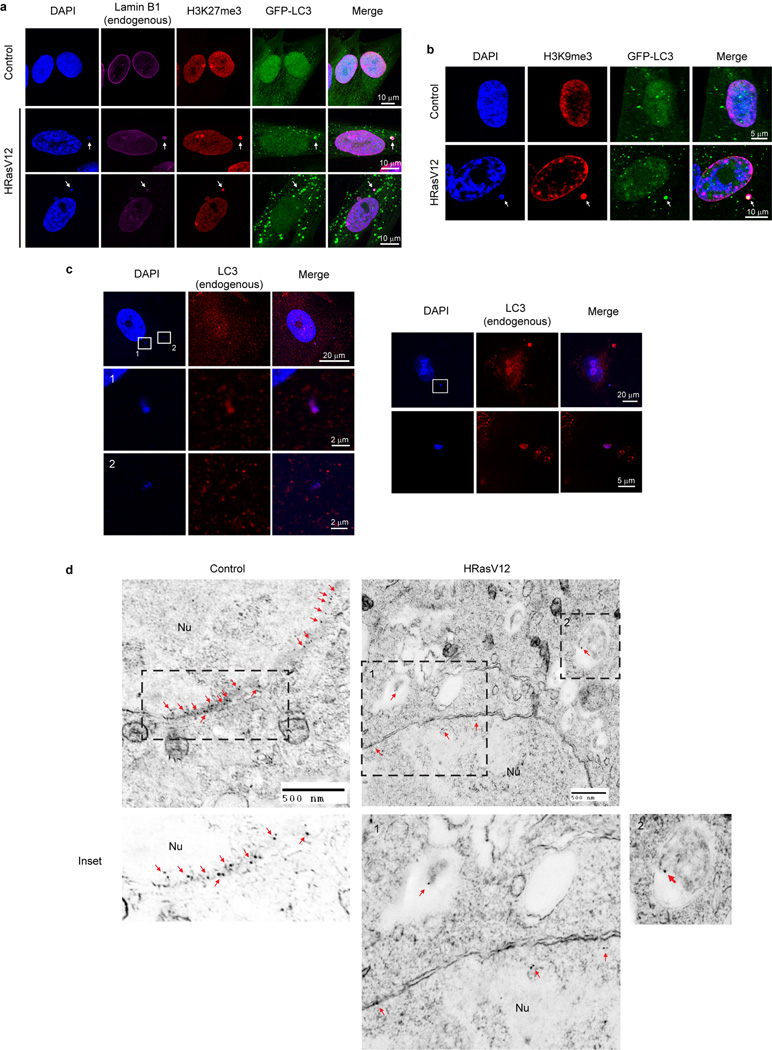
Cytoplasmic Lamin B1 in HRasV12 cells is reminiscent of the cytoplasmic chromatin fragments (CCF) that we previously described in senescent cells, which are fragments of heterochromatin budded off from the nuclei19. Consistent with the behavior of Lamin B1, we found cytoplasmic DAPI specifically appearing in response to HRasV12 (Fig. 3d). The cytoplasmic DAPI staining bodies stain positive for H3K27me3 and H3K9me3, and colocalize with LC3 and Lamin B1 (Extended Data Fig. 5a–c). Immuno-TEM analysis revealed that Lamin B1 specifically localizes at the nuclear lamina in control cells (Extended Data Fig. 5d, left), whereas HRasV12-expressing cells showed decreased presence of Lamin B1 at the nuclear lamina, and the appearance inside autophagosomes and autolysosomes (Fig. 3e and Extended Data Fig. 5d, right). Taken together, these data indicate that Lamin B1 is an autophagy substrate upon oncogenic insult, which, through a nucleus-to-cytoplasm transport process, leads to its autophagic degradation in the cytoplasm, as depicted in Fig. 5h (b, c).
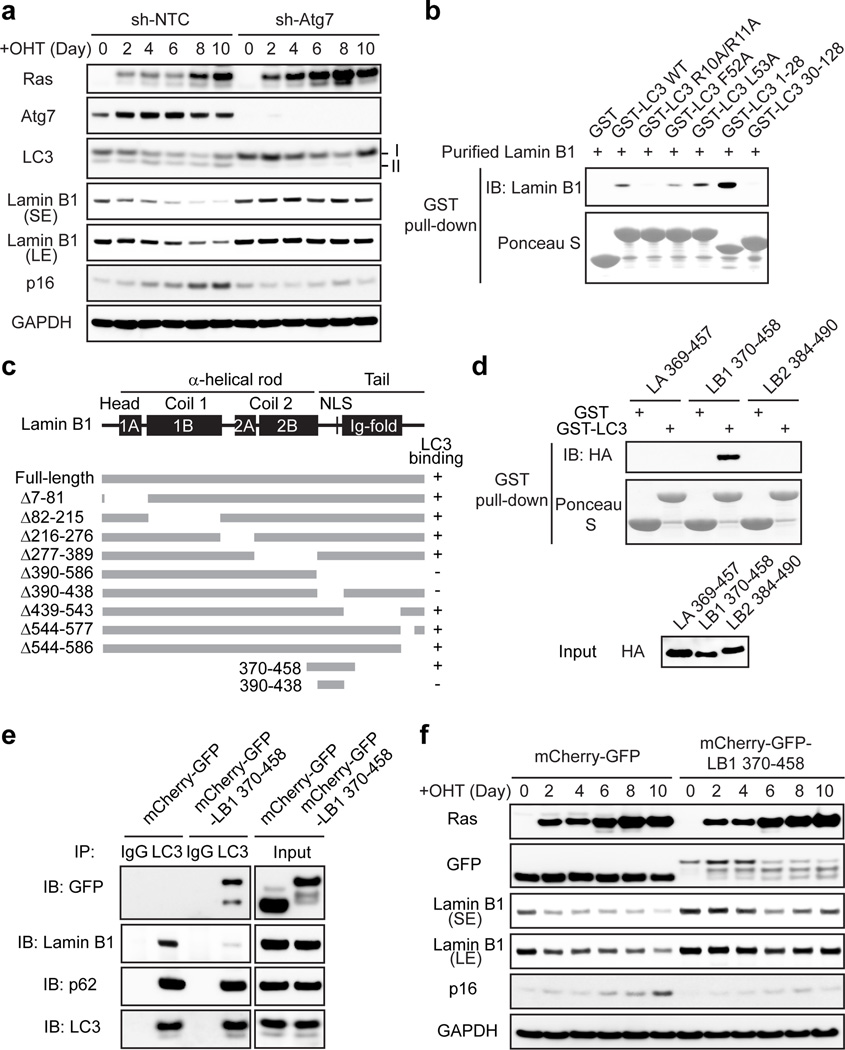
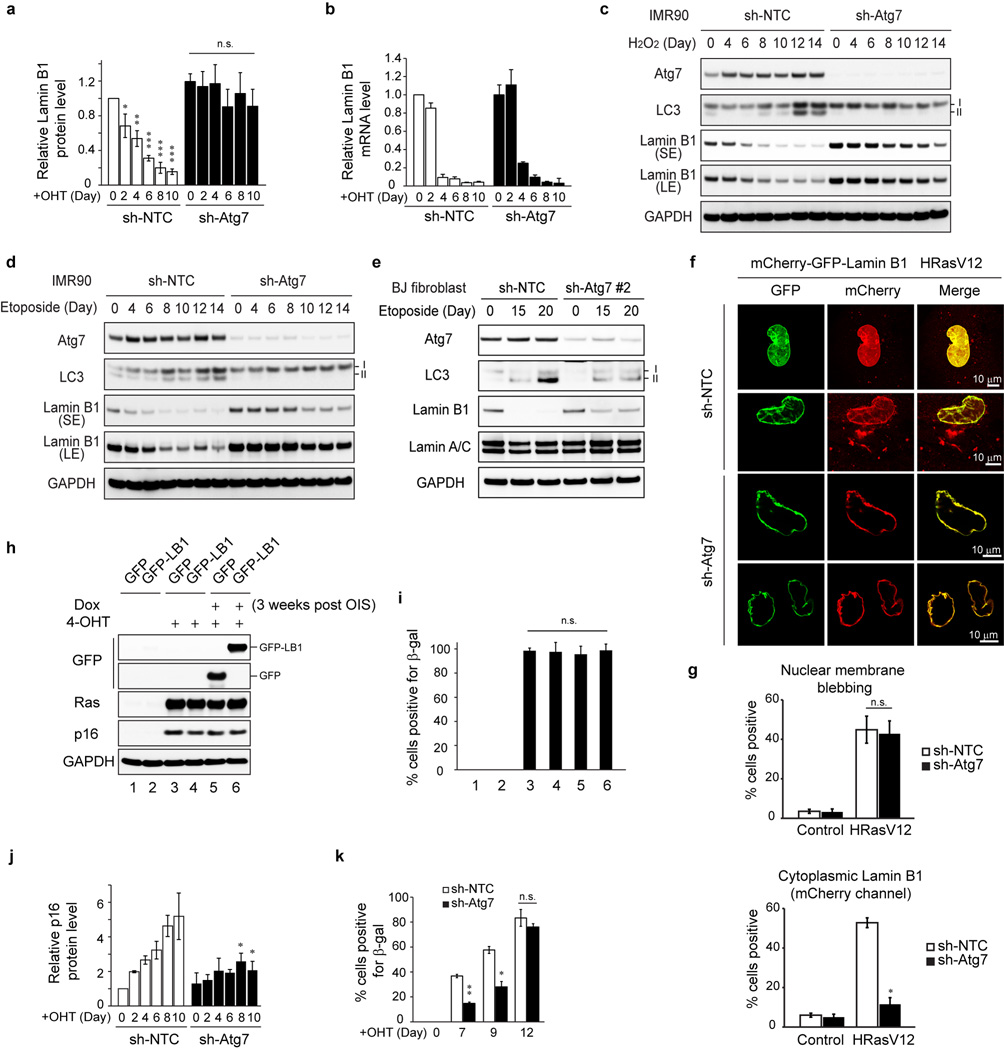
We subsequently investigated the consequence of autophagy inhibition. Knockdown of Atg7 impairs the downregulation of Lamin B1 protein in HRasV12 cells (Fig. 4a and Extended Data Fig. 6a). Lamin B1 mRNA has been shown to decrease upon HRasV12 expression17,18. Here the mRNA of Lamin B1 is reduced in both control and Atg7 knockdown cells (Extended Data Fig. 6b), whereas the protein level of Lamin B1 is maintained in Atg7 deficient cells (Fig. 4a). These data suggest that Lamin B1 is downregulated at both mRNA and protein levels, and are consistent with the observation that nuclear lamins are among the most long-lived proteins in cells27. Besides Ras-induced senescence, we found that Atg7 inhibition also attenuates Lamin B1 loss triggered by oxidative stress and DNA damage-induced senescence (Extended Data Fig. 6c–e). Further, mCherry-GFP-Lamin B1 expressed in Atg7 knockdown HRasV12 cells displayed normal induction of nuclear membrane blebs but deficient cytoplasmic mCherry signals (Extended Data Fig. 6f, g). These data suggest that inhibition of autophagy leads to a profound defect in the nucleus-to-cytoplasm transport of Lamin B1.
Figure 4. Inhibiting autophagy or the LC3-Lamin B1 interaction impairs Lamin B1 degradation.
a, ER:HRasV12 IMR90 stably expressing non-targeting control (sh-NTC) or sh-Atg7 hairpin were induced by OHT (4-hydroxytamoxifen) and analyzed by immunoblotting. b, Purified Lamin B1 protein was subjected to pull-down of GST-LC3B wild-type (WT) or mutants. c, Schematic illustration of Lamin B1 mutants in binding to LC3. d, Regions from Lamin A, B1, and B2 were subjected to GST-LC3B pulldown. e, HEK293T transfected were subjected to LC3 IP. f, ER:HRasV12 IMR90 were induced by OHT and analyzed by immunoblotting. Uncropped blots are in Supplementary Figure.
Lamin B1 plays an important role in cell proliferation and senescence17. Forced knockdown of Lamin B1 causes premature senescence16,17, while overexpression of Lamin B1 delays senescence17. Restoration of Lamin B1 in already-established senescent cells is not sufficient to revert senescence in vitro (Extended Data Fig. 6h, i). Consistent with the compromised Lamin B1 degradation, we found that Atg7 knockdown cells showed delayed HRasV12-induced senescence, as judged by reduced levels of p16 (Fig. 4a and Extended Data Fig. 6j) and delayed induction of senescence-associated beta-galactosidase (β-gal) (Extended Data Fig. 6k).
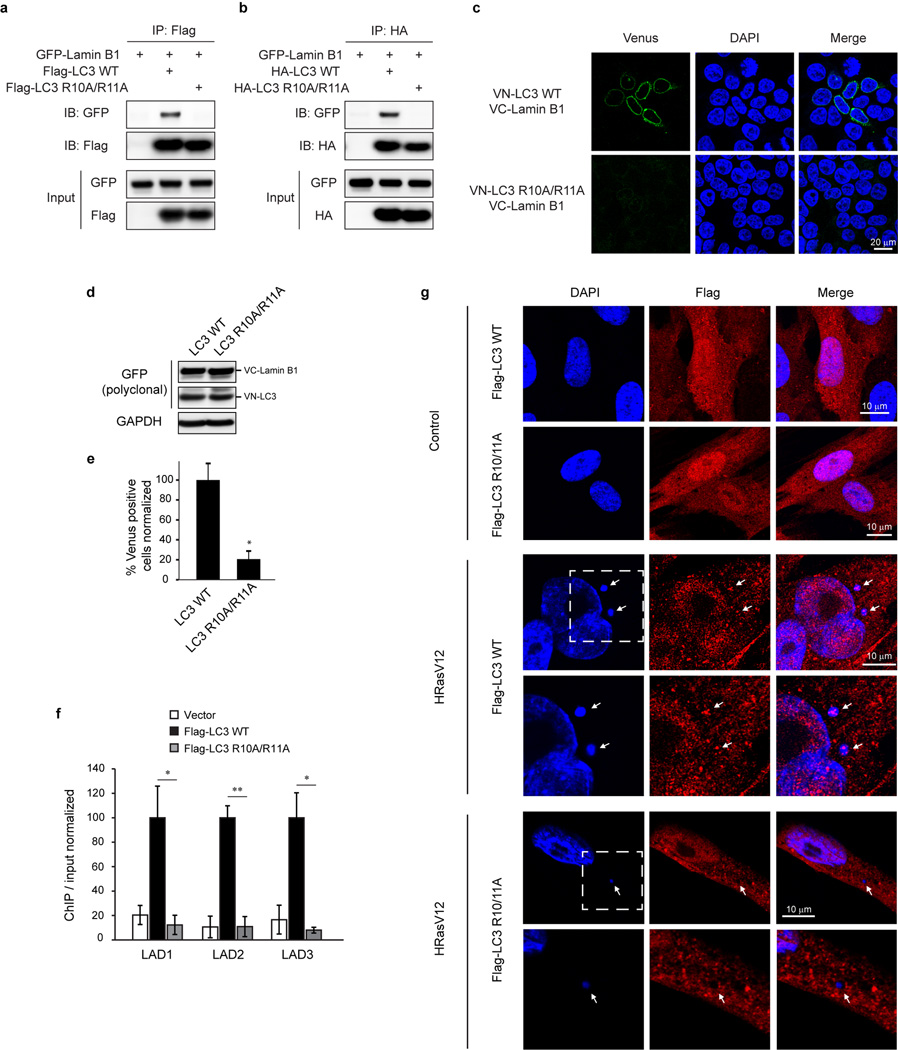
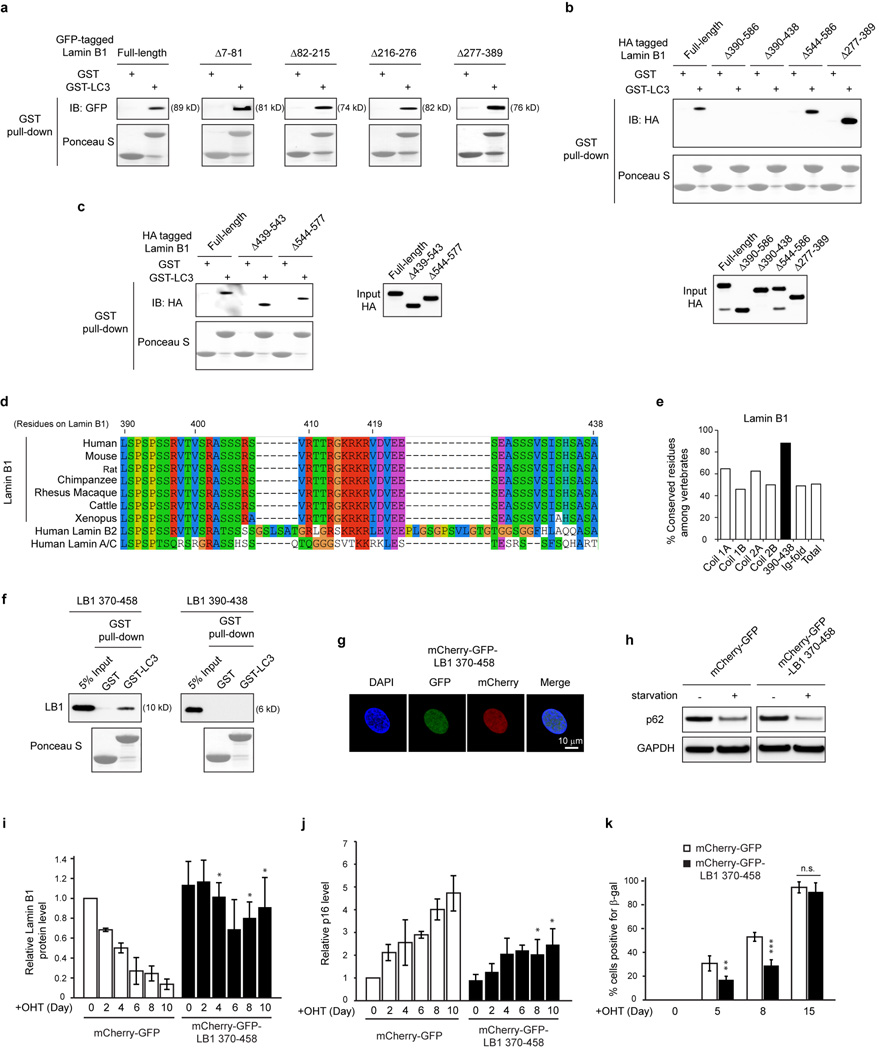
We mapped the LC3-Lamin B1 interaction and discovered that LC3 R10 and R11 are essential for Lamin B1 binding, from in vitro pull-down, in vivo co-IP, BiFC, and ChIP experiments (Fig. 4b and Extended Data Fig. 7a–f). Moreover, while LC3-WT showed colocalization with CCF, the LC3 mutant failed to do so (Extended Data Fig. 7g). On the Lamin B1 end, the region between Coil 2 and the Ig-fold of Lamin B1 is necessary for LC3 binding (Fig. 4c and Extended Data Fig. 8a–c). Notably, this region (390–438) is the most evolutionarily conserved domain among all vertebrate Lamin B1 (Extended Data Fig. 8d, e). The region along with 20 amino-acid flanking sequence at the N- and C-termini (resulting in the fragment 370–458) is sufficient to bind LC3 (Fig. 4c, d, and Extended Data Fig. 8f), while the homologous regions on other lamins fail to bind LC3 (Fig. 4d). Examination of the amino-acid sequences revealed that Lamins A/C harbor several distinct residues compared to Lamin B1, and that Lamin B2 has two insertions in the region (Extended Data Fig. 8d), which possibly alters the proper peptide folding for LC3 interaction.
The 370–458 region of Lamin B1 contains its nuclear localization signal (NLS) (Fig. 4c), hence the fragment localizes to the nucleus (Extended Data Fig. 8g), and is able to interact with endogenous LC3 (Fig. 4e). Overexpression of this fragment decreases endogenous LC3-Lamin B1 interaction, but does not affect LC3 lipidation, LC3 binding to p62 (Fig. 4e), or p62 degradation upon starvation (Extended Data Fig. 8h). When expressed in HRasV12 cells, the fragment impairs Lamin B1 downregulation, accompanied by an attenuated senescence (Fig. 4f and Extended Data Fig. 8i–k).
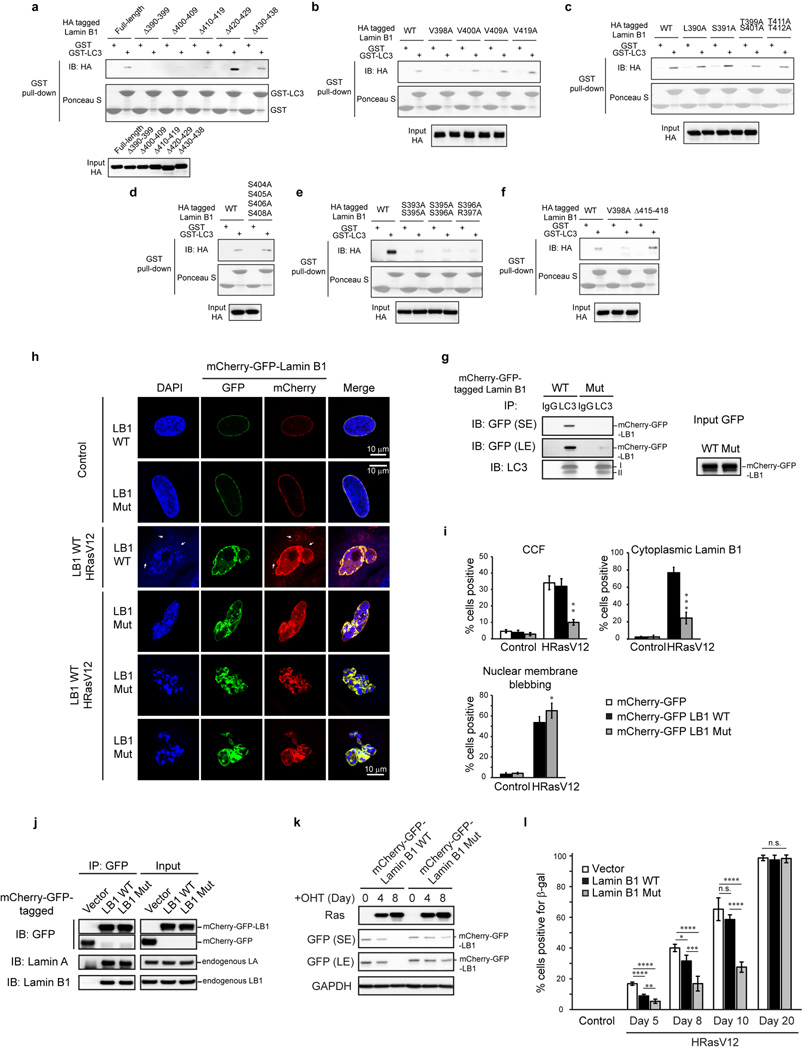
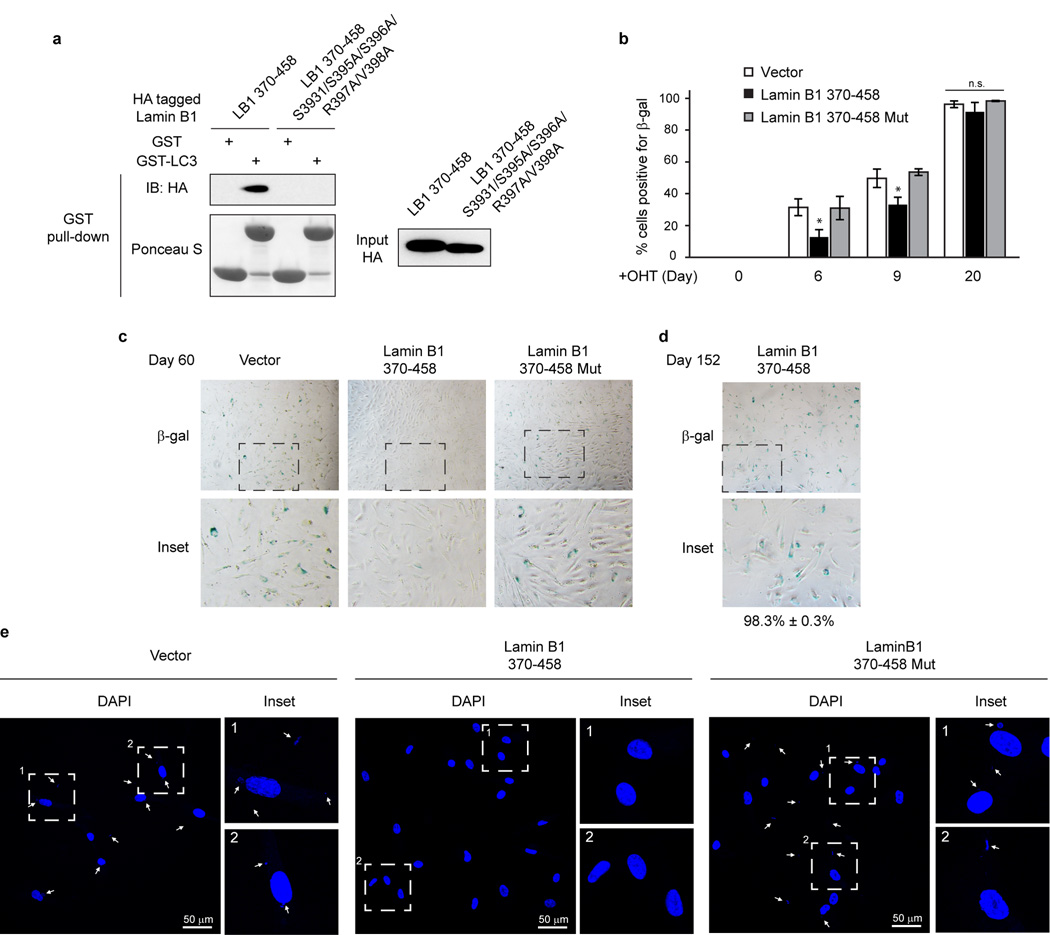
We further identified the essential residues within Lamin B1 for binding to LC3, and found that simultaneously substituting the residues S393, S395, S396, R397, and V398 to alanine abrogates the interaction with LC3 (Fig. 5a and Extended Data Fig. 9a–g). In control cells, this Lamin B1 substitution mutant shows a normal nuclear peripheral pattern (Extended Data Fig. 9h), and is able to interact with endogenous Lamin A and Lamin B1 (Extended Data Fig. 9j). However, in HRasV12 cells, the mutant showed attenuated protein downregulation compared to WT Lamin B1 (Fig. 5b and Extended Data Fig. 9k), and dramatically reduced cytoplasmic Lamin B1 signals (Extended Data Fig. 9h, i), indicating that the mutant has a profound deficiency in nucleus-to-cytoplasm transport. Consequently, the Lamin B1 mutant-expressing cells delayed HRasV12-induced senescence with a higher efficiency than WT Lamin B1 (Fig. 5b and Extended Data Fig. 9l), and significantly promoted the growth of colonies in colony formation analysis (Fig. 5c). Furthermore, we employed our Lamin B1 370–458 peptide that blocks the LC3-Lamin B1 interaction and inhibits senescence (Fig. 4e, f). Introducing point mutations as mapped above (Fig. 5a) abrogates the peptide association with LC3 (Extended Data Fig. 10a). While the 370–458 peptide delayed cellular senescence induced by HRasV12, the 370–458-Mut failed to do so (Fig. 5d and Extended Data Fig. 10b). Besides oncogene-induced senescence, the peptide also significantly delayed replicative senescence and the appearance of CCF (Fig. 5e–g and Extended Data Fig. 10c–e). Taken together, these data indicate that the LC3-Lamin B1 interaction plays an essential role in reinforcing cellular senescence, which both suppresses oncogene activity and limits cellular lifespan.
In this study, we discovered that Lamin B1 as a selective mammalian autophagy substrate upon oncogenic and genotoxic insults (illustrated in Fig. 5h). Recently, starvation-induced nuclear autophagy was discovered in yeast28, which is devoid of nuclear lamina and malignancies. In contrast, we show that mammalian Lamin B1 degradation does not occur during starvation. Recent studies reveal that downregulation of Lamin B1 impairs cell proliferation and DNA repair16,17,29,30, and leads to large scale alterations in chromatin16. These dramatic changes are unlikely to happen during starvation, but are likely beneficial in restraining oncogenic and tumorigenic insults. Our study suggests that LC3-Lamin B1 interaction occurs in the basal cellular state, and, upon aberrant cellular activities, initiates Lamin B1 degradation (Fig. 5h) thus driving senescence to restrain cell proliferation. Hence, selective nuclear lamina degradation by autophagy may play a role in restricting tumorigenesis and maintaining cell and tissue integrity.
While our current work focuses on Lamin B1, we anticipate that other nuclear substrates of autophagy have roles in tumor suppression and other physiological/pathological scenarios. This study establishes a new perspective in understanding mammalian autophagy - from the nucleus.
Methods
Data reporting
No statistical methods were used to predetermine sample size. The experiments were not randomized. The investigators were not blinded to allocation during experiments and outcome assessment.
Cell lines and culture
IMR90, MEFs, HEK293T were described previously16,31. Primary BJ fibroblasts were purchased from ATCC. Cell line identities were not further authenticated. The cells were cultured in DMEM supplemented with 10% fetal bovine serum (FBS), 100 units/ml penicillin, and 100 µg/ml streptomycin (Invitrogen), and were intermittently tested for mycoplasma. IMR90 and BJ were cultured under physiological oxygen (3%), except for the H2O2 treatment, in which cells were cultured in 20% oxygen incubator, and the experiments involved in live-cell imaging. For primary cell cultures, cells were briefly washed with PBS, trypsinized at 37°C for 2–4 min, and passaged at no more than 1:4 dilutions. Cells were counted with Countess automated cell counter (Life Technologies), and the numbers were recorded where growth curves are generated. HEK293T were transfected using Lipofectamine 2000 (Invitrogen). For amino acid starvation, cells were incubated in Hank’s buffer (with calcium and glucose) supplemented with 10% dialyzed FBS and 1% HEPES (Invitrogen). For amino acid and serum deprivation, cells were cultured in Hank’s buffer plus 1% HEPES.
Retrovirus and lentivirus infection
Stable cell lines were made by retrovirus or lentivirus infection, as previously described31, with slight modifications. Retroviral constructs were transfected to phoenix packaging cell line. Lentiviral pLKO constructs were transfected with packaging plasmids to HEK293T cells. Viral supernatant was filtered through a 0.45-µm filter, and supplemented with 8 µg/ml polybrene, and mixed with trypsinized recipient cells. pLNCX-ER:HRasV12, WZL-hygro, WZL-HRasV12-hygro viral constructs were described elsewhere. sh-Atg7 hairpin sequence GGAGTCACAGCTCTTCCTTAC was from Young et al22, and cloned into Tet-pLKO-puro “all-in-one” tetracycline-inducible vector32. Doxycyclin 100 ng/ml was added to IMR90 to induce knockdown of Atg7. Another pLKO-shAtg7 construct (TRCN0000007587) was purchased from Sigma-Aldrich, and used in BJ fibroblasts. The infected cells were selected with puromycin, neomycin, or hygromycin for ~ 1 week.
Reagents and antibodies
Rapamycin was purchased from Millipore. H2O2 was from Fisher Scientific. 4-hydroxytamoxifen and etoposide was from Sigma-Aldrich. The following antibodies are used: LC3 (MBL #PM036 for WB of MEFs; Cell Signaling Technology #3868 for IP, ChIP, IF, WB; Cell Signaling Technology #2775 for WB), β-tubulin (Sigma-Aldrich #T4026), calreticulin (Cell Signaling Technology #12238), COX IV (Cell Signaling Technology #4850), Atg5 (Cell Signaling Technology #8540), Atg7 (Cell Signaling Technology #8558), Lamin B1 (Abcam #ab16048), Lamin B2 (Abcam #ab8983), Lamins A/C (Millipore #MAB3211), GFP (Roche #11 814 460 001 and Abcam #ab290), p62 (Abnova #H00008878-M01), GAPDH (Fitzgerald Industries #10R-G109A), p16 (Abcam # ab16123), Ras (Millipore #05-516), HA (Sigma-Aldrich #H3663), H3K27me3 (Active Motif # 39538), H3K9me3 (Abcam #ab8898), LAMP1 (Iowa Hybridoma Bank #H4a3-s), and Flag (Sigma-Aldrich #F1804).
Plasmids
GST, GST-LC3A, B, C, and GST-LC3B mutants/truncations were described elsewhere33. GFP, HA/Flag/GFP-LC3 WT and mutants, GFP-Beclin 1, GFP-ULK1, GFP-Lamin B1, and split Venus constructs were described previously17,31,34,35. pBabe-mCherry-GFP-LC336 was purchased from Addgene, and LC3 was truncated to make pBabe-mCherry-GFP, and then Lamin B1 sequences were cloned. Lamin B1 truncations/mutations were made from pEGFP-Lamin B1 for direct transfection, pBabe-mCherry-GFP-Lamin B1 for retrovirus, or pT7-NHA-Lamin B1 for in vitro translation. Tet-inducible lentiviral GFP-Lamin B1 was made by cloning the GFP-Lamin B1 fragment into pTRIPZ. All new constructs in this study were verified by DNA sequencing.
Western blotting
Cells were lysed in buffer containing 50 mM Tris pH 7.5, 0.5 mM EDTA, 150 mM NaCl, 1% NP40, 1% SDS, supplemented with 1:100 Halt Protease inhibitor cocktail (Thermo Scientific). The lysates were briefly sonicated, and supernatants were subjected to electrophoresis using NuPAGE Bis-Tris precast gels (Life Technologies). After transferring to nitrocellulose membrane, 5% milk in TBS supplemented with 0.1% Tween 20 (TBST) was used to block the membrane at room temperature for 1 h. Primary antibodies were diluted in 5% BSA in TBST, and incubated at 4°C overnight. The membrane was washed 3 times with TBST, each for 10 min, followed by incubation of HRP-conjugated secondary antibodies at room temperature for 1 h, in 5% milk/TBST. The membrane was washed again 3 times, and imaged by the Fujifilm LAS-4000 imager.
Immunoprecipitation
Cells were lysed in IP buffer containing 20 mM Tris, pH 7.5, 137 mM NaCl, 1 mM MgCl2, 1 mM CaCl2, 1% NP-40, 10% glycerol, supplemented with 1:100 Halt protease and phosphatase inhibitor cocktail (Thermo Scientific) and benzonase (Novagen) at 12.5 U/ml. Benzonase is essential to release chromatin-bound proteins to supernatant, and MgCl2 is critical for its activity. The lysates were rotated at 4°C for 30–60 min. The supernatant was incubated with antibody-conjugated Dynabeads (Life Technologies), and rotated at 4°C overnight. The IP was washed and collected by magnet, for 5 times with IP buffer, and boiled with NuPAGE loading dye. Samples were analyzed by western blotting.
In vitro translation
Cell-free in vitro translation was performed using the 1-Step In Vitro Translation Kit (Thermo Scientific), following the manufacturer guidance. Target proteins were cloned into pT7CFE1-NHA vector (with N-terminal HA tag), and was in vitro translated at 30°C.
Bacteria expression and GST pulldown
GST-tagged constructs were transformed into BL21-CodonPlus E. coli and purified with glutathione beads (Life Technologies). Lamin B1 370–458 and 390–438 fragments were cloned into GST construct with a TEV protease recognition site between GST and the cloned sequences. The expressed proteins were loaded and purified with glutathione agarose beads, and digested with His-tagged TEV protease. The resulting supernatant was further purified with Ni-NTA beads (Qiagen) to remove His-tagged TEV protease.
For GST pulldown, bacterial lysates were incubated with glutathione beads at 4°C for 2 hours, and washed 4 times with buffer containing 50 mM Tris, pH 7.5, 150 mM NaCl, 1% Triton, 1 mM DTT, supplemented with 100 µM PMSF. The purified proteins or in vitro translated proteins were diluted in binding buffer (20 mM Tris, pH 7.5, 137 mM NaCl, 1 mM MgCl2, 1 mM CaCl2, 1% NP-40, supplemented with 1:1000 Halt Protease inhibitor cocktail), and then pre-cleared with GST at 4°C for 1 h. The resulting supernatant was then subjected to GST pulldown with GST or GST fusion proteins. The product was washed 4 times with binding buffer, and boiled with NuPAGE loading dye for immunoblotting analysis. Purified Lamin B1 protein was purchased from Origene.
Immunofluorescence and live-cell imaging
For immunofluorescence, cells were fixed in 4% paraformaldehyde in PBS for 30 min at room temperature. Cells were washed twice with PBS, and permeabilized with 0.5% Triton X-100 in PBS for 10 min. After washing two times, cells were blocked in 10% BSA in PBS for 1 h at room temperature. Cells were incubated with primary antibodies in 5% BSA in PBS supplemented with 0.1% Tween 20 (PBST) overnight at 4°C. The next day, cells were washed four times with PBST, each for 10 min, followed by incubation with Alexa Fluor-conjugated secondary antibody (Life Technologies) in 5% BSA/PBST for 1 h at room temperature. Cells were then washed four times in PBST, incubated with 1 µg/ml DAPI in PBS for 5 min, and washed twice with PBS. The slides were then mounted with ProLong Gold (Life Technologies), and imaged with the Leica TCS SP8 fluorescent confocal microscope. The slides were mounted with ProLong Diamond (Life Technologies) for 5 days at room temperature for super resolution microscopy.
Three dimensional structural illumination microscopy (3D-SIM) was carried out using N-SIM Super-resolution Microscope System (Nikon) with an oil immersion objective lens CFI SR (Apochromat TIRF 100×, 1.49 NA; Nikon). 20–41 optical sections were collected with a 200 nm interval between neighboring sections.
For live-cell imaging, mCherry-GFP-Lamin B1 HRasV12 cells were plated onto 35 mm glass bottom dish (MatTek #P35G-0-14-C) pre-coated with poly-l-lysine (Sigma-Aldrich). The dish was imaged with spinning disk fluorescent confocal (Olympus IX71 & IX81 inverted microscope, coupled with Andor iXon3 EMCCD camera, motorized x-y stage, Okolab stagetop incubation chamber, and MetaMorph acquisition software). Cells were imaged every 15 min, for a duration of overnight. 12 Z-sections were acquired covering the entire individual cell. Images were viewed and presented as the maximum-projection from all Z-sections.
Transmission electron microscope (TEM)
For immuno-gold TEM, GFP-Lamin B1 expressing IMR90 cells were subjected to high pressure freezing. The samples were then dehydrated by freeze substitution methods for 72 hours at −90°C in 0.1% uranyl acetate/acetone followed by embedding in lowicryl HM20 at −50°C with 360 nm light polymerization of the resin for 48 hours. Resin embedded cells were sectioned at 70 nm thickness. GFP-Lamin B1 was detected with a GFP antibody35 diluted 1:50 in 5% BSA, 0.1% fish gelatin, in PBS. 10 nm gold colloids conjugated to Goat anti-rabbit (Electron Microscopy Sciences) at 1:200 was used for secondary detection of GFP-antigen conjugates followed by a 0.2% gluteraldehyde post fix to stabilize the immuno-protein complexes. Imaging was performed at 80 KeV on a JEOL 1010 at indicated magnifications and collected digitally on an AMT side entry CCD without post-labeling heavy metal staining. For TEM analysis of ultrastructures of control and HRasV12 IMR90, cells were subjected to high pressure freezing, followed by standard TEM procedures.
Chromatin immunoprecipitation (ChIP), RT-qPCR, and ChIP-sequencing
These assays were performed as described previously16 with slight modification. In brief, cells were crosslinked with 1% formaldehyde diluted in PBS, without the addition of other co-crosslinkers, for 5 min at room temperature. After glycin quenching, the cell pellets were lysed in buffer containing 50 mM Tris, pH 7.5, 150 mM NaCl, 1% Triton, 0.1% Na-Deoxycholate, 0.1% SDS, supplemented with complete protease inhibitor cocktail (Thermo Scientific), and sonicated with Covaris sonicator, resulting in chromatin fragments of 250 bp average size. The supernatant was diluted 10 times with the above buffer without SDS, and subjected to immunoprecipitations with 2 ug of antibody or control IgG conjugated with Dynabeads Protein A or G (Invitrogen) at 4 °C for overnight. The beads were then washed 5 times with buffer containing 50 mM Tris, pH 7.5, 150 mM NaCl, 1% Triton, and 1 time with final wash buffer (50 mM Tris, pH 8.0, 10 mM EDTA, 50 mM NaCl), followed by elution with incubation of elution buffer (final wash buffer plus 1% SDS) at 65 °C for 30 min with agitation in a thermomixer. The ChIP and input were then purified and used for qPCR analysis or for constructing sequencing libraries with the NEBNext Ultra kit (New England Biolabs). For ChIP-sequencing, the libraries were quantified (Kapa Biosystems), and were single-end sequenced on an Illumina NextSeq 2000.
The following primers were used for qPCR analyses of LADs:
LAD1: forward AGAGACGTGGCGTGTGTCC, reverse GGCACTGAAGCCACCTCTGT (chr4: 190524973-190525023); LAD2: forward ATTTGCACAATCTGAGGGCG, reverse CTGGGCAATTCCCTTGGTAGT (chr7: 35434121-35434171); LAD3: forward GCATCCATTTCACATCCTTGG, reverse CCCATTGCCTCTGAAGTTTTGT (chr8: 130184820-130184870).
Subcellular fractionation
This was performed with the subcellular fractionation kit for cultured cell (Thermo Scientific #78840) according to the manufacturer instructions, with slight modification. Benzonase (Novagen) was used to digest chromatin-bound proteins in the nuclear fraction, in the buffer supplemented with 5 mM MgCl2.
Senescence-associated beta-galactosidase (β-gal) assay
β-gal assays were performed using the cellular senescence assay kit (Chemicon #KAA002), according to the manufacturer protocol. Cells were incubated with β-gal detections solution at 37°C overnight, and quantified under regular light microscopy. At least 200 cells were scored for β-gal positivity with over 4 different fields.
Computational methods
Alignment of vertebrate Lamin B1 proteins was done using ClustalX 2.137. Computational analysis of ChIP-seq was performed as previously described and as follows:
Data source
H3 (GEO accession GSM897555), H3K4me3 (GEO accession GSM897556). H3K9me3 ChIP-seq data (GEO accession GSM942075 and GSM942119) were published elsewhere15,38. LC3 and Lamin B1 ChIP-seq data in this study have been deposited in the Gene Expression Omnibus (www.ncbi.nlm.nih.gov/geo) under accession number GSE63440.
Alignment of Lamin B1, LC3 and input
all ChIP-seq data were aligned to the GRCh37 (hg19) assembly of the human genome using bowtie2 with command-line parameters -k1 -N1 --local (allowing and reporting a single alignment per read with one or zero mismatch permitted in the seed region).
Track generation
ChIP-seq visualization tracks were created in the following way. Aligned sequence tags were subjected to bedtools' genomeCoverageBed tool, making bedGraphs that were multiplied by the RPM coefficient. A similarly normalized input bedGraph was then subtracted from Lamin B1 and LC3, and bedGraphs were made into bigWigs using UCSC Genome Browser's bedGraphToBigWig utility.
Box plot
aligned tag counts were assessed for each LAD for all marks under study, as well as corresponding input and H3. The distribution of ChIP enrichment (ChIP-background) is computed over all LADs or over an equal number of size-matched background regions, sampled from all genomic positions that do not overlap with LADs. Hypothesis-testing was done by Mann-Whitney/Wilcoxon.
Overlap permutation test
to determine whether LADs are significantly associated with LC3ADs, the number of base-pairs in common between LADs and other domains was tabulated using bedtools intersect (default two set comparison). In each of 1,000 iterations, LAD coordinates were randomly shuffled using bedtools, creating 1,000 sets of equal-sized control regions. Each control set was scored for the number of base-pairs in common with LC3ADs, and the frequency with which control sets shared more genomic space with other domains than LADs was taken to be an estimate of the probability that LADs-LC3ADs association is not due to chance.
AUC permutation test
for Figure 2e, a permutation test for LC3, H3K9me3 and H3K4me3 over LADs was performed. In each of 100 iterations, LADs coordinates were randomly shuffled using bedtools, creating 100 sets of equal-sized non-LADs control regions. LADs as well as each of the 100 non-LAD control sets were scored for LC3, H3K9me3, and H3K4me3 enrichment and the number of control sets in which the median score is greater than or equal to the median value of the LAD distribution was tabulated. That frequency is taken to be an estimate of the probability that enrichment over LADs is not due to chance; i.e., the probability of the null hypothesis that LADs and non-LADs have the same median enrichment. The p-value for H3K9me3 is < 0.01, and the p-value for H3K4me3 is 1. This test was repeated using the 75th percentile value as the test statistic and also with the 90th percentile value with the same result in both cases.
Domain detection
enriched domains for Lamin B1 and LC3 were called using EDD14 with default bin size estimation and gap penalty estimation and unalignable regions (the hg19 assembly gap track from Genome Reference Consortium) were masked. The FDR was controlled at the default value of 5%.
Statistical analysis
Student’s t test was used for comparison between two groups. One-way ANOVA coupled with Tukey’s post hoc test was used for comparisons over two groups. Significance was considered when p value was less than 0.05.
Extended Data
Extended Data Figure 1. Characterization of LC3 and Lamin B1 association.
a, Protein gel staining of purified Lamin B1 protein. b, c, Purified Lamin B1 protein was subjected to GST pulldown. d, Endogenous LC3 IP in HEK293T cells. e, IMR90 stably expressing GFP-LC3 constructs were starved and imaged. f, Endogenous co-IP in wild-type and Atg5 knock-out MEFs. g, Nuclear fractions of control and Atg7 knockdown IMR90 cells were analyzed by LC3 IP. h–j, BiFC analysis of LC3-Lamin B1 interaction. HeLa were transfected with indicated combination of split Venus constructs and analyzed as followed. h, Cells were fixed and imaged. i, Lysates were analyzed by immunoblotting. j, Cells were scored for Venus positivity. Bars are the mean ± s.d.; n=4, with over 500 cells; * P < 0.001; unpaired two-tailed Student’s t-test.
Extended Data Figure 2. LC3 interacts with LADs on chromatin.
a, b, ChIP-qPCR of proliferating IMR90. c, ChIP-qPCR of LC3 knockdown IMR90. Bars are the mean ± s.e.m (a, b), s.d. (c); n=3; * P < 0.05, ** P < 0.005, *** P < 0.0001; n.s., non-significant; unpaired two-tailed Student’s t-test. d–i, ChIP-sequencing analyses. d, related to Fig. 2c, a zoom-in window of chromosome 3. e, f, Analyses of two replicates at LADs and LC3ADs. g, Per-nucleotide overlap of published datasets with the LADs called from this study. Number unit: megabase. h, Enrichment over LC3ADs. * P < 2.2×10⁻¹⁶; one-sided Wilcoxon test. i, Analysis of our Lamin B1 and LC3 ChIP-seq at LADs defined by other studies, and randomly sampled non-LADs loci (Ctrl). * P < 2.2×10⁻¹⁶; one-sided Wilcoxon test.
Extended Data Figure 3. Lamin B1 degradation upon HRasV12-induced senescence.
a, Related to Fig. 3b. Immunoblotting of immortalized IMR90. b, GFP-Lamin B1 stably expressing IMR90 were treated as indicated and imaged. Cytoplasmic signals are indicated by arrows. c–e, TEM analyses of IMR90. Nu: nucleus. f, IMR90 stably expressing mCherry-GFP-Lamin B1 were imaged and quantified. g, Cells as in f were treated with bafilomycin A1 and imaged under confocal microscopy.
Extended Data Figure 4. Imaging analyses of mCherry-GFP-Lamin B1 HRasV12 cells.
a, Related to Fig. 3c. mCherry-GFP-Lamin B1 stably expressing IMR90 were imaged by 3D-super resolution microscopy. Sections shown span the top, middle, and bottom layers of the cell. The mCherry channel was deliberately under-exposed to prevent over-saturation of the cytoplasmic signals. Scale bar: 5 µm. The insets are presented in Fig. 3c. b, Live-cell imaging of mCherry-GFP-Lamin B1 HRasV12 IMR90. Images shown are the maximum-projection combining all Z-sections. Nucleus-to-cytoplasm transport events are labelled sequentially as indicated. Note the initial yellow signal, followed by disappearance of GFP then mCherry, in events 1 and 3; event 2 was not yet degraded by the end of the imaging.
Extended Data Figure 5. CCF and Lamin B1 are targeted by autophagy.
a, b, IMR90 stably expressing GFP-LC3 and HRasV12 were stained with indicated antibodies and imaged under confocal microscopy. Cytoplasmic events are labelled by arrows. c, HRasV12 IMR90 were stained with LC3 antibody. d, Related to Fig. 3e, immuno-TEM analysis of GFP-Lamin B1 IMR90. Cells were stained with a GFP antibody and conjugated with 10 nm gold-particles. Nu: nucleus. Gold-particles are indicated by arrows.
Extended Data Figure 6. Knockdown of Atg7 attenuates Lamin B1 downregulation.
a, Related to Fig. 4a, quantification of Lamin B1 immunoblots. Bars are the mean ± s.e.m.; n=3; * P < 0.05, ** P < 0.005, *** P < 0.0001, compared with sh-NTC Day 0; n.s., non-significant. b, RT-qPCR of cells as in Fig. 4a. Data are the mean normalized to GAPDH ± s.e.m.; n=3. c, d, IMR90 were treated as indicated and analyzed by immunoblotting. e, BJ were treated with etoposide and analyzed by immunoblotting. f, g, Atg7 knockdown inhibits mCherry-GFP-Lamin B1 nucleus-to-cytoplasm transport. Bars are mean ± s.d.; n=4, over 100 cells; * P < 0.0001. h, i, ER:HRasV12 BJ stably expressing Dox-inducible GFP or GFP-Lamin B1 were either left uninduced (#1 and #2), or induced with 4-OHT for 3 weeks (#3 to #6). Cells were then induced with Dox (in the presence of 4-OHT) for additional 2 weeks (#5 and #6). i, Quantification of β-gal positivity. Bars are the mean ± s.d.; n=4, over 200 cells. j, Related to Fig. 4a, quantification of p16 immunoblots. Bars are the mean ± s.e.m.; n=3; * P < 0.05, compared to corresponding sh-NTC controls. k, ER:HRas IMR90 were scored for β-gal positivity. Bars are the mean ± s.d.; n=4, over 200 cells; * P < 0.0005, ** P < 0.0001. One-way ANOVA coupled with Tukey’s post hoc test for a and i; all other tests are unpaired two-tailed Student’s t-test.
Extended Data Figure 7. LC3 R10 and R11 are essential for Lamin B1 binding.
a, b, HEK293T cells were transfected as indicated and analyzed by co-IP. c–e, BiFC analyses in HeLa cells transfected with indicated combination of split Venus constructs. Bars are mean ± s.d.; n=4, over 500 cells; * P < 0.0001. f, IMR90 stably expressing indicated constructs were analyzed by Flag ChIP. Bars are mean ± s.e.m.; * P < 0.05, ** P < 0.005; unpaired two-tailed Student’s t-test for e and f. g, LC3 R10 and R11 are necessary for colocalization with CCF in HRasV12 IMR90. CCFs are indicated with arrows.
Extended Data Figure 8. Mapping of LC3-Lamin B1 interaction.
a, HEK293T cells transfected with indicated constructs were analyzed by GST-LC3B pulldown. b, c, In vitro translated constructs were subjected to GST-LC3B pulldown. d, e, Evolutionary analyses of vertebrate Lamin B1 and the corresponding regions of other lamin isoforms. e, Number of conserved residues normalized to total residues. f, Bacterially purified fragments were analyzed by GST-LC3B pulldown. g, mCherry-GFP-Lamin B1 370–458 localizes to the nucleus. h, Cells were starved and analyzed by immunoblotting. i, j, Related to Fig. 4f, quantification of Lamin B1 and p16 immunoblots. n=3. k, ER-HRasV12 IMR90 were scored for β-gal positivity. n=4, over 200 cells. Bars are the mean ± s.e.m. (i and j), s.d. (k); n.s., non-significant; * P < 0.05; ** P < 0.0005; *** P < 0.0001; unpaired two-tailed Student’s t-test.
Extended Data Figure 9. Additional characterization of Lamin B1 substitution mutant.
a–f, Related to Fig. 5a, in vitro translated proteins were analyzed by GST-LC3B pulldown. g, LC3 IP in HEK293T cells transfected as indicated. The remaining interaction with the mutant is likely due to the endogenous Lamin B1 that interacts with LC3 and the mutant, as shown in j. h, i, IMR90 were imaged under confocal microscopy and quantified. Bars are the mean ± s.d.; n=4, over 200 cells; * P < 0.05, ** P < 0.005, *** P < 0.0001; unpaired two-tailed Student’s t-test. j, HEK293T transfected were analyzed by IP. k, ER:HRasV12 IMR90 were induced with OHT and harvested for immunoblotting. l, IMR90 were quantified for β-gal positivity. Bars are the mean ± s.d.; n=4, over 200 cells; * P < 0.05, ** P < 0.01, *** P < 0.001, **** P < 0.0001, n.s., non-significant; one-way ANOVA coupled with Tukey’s post hoc test.
Extended Data Figure 10. Lamin B1 370–458 fragment extends cellular lifespan.
a, In vitro translated proteins were analyzed by GST-LC3B pulldown. b. ER:HRasV12 IMR90 were quantified for β-gal positivity. Bars are the mean ± s.d.; n=4, over 200 cells; * P < 0.05; n.s., non-significant; one-way ANOVA coupled with Tukey’s post hoc test. c,d, Related to Fig. 5f, Representative images of β-gal. e, Related to Fig. 5g, cells were fixed and stained with DAPI. CCFs are indicated by arrows.
Supplementary Material
Acknowledgments
We thank members of the Berger lab, Adams lab, and Goldman lab for technical assistance and discussions. We acknowledge Dr. Andrea L. Stout for the help on confocal microscopy, and the electron microscopy resource laboratory for the assistance on TEM. We thank Dr. Zhenyu Yue for sharing the GFP antibody and the critical reading of the manuscript. Z.D. is supported by the fellow award from Leukemia & Lymphoma Society. B.C.C. is supported by career development awards from the Dermatology Foundation, Melanoma Research Foundation, and American Skin Association. Research in S.L.B., P.D.A., and R.M. laboratories is supported by NIA P01 grant (P01AG031862), and R.D.G laboratory is supported by R01 GM106023 and the Progeria Research Foundation.
Footnotes
Supplementary Information is available in the online version of the paper.
Author Contributions
Z.D., A.I., P.D.A and S.L.B conceived the project. Z.D. performed most of the experiments. C.X., G.D., B.C.C., A.M.D. and P.P.S. performed and analyzed ChIP-seq. T.S. performed 3D-SIM imaging. T.S., S.A.A. and R.D.G contributed novel lamin reagents and experimental design. J.-A. P, J.M.C. and W.-X. Z contributed novel autophagy and senescence reagents. J.Z. performed Atg7 knockdown. M.D.R. and R.M. contributed to the biochemistry characterization of LC3-Lamin B1 interaction. T.L. and T.J. contributed novel autophagy constructs and experimental design. Z.D., P.D.A. and S.L.B composed the manuscript. All authors reviewed the manuscript and discussed the work.
LC3 and Lamin B1 ChIP-seq data can be accessed through NCBI Gene Expression Omnibus (GEO) database under accession number GSE63440.
The authors declare no competing financial interests.
References
- 1.Levine B, Kroemer G. Autophagy in the pathogenesis of disease. Cell. 2008;132:27–42. doi: 10.1016/j.cell.2007.12.018. [DOI] [PMC free article] [PubMed] [Google Scholar]
- 2.Mizushima N, Levine B, Cuervo AM, Klionsky DJ. Autophagy fights disease through cellular self-digestion. Nature. 2008;451:1069–1075. doi: 10.1038/nature06639. [DOI] [PMC free article] [PubMed] [Google Scholar]
- 3.Choi AM, Ryter SW, Levine B. Autophagy in human health and disease. N Engl J Med. 2013;368:1845–1846. doi: 10.1056/NEJMc1303158. [DOI] [PubMed] [Google Scholar]
- 4.Kabeya Y, et al. LC3, a mammalian homologue of yeast Apg8p, is localized in autophagosome membranes after processing. Embo J. 2000;19:5720–5728. doi: 10.1093/emboj/19.21.5720. [DOI] [PMC free article] [PubMed] [Google Scholar]
- 5.Mizushima N, Yoshimori T, Ohsumi Y. The role of Atg proteins in autophagosome formation. Annu Rev Cell Dev Biol. 2011;27:107–132. doi: 10.1146/annurev-cellbio-092910-154005. [DOI] [PubMed] [Google Scholar]
- 6.Rogov V, Dotsch V, Johansen T, Kirkin V. Interactions between autophagy receptors and ubiquitin-like proteins form the molecular basis for selective autophagy. Mol Cell. 2014;53:167–178. doi: 10.1016/j.molcel.2013.12.014. [DOI] [PubMed] [Google Scholar]
- 7.Drake KR, Kang M, Kenworthy AK. Nucleocytoplasmic distribution and dynamics of the autophagosome marker EGFP-LC3. PLoS One. 2010;5:e9806. doi: 10.1371/journal.pone.0009806. [DOI] [PMC free article] [PubMed] [Google Scholar]
- 8.Huang R, et al. Deacetylation of nuclear LC3 drives autophagy initiation under starvation. Mol Cell. 2015;57:456–466. doi: 10.1016/j.molcel.2014.12.013. [DOI] [PubMed] [Google Scholar]
- 9.Simon HU, Yousefi S, Schmid I, Friis R. ATG5 can regulate p53 expression and activation. Cell Death Dis. 2014;5:e1339. doi: 10.1038/cddis.2014.308. [DOI] [PMC free article] [PubMed] [Google Scholar]
- 10.Lee IH, et al. Atg7 modulates p53 activity to regulate cell cycle and survival during metabolic stress. Science. 2012;336:225–228. doi: 10.1126/science.1218395. [DOI] [PMC free article] [PubMed] [Google Scholar]
- 11.Shimi T, et al. The A- and B-type nuclear lamin networks: microdomains involved in chromatin organization and transcription. Genes Dev. 2008;22:3409–3421. doi: 10.1101/gad.1735208. [DOI] [PMC free article] [PubMed] [Google Scholar]
- 12.Kerppola TK. Bimolecular fluorescence complementation (BiFC) analysis as a probe of protein interactions in living cells. Annu Rev Biophys. 2008;37:465–487. doi: 10.1146/annurev.biophys.37.032807.125842. [DOI] [PMC free article] [PubMed] [Google Scholar]
- 13.Guelen L, et al. Domain organization of human chromosomes revealed by mapping of nuclear lamina interactions. Nature. 2008;453:948–951. doi: 10.1038/nature06947. [DOI] [PubMed] [Google Scholar]
- 14.Lund E, Oldenburg AR, Collas P. Enriched domain detector: a program for detection of wide genomic enrichment domains robust against local variations. Nucleic Acids Res. 2014;42:e92. doi: 10.1093/nar/gku324. [DOI] [PMC free article] [PubMed] [Google Scholar]
- 15.Sadaie M, et al. Redistribution of the Lamin B1 genomic binding profile affects rearrangement of heterochromatic domains and SAHF formation during senescence. Genes Dev. 2013;27:1800–1808. doi: 10.1101/gad.217281.113. [DOI] [PMC free article] [PubMed] [Google Scholar]
- 16.Shah PP, et al. Lamin B1 depletion in senescent cells triggers large-scale changes in gene expression and the chromatin landscape. Genes Dev. 2013;27:1787–1799. doi: 10.1101/gad.223834.113. [DOI] [PMC free article] [PubMed] [Google Scholar]
- 17.Shimi T, et al. The role of nuclear lamin B1 in cell proliferation and senescence. Genes Dev. 2011;25:2579–2593. doi: 10.1101/gad.179515.111. [DOI] [PMC free article] [PubMed] [Google Scholar]
- 18.Freund A, Laberge RM, Demaria M, Campisi J. Lamin B1 loss is a senescence-associated biomarker. Mol Biol Cell. 2012;23:2066–2075. doi: 10.1091/mbc.E11-10-0884. [DOI] [PMC free article] [PubMed] [Google Scholar]
- 19.Ivanov A, et al. Lysosome-mediated processing of chromatin in senescence. J Cell Biol. 2013;202:129–143. doi: 10.1083/jcb.201212110. [DOI] [PMC free article] [PubMed] [Google Scholar]
- 20.Serrano M, Lin AW, McCurrach ME, Beach D, Lowe SW. Oncogenic ras provokes premature cell senescence associated with accumulation of p53 and p16INK4a. Cell. 1997;88:593–602. doi: 10.1016/s0092-8674(00)81902-9. [DOI] [PubMed] [Google Scholar]
- 21.Collado M, Blasco MA, Serrano M. Cellular senescence in cancer and aging. Cell. 2007;130:223–233. doi: 10.1016/j.cell.2007.07.003. [DOI] [PubMed] [Google Scholar]
- 22.Young AR, et al. Autophagy mediates the mitotic senescence transition. Genes Dev. 2009;23:798–803. doi: 10.1101/gad.519709. [DOI] [PMC free article] [PubMed] [Google Scholar]
- 23.Liu H, et al. Down-regulation of autophagy-related protein 5 (ATG5) contributes to the pathogenesis of early-stage cutaneous melanoma. Sci Transl Med. 2013;5:202ra123. doi: 10.1126/scitranslmed.3005864. [DOI] [PubMed] [Google Scholar]
- 24.Roberts P, et al. Piecemeal microautophagy of nucleus in Saccharomyces cerevisiae. Mol Biol Cell. 2003;14:129–141. doi: 10.1091/mbc.E02-08-0483. [DOI] [PMC free article] [PubMed] [Google Scholar]
- 25.Mizushima N, Yoshimori T, Levine B. Methods in mammalian autophagy research. Cell. 2010;140:313–326. doi: 10.1016/j.cell.2010.01.028. [DOI] [PMC free article] [PubMed] [Google Scholar]
- 26.Pankiv S, et al. p62/SQSTM1 binds directly to Atg8/LC3 to facilitate degradation of ubiquitinated protein aggregates by autophagy. J Biol Chem. 2007;282:24131–24145. doi: 10.1074/jbc.M702824200. [DOI] [PubMed] [Google Scholar]
- 27.Toyama BH, et al. Identification of long-lived proteins reveals exceptional stability of essential cellular structures. Cell. 2013;154:971–982. doi: 10.1016/j.cell.2013.07.037. [DOI] [PMC free article] [PubMed] [Google Scholar]
- 28.Mochida K, et al. Receptor-mediated selective autophagy degrades the endoplasmic reticulum and the nucleus. Nature. 2015;522:359–362. doi: 10.1038/nature14506. [DOI] [PubMed] [Google Scholar]
- 29.Butin-Israeli V, et al. Role of lamin b1 in chromatin instability. Mol Cell Biol. 2015;35:884–898. doi: 10.1128/MCB.01145-14. [DOI] [PMC free article] [PubMed] [Google Scholar]
- 30.Dreesen O, et al. Lamin B1 fluctuations have differential effects on cellular proliferation and senescence. J Cell Biol. 2013;200:605–617. doi: 10.1083/jcb.201206121. [DOI] [PMC free article] [PubMed] [Google Scholar]
Supplemental References
- 31.Dou Z, et al. Class IA PI3K p110beta subunit promotes autophagy through Rab5 small GTPase in response to growth factor limitation. Mol Cell. 2013;50:29–42. doi: 10.1016/j.molcel.2013.01.022. [DOI] [PMC free article] [PubMed] [Google Scholar]
- 32.Wiederschain D, et al. Single-vector inducible lentiviral RNAi system for oncology target validation. Cell Cycle. 2009;8:498–504. doi: 10.4161/cc.8.3.7701. doi:7701. [DOI] [PubMed] [Google Scholar]
- 33.Kirkin V, et al. A role for NBR1 in autophagosomal degradation of ubiquitinated substrates. Mol Cell. 2009;33:505–516. doi: 10.1016/j.molcel.2009.01.020. [DOI] [PubMed] [Google Scholar]
- 34.Pan JA, Ullman E, Dou Z, Zong WX. Inhibition of protein degradation induces apoptosis through a microtubule-associated protein 1 light chain 3-mediated activation of caspase-8 at intracellular membranes. Mol Cell Biol. 2011;31:3158–3170. doi: 10.1128/MCB.05460-11. [DOI] [PMC free article] [PubMed] [Google Scholar]
- 35.Zhong Y, et al. Distinct regulation of autophagic activity by Atg14L and Rubicon associated with Beclin 1-phosphatidylinositol-3-kinase complex. Nat Cell Biol. 2009;11:468–476. doi: 10.1038/ncb1854. [DOI] [PMC free article] [PubMed] [Google Scholar]
- 36.N'Diaye EN, et al. PLIC proteins or ubiquilins regulate autophagy-dependent cell survival during nutrient starvation. EMBO Rep. 2009;10:173–179. doi: 10.1038/embor.2008.238. [DOI] [PMC free article] [PubMed] [Google Scholar]
- 37.Larkin MA, et al. Clustal W and Clustal X version 2.0. Bioinformatics. 2007;23:2947–2948. doi: 10.1093/bioinformatics/btm404. doi:btm404. [DOI] [PubMed] [Google Scholar]
- 38.Chandra T, et al. Independence of repressive histone marks and chromatin compaction during senescent heterochromatic layer formation. Mol Cell. 2012;47:203–214. doi: 10.1016/j.molcel.2012.06.010. [DOI] [PMC free article] [PubMed] [Google Scholar]
Associated Data
This section collects any data citations, data availability statements, or supplementary materials included in this article.


