Abstract.
Ultrasonography is a widely used imaging modality to visualize anatomical structures due to its low cost and ease of use; however, it is challenging to acquire acceptable image quality in deep tissue. Synthetic aperture (SA) is a technique used to increase image resolution by synthesizing information from multiple subapertures, but the resolution improvement is limited by the physical size of the array transducer. With a large F-number, it is difficult to achieve high resolution in deep regions without extending the effective aperture size. We propose a method to extend the available aperture size for SA—called synthetic tracked aperture ultrasound (STRATUS) imaging—by sweeping an ultrasound transducer while tracking its orientation and location. Tracking information of the ultrasound probe is used to synthesize the signals received at different positions. Considering the practical implementation, we estimated the effect of tracking and ultrasound calibration error to the quality of the final beamformed image through simulation. In addition, to experimentally validate this approach, a 6 degree-of-freedom robot arm was used as a mechanical tracker to hold an ultrasound transducer and to apply in-plane lateral translational motion. Results indicate that STRATUS imaging with robotic tracking has the potential to improve ultrasound image quality.
Keywords: ultrasound imaging, medical robotics, robotic ultrasound, synthetic aperture, tracking technique, ultrasound calibration
1. Introduction
Ultrasonography is a widely used medical imaging modality to visualize anatomical structures in the human body due to its low cost and ease of use. The image resolution of ultrasonography is affected by several factors including the center frequency of the transmission wave and the F-number, which represents the ratio of the focusing depth to the aperture size. Although a high center frequency is desired for high-resolution, high-frequency acoustic waves are easily absorbed and attenuated in the near field, resulting in degraded resolution and contrast in the far field. Consequently, only low-frequency acoustic waves are available if the region of interest is located in deep places. Similarly, F-number increases corresponding to the rise of the focusing depth, and it is challenging to acquire acceptable image quality in deep tissue, and accordingly a large aperture size is desired to decrease the F-number. In conventional ultrasound beamforming, some number of elements from an ultrasound transducer array are used as the aperture size. Synthetic aperture (SA) is a technique that increases image resolution by synthesizing the information from multiple subapertures and extending the effective aperture size.1–3 However, the maximum available aperture size in SA is still limited by the physical size of the ultrasound transducer. In the clinic, diagnosing obese patients with the current ultrasound imaging system is challenging, as the target region may be too deep due to a thick fat layer. Moreover, a high penetration depth with high resolution is demanded to visualize a fetus in early stage pregnancy. Using large aperture transducers could be a solution, but this increases the cost and significantly reduces the flexibility for different situations and procedures. There are also some cases for which large aperture probes cannot be used such as surgical interventions. Therefore, we investigate an approach that improves ultrasound image quality without changing the size of the ultrasound array transducer.
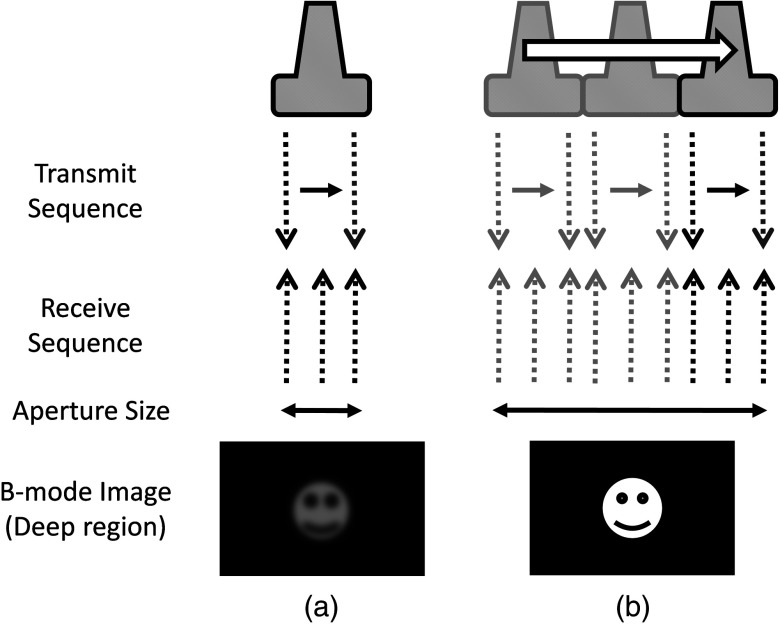
Our innovative approach is to expand the SA size beyond that of conventional SA by utilizing tracking technology, which we call synthetic tracked aperture ultrasound (STRATUS) imaging (Fig. 1). The tracking information is used to identify the orientation and the position of the ultrasound image, and an adaptive SA beamforming algorithm merges multiple subapertures from different poses of an ultrasound transducer. In other words, we virtually generate a wider coherent aperture to form an ultrasound image for a fixed region of interest. The ultrasound image quality improves, in that the aperture size expansion reduces the F-number. We conducted preliminary experiments and demonstrated the effect of aperture size extension in previous work.4,5 Considering the practical implementation, tracking inaccuracy and ultrasound calibration are causes of image degradation. Therefore, this paper extends the previous work by providing a simulation to evaluate the effect of these errors on image quality, to determine the relationship between the accuracy of the tracking device and ultrasound calibration, and to compare simulation and experimental results.
Fig. 1.
Synthetic tracked aperture ultrasound (STRATUS) imaging compared to conventional SA ultrasound imaging. (a) SA ultrasound imaging with a single pose and (b) STRATUS imaging with multiple poses.
This paper is structured as follow. We first introduce the background and concept of STRATUS imaging. Then, we demonstrate the feasibility of STRATUS imaging through simulations and experiments based on a particular configuration utilizing a 6 degree-of-freedom (DOF) robot arm. In the simulation, the effect that tracking accuracy and ultrasound calibration has on the ultrasound image quality is evaluated. We also conducted experiments using a 6 DOF robot arm to validate the image quality improvement due to aperture extension. Finally, we compare experiment results to simulation results, and discuss suitable tracking systems and configurations for this approach.
2. Background and Concept
2.1. Synthetic Aperture Imaging
In conventional clinical ultrasound systems, a fixed number of transmission and receiving elements is used to generate an A-line, and by sequentially acquiring multiple A-lines, a B-mode image is formed. The lateral resolution is determined by the number of elements used to build an A-line. On the other hand, in SA, signals transmitted from a single source will be received by all of the elements of the ultrasound transducer. A reconstructed image from a single element transmission has a low resolution because transmission focusing is not applied. These low-resolution images are considered as intermediate reconstructed images. Accumulating low-resolution images from different transmission elements has the effect of focusing transmission waves, and a higher resolution image can be obtained. When an image point is reconstructed, the delay function applied can be expressed as
| (1) |
where is the distance from the transmission element to the focusing point, is the distance from the receiving element to the focusing point, and is the speed of sound. Therefore, the focused signal in two-dimensional (2-D) image is
| (2) |
where is the received signal, and and are the transmission and receive line numbers, respectively. is the number of emissions, and is the number of elements that receive the signal. Conventional ultrasound beamformers can only focus a single focus depth for each transmission, so it is practically impossible to transmit focus at every pixel of an image. An SA algorithm, however, emulates transmit focus at every single location of an image, so that a dynamic focus can be applied to both transmit and receive. Hence, a significant improvement in resolution can be expected relative to the aperture size used to construct an image. In the case of STRATUS imaging, we further extend the algorithm by changing the locations of the transmission and receiving elements.
2.2. Synthetic Tracked Aperture Ultrasound Imaging
The background of ultrasound image tracking using tracking systems is summarized in Appendix A. A rigid-body transformation between two coordinate systems is defined as
| (3) |
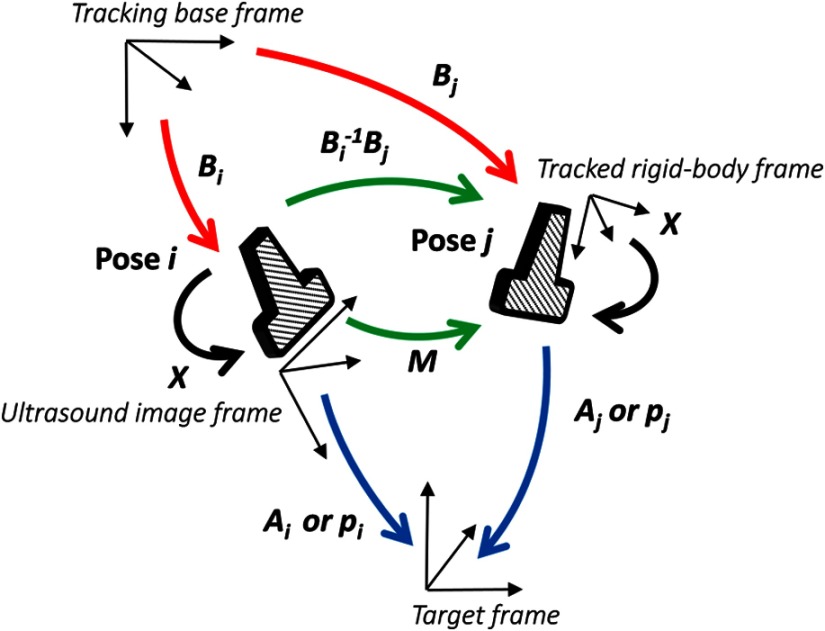
where is a rotation matrix, and is a translation vector. Figure 2 shows the coordinate systems involved in STRATUS imaging. The transformation from the tracking base frame to its tracked marker frame is defined as , the transformation from the tracked marker frame to the ultrasound image frame is defined as , and the transformation from the ultrasound image frame to the imaging target frame is defined as . When the target is a single point, is used to describe the point location in the ultrasound image. The motion applied to the ultrasound probe, the relative transformation between two poses from the ultrasound image frame, can be expressed as
| (4) |
where and correspond to two poses of the tracked marker. To introduce the motion , the new probe pose is determined from its original pose. When the original rigid body transformation is , a new pose can be expressed as
| (5) |
Fig. 2.
The coordinate systems involved in synthetic tracked aperture ultrasound (STRATUS) imaging.
In the reconstruction process, data collected at each pose are projected back into the original ultrasound image frame and summed up.
2.3. Implementation Strategies of Synthetic Tracked Aperture Ultrasound Imaging
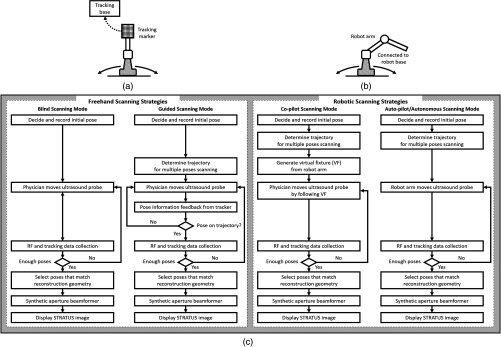
Improving ultrasound image quality by tracking the ultrasound transducer is the fundamental goal of STRATUS imaging. To achieve this goal, various combinations of tracking techniques and scanning strategies can be considered. We divide these scanning scenarios into two categories: freehand scanning and robotic scanning. Freehand scanning means that a physician controls and moves the ultrasound probe, while a tracker provides accurate pose information to help coherently synthesize information from multiple poses. Most tracking devices are capable of implementing this approach. Robotic scanning involves more specific strategies that involve the physical input from a mechanical actuator to move and follow a certain trajectory.
In freehand scanning, the physician is allowed to scan the ultrasound probe as usual without receiving any direct physical feedback during tracking [Fig. 3(a)], and two submodes are considered. The first mode is the blind scanning mode. In this mode, the tracker does not provide any feedback to the physician during data acquisition. After determining the initial pose, its position and orientation are recorded through the tracking device. This geometry is used as the base image frame during SA reconstruction. Then, the ultrasound transducer is moved by the physician freehand, while the tracking information and channel data for each pose are recorded simultaneously. The fusion of image information from multiple poses can be done by selecting poses that extend the coherent aperture. The second mode is the guided scanning mode. The characteristic of this mode is that the physician receives real-time feedback on the scanning trajectory. After setting the initial pose, an ideal trajectory to enhance image quality can be automatically calculated. While the physician moves the probe, the tracking device provides the real-time feedback indicating the compatibility of the actual trajectory and the computed ideal trajectory. The data will be recorded when the pose lies on the desired trajectory. Once all of the required data are collected, the adaptive SA beamformer can be applied to the ultrasound data utilizing its associated pose information.
Fig. 3.
Scanning strategies (a) freehand scanning and (b) robotic scanning. (c) Diagrams visualizing STRATUS image acquisition and formation under different scanning approaches.
In robotic scanning, a robot arm enables advanced data collection strategies [Fig. 3(b)]. Since the robot arm can act as a mechanical tracker, the aforementioned freehand scanning is also applicable to this configuration. Two additional modes are described here. First, the copilot mode is a mode where scanning is done by a physician and the robot system cooperatively. In this mode, we utilize virtual fixtures, a software construct designed to prevent humans from causing an accident due to human error,6 by rejecting undesirable inputs or guiding the physician toward the ideal scanning trajectory. After setting the initial pose, a trajectory to extend the aperture is computed, and a virtual fixture can be implemented to lead the physician to move along the trajectory, while some haptic feedback discourages motion away from the computed path. The benefit of the co-pilot mode is that it is possible to emulate the ideal trajectory more closely than freehand scanning. At the same time, as the probe remains under the physician’s control, it is safer than the autonomous scanning approach. The auto-pilot or autonomous mode is one where the robot itself moves the ultrasound probe to its destination without requiring input from the physician. Therefore, the scan can be faster and more precise, minimizing motion artifacts. Naturally, safety becomes a bigger concern in this case.
3. Materials and Methods
3.1. Robotic Motion Generation in Pure-Translation Scenario
In this paper, a robot arm is used as the tracking system to track the pose of the ultrasound transducer rigidly attached to its end-effector. The advantage of robotic tracking is that the tracking accuracy is higher than other tracking devices because of its direct physical connections. By sweeping the ultrasound transducer using the robotic arm, multiple images from multiple poses can be acquired. When only translational motion is applied, the rotation matrix can be regarded as an identity matrix, and the equation to determine the next pose from Eq. (5) becomes
| (6) |
Eq. (6) indicates that only the rotational components of are required to determine the pose in translation-only scenarios, and the translational error term in has no effect. This property is useful in the practical situation, because it reduces the accuracy requirement for ultrasound calibration, or the rotational components can be prioritized during the calibration process. Accordingly, the translation-only scenarios are the focus as an initial system implementation in this paper.
3.2. Simulation
From a practical point of view, marker tracking inaccuracy and ultrasound calibration are the two major error sources. Thus, it is necessary to understand how these uncertainties affect the ultrasound image quality in STRATUS imaging. We conducted an extensive simulation to evaluate the overall performance under varying levels of both tracking and calibration errors.
The simulations were conducted using Field II software, which was used within MATLAB (The MathWorks Inc., Natick, Massachusetts).7 To produce simulation data, a 64-element linear transducer array with a pitch size of 0.32 mm was designed for both transmission and receiving, which corresponds to a 20.48-mm array transducer. A single element was transmitted sequentially throughout the ultrasound array, and for each element transmission, each of the 64 elements were used to receive. The adaptive delay function was applied on each transmit data based on Eq. (2) for SA beamforming. Under these conditions, a single pose will result in 64 lines of received signals. The probe pose was moved five times with a 32-line overlap with each neighboring pose, corresponding to a total of 192 lines. After setting the center pose, the two poses to the left and to the right, respectively, were calculated by taking into account their relative motion between them and the center pose. The transmission center frequency was set to 2 MHz, and the sampling frequency was set to 40 MHz based on the following experimental setup. A single point target was placed at a depth of 100 mm.
3.3. Experiment Implementation
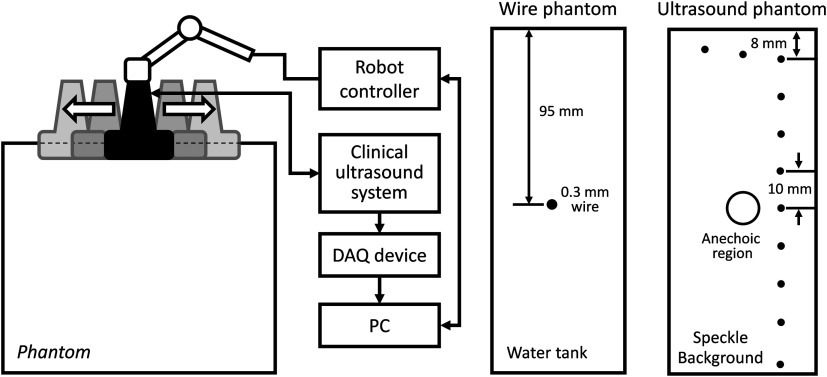
The experimental setup is shown in Fig. 4. A 6-DOF robot arm (UR5, Universal Robot) was used to move the transducer, and prebeamformed RF signals were collected from the clinical ultrasound machine (Sonix Touch, Ultrasonix Inc.) using a Sonix DAQ device. A 20.48-mm width phased array transducer (P4-2, ATL) with 64 elements was prepared. A 2-MHz center frequency was transmitted, and received signals were collected at a 40-MHz sampling frequency. One-dimensional (1-D) translational motions of 10.24 mm displacement were applied for each step. A line phantom was used and a general ultrasound phantom (84-317, Nuclear Associates) with wire targets and anechoic regions was used as the imaging target to evaluate the point spread function. During the procedure, each pose of the robot end-effector was recorded on the PC. At the same time, the clinical ultrasound systems transmitted an acoustic wave from each element sequentially. The same transmission sequences applied in the simulation were used to generate probe motion. The channel data are collected on the DAQ device and transferred to the PC.
Fig. 4.
Experimental setup for synthetic tracked aperture ultrasound (STRATUS) imaging. (a) Robot control and ultrasound data acquisition system. (b) Wire phantom design. (c) General ultrasound phantom design.
3.4. Ultrasound Calibration Using Active Echo Phantom
We used a point-based calibration, in which an active-echo (AE) element was treated as the point target.8,9 The AE element will be apparent in the B-mode image as a point, with the assumption that the point is located in the ultrasound image midplane. A set of segmented points is used as the information of the AE location in ultrasound image coordinates. The AE element is fabricated from a piezoelectric element, with functionalities to convert the received acoustic wave to electrical signals and simultaneously transmit an acoustic pulse feedback. The amplitude of the converted electrical signals corresponds to the strength of the received acoustic pulse, which is maximized at the midplane of the ultrasound beam. Ideally, the generated ultrasound beam is infinitesimally thin, but in reality the ultrasound beam has some elevational thickness. This is a typical source of error in ultrasound calibration where the segmented point is often assumed to be located in-plane. Therefore, the AE element helps in positioning the point phantom with respect to the ultrasound image such that this assumption is less erroneous. The AE phantom is considered to be more accurate than cross wire, which is one of the most commonly used phantoms for ultrasound calibration.10–13
The unknown transformation is solved through14
| (7) |
where the tracker transformation is recorded from the robot encoders. We collected 100 poses by moving the robot arm to provide unique rotations and translations; concurrent tracking information and ultrasound channel data were recorded. The SA beamformer is used to reconstruct the received channel data for point segmentation.15 To quantify the performance of ultrasound calibration, point reconstruction precision (RP) is used. RP is a widely used metric to evaluate the performance of ultrasound calibration. When a point phantom is scanned from different poses, the distribution of the reconstructed point in the tracking base frame, BXp, is expected to be a point cloud. The RP is quantifying the size of the point cloud by showing the norm of standard deviation.
| (8) |
where is the number of poses, and is the mean of for every .
As a result, 89 out of 100 data points were selected for calibration and evaluation, while 11 data points were removed due to low image quality and segmentation difficulty. Accordingly, 60 points are randomly chosen for calculating the unknown transformation , and the remaining 29 points were used for evaluating RP. This random selection was repeated 20 times. The mean of the computed RP was 1.33 mm with a standard deviation of 0.11 mm. The minimum was 1.15 mm, and the maximum was 1.60 mm.
3.5. Image Quality Assessment Metrics
In simulation, to quantitatively evaluate the resolution and blurring of images due to errors, the size of the point spread function was measured by counting the number of pixels over a certain threshold. The threshold was set to . The pixel count result in single pose was set as the baseline, and the ratio compared to the baseline case was used as the metric to express the quality of the image. To be precise, the pixel count ratio () is formulated as
| (9) |
The ratio higher than 1 indicates better image quality compared to the single pose case. The pixel count was used instead of the full width at a half maximum (FWHM), because FWHM is optimized to quantify 1-D resolution, but not good at representing 2-D effects. However, the blurring effect due to errors occurs in two dimensions, and FWHM is insufficient in quantifying the effect. Pixel count, on the other hand, can characterize the diffusion of the point spread function, and this is a more representative metric for our analysis.
For experiment results evaluation, in addition to pixel count metric, the classic FWHM is also used when a point spread function is well reconstructed. For general ultrasound phantom, the contrast-to-noise ratio (CNR) of the anechoic region to its surrounding area is calculated. The CNR is defined as
| (10) |
where and are the means of the signal inside and outside of the region, respectively, and and represent the standard deviation of the signal inside and outside of the region, respectively.
4. Results and Discussion
4.1. Simulation Results
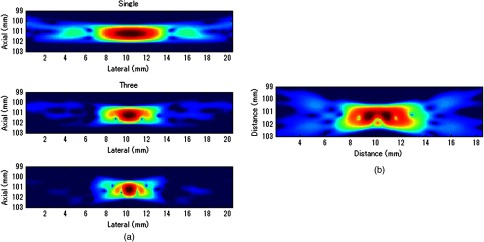
Example results of STRATUS imaging without introducing any error are shown in Fig. 5(a). To assess the effect of tracking error, we added error matrix in and . Now the ideal motion becomes
| (11) |
where is the error in , which is constant for multiple poses, while the error in , , and varies for each pose. An example of the simulated result from five poses with error is shown in Fig. 5(b). The received data of five poses were generated similarly as the case with no error except that is used instead of . The translational error in was not considered because it does not have an effect on STRATUS image formulation from Eq. (6).
Fig. 5.
STRATUS imaging with and without errors. (a) Simulated point source by utilizing single pose, three poses, and five poses. (b) Simulated point source from five poses with image tracking error. Rotational error in was 0.7 deg, and rotational and translational error in was 0.1 deg and 0.1 mm, respectively.
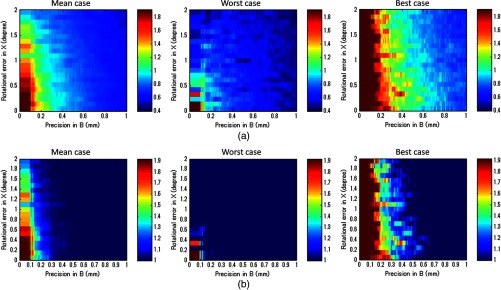
Then, the image quality metric was evaluated as a function of precision error in and rotational error in , which are the two main errors affecting STRATUS image quality. We considered nine variables: rotational and translational errors in , and rotational errors in . For each dimension, the step was 0.1 mm or degree for the translation and rotation components, respectively. To display a three-dimensional (3-D) matrix, both dimensions of rotation and translational errors in were compressed to a single precision dimension using the relationship map shown in Appendix B. The precision’s range in is set to vary from 0 to 1 mm, while the rotational error’s range in varied from 0 to 2 deg. For each value in the precision’s range, all possible corresponding rotational and translational components, according to the distribution map shown in Fig. 11, were taken into consideration, and their corresponding simulation image quality values were averaged. As mentioned earlier, the rotational error dimension shown in Fig. 6 represents the norm of the rotational error components. Thus, different rotational vectors can share the same norm value. Similarly, different translational vectors can share the same norm. To consider the variation of vectors, we run the simulation algorithm and acquire data from 18 independent trials with varying rotational and translational error vectors while maintaining the same corresponding norm values. As a result, Fig. 6 shows the mean, the worst-case, and the best-case scenarios of this image-quality analysis. The best-case scenario means that the highest value in each matrix is shown through 18 trials, and the worst-case scenario means that the lowest value is shown. The raw image quality metric is shown in Fig. 6(a), while Fig. 6(b) is rescaled to only show values larger than 1, which corresponds to the image quality of the single pose case. Any color other than the dark blue can be regarded as an image quality improvement compared to the single pose case. The value for each trial has a variation, and it indicates that the same magnitude of and can result in different image quality. The accumulation of multiple randomized errors in the process to simulating images from five poses can be one of the reasons to explain this phenomenon. However, a more important factor is that each Euler angle in the rotational error in has a different contribution to image quality. Axial direction misalignment between multiple poses is the most influential factor, and the rotation in elevation axis is the dominant component in causing misalignment between multiple poses in the axial direction. Therefore, the image quality can be degraded when the error in the elevational axis of rotation is significant even if the overall rotational error in is small. The error in is more tolerant than the error in , because the error in is constant for five poses, while the error in varies for each pose. Nevertheless, it does not mean that the error in is not important compared to that in because the rotational error in depends on the performance of ultrasound calibration that has room for improvement, while the error in is a predefined factor based on what tracking system is used.
Fig. 11.
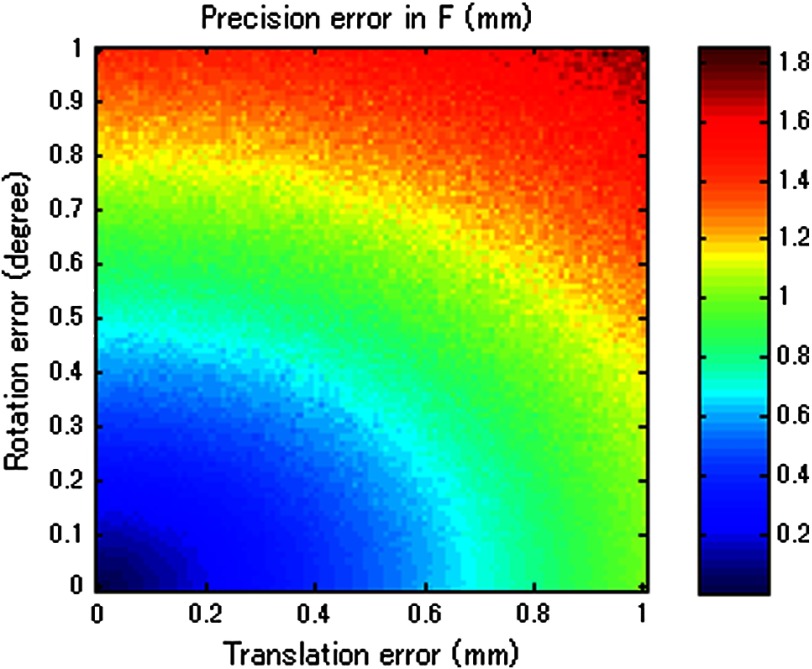
The relationship between rotational and translational components to the overall precision error.
Fig. 6.
Simulation results of image quality evaluation. (a) Quality of images of proposed method with different level of uncertainty in and . (b) As a normalized result, the pixel count for single pose was taken as the maximum value to show that the area the image quality did not improve.
The best-case scenario result is considered as the necessary condition of the STRATUS imaging. In this case, image quality improvement can be expected when an appropriate is chosen based on a task-oriented evaluation, in that not all is useful. On the contrary, the worst-case scenario can be regarded as the sufficient condition. If this condition is satisfied, the image quality can be improved for any rotational error in , and no additional task-based evaluation of is required. Nevertheless, this image quality evaluation result demonstrates that a supreme ultrasound calibration is desired to get an accurate . In addition, the error in is closely related to the error in because ultrasound calibration depends on the tracking accuracy . The error propagation relationship between them is analyzed in more detail in the discussion section.
4.2. Experiment Results
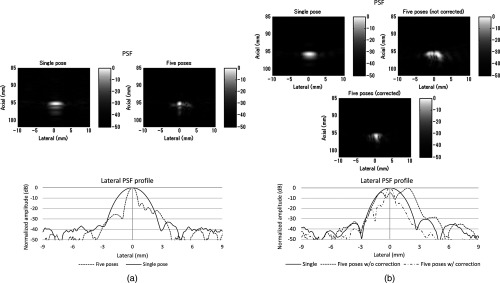
Figure 7 shows experimental results for the line phantom using two different computed calibration transformation , in which different combinations of poses were used to compute each . The results of a single pose SA image and an STRATUS image from five poses were compared. In trial 1, the image quality improvement based on the ratio of pixel counts was 1.84. FWHM of the point spread function for the cases using a single pose and five poses were 2.40 and 0.87 mm, respectively, and the lateral resolution was improved by a factor of 2.76. The result indicates that the used in trial 1 was close to the true . In trial 2, the point spread function is blurred because of the displacement of each pose. The rotational error of induces axial and lateral displacement for each pose, and axial displacement was especially sensitive. When 533 and shift was applied in the lateral and axial directions, respectively, the blurring effect could be compensated. Since the compensation was linear between multiple poses, the error attributed to the inaccuracy of can be compensated.
Fig. 7.
A line phantom was imaged using two different calibrated transformation. When was close to the true transformation between the robot end-effector to the image, the effect of aperture extension was clearly observable (a, trial 1). However, if inappropriate was chosen, the merged image was blurred, and that can be compensated by shifting each pose based on the amount of error in rotation (b, trial 2).
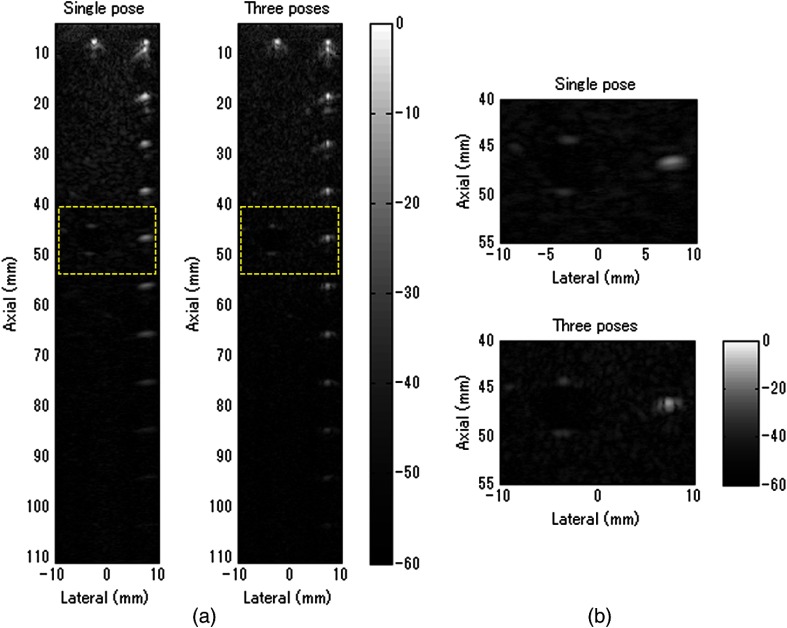
In addition to the line phantom, a general ultrasound phantom was used as the imaging target. Wire targets were located at 10 mm depth intervals, and the anechoic region was located at 50 mm (Fig. 8). When we compared the resulting image between the case with single pose and with three poses, we observed that the reconstructed images of the wire targets were clearly improved. This tendency could be seen over the entire structure, and the effect is more apparent in the deep regions. In Fig. 8(b), the anechoic region is magnified. It could be confirmed that the speckle size of the image reconstructed with five poses was reduced in the lateral direction, and the center region was darker than the single pose result. The CNR of the single pose result was 5.90, while that of three poses was 6.59; this is a 12% improvement due to aperture extension.
Fig. 8.
General ultrasound phantom was imaged. (a) The result from a single pose and three poses of the entire structure of the phantom is shown. (b) The anechoic region is magnified.
5. Discussion
5.1. Comparison of Experiment to Simulation
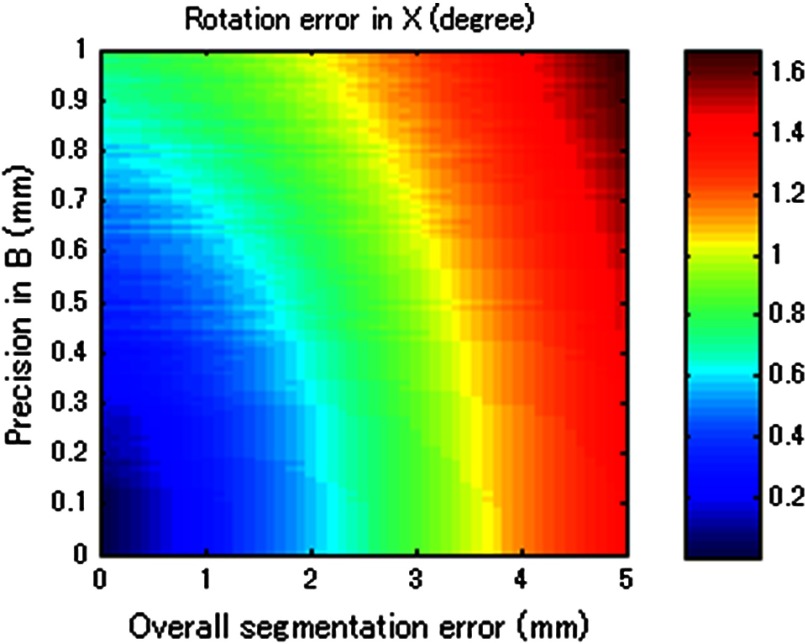
We used a robot arm UR5 with a translational accuracy of . Tracking accuracy is the metric commonly used to express the accuracy of tracking methods, but it only includes the translational components of error, although both rotation and translation error need to be considered in the analysis. Since the rotational accuracy is not reported, we estimated the rotational error from the translational error by considering that a rotational motion along a remote center generates a translational motion. Assuming the robot end-effector is located 20 to 60 cm away from the centroid of the rotation of a joint, the estimated corresponding rotational error was in the range of 0.029 to 0.095 deg. This number and the translational accuracy were used to compute the precision in of the system in Fig. 9(a). As a result, the precision in was estimated to be in the range of 0.17 to 0.43 mm. Given this estimated precision number, the rotational error in is shown in Fig. 9(b), when the segmentation error in the range of 1 to 2 mm is considered. The estimated segmentation error was derived from error propagation analysis shown in Appendix C. Accordingly, the has to reside in the region drawn, and the best possible error in was 0.31 deg, while the worst case was 0.67 deg. Now the experiment result and the simulated quality evaluation in Fig. 6 could be compared. For the experimental result in trial 1, the best case was chosen, while multiple Xs based on different combinations of poses in ultrasound calibration were computed. Thus, the graph of the best-case in the image quality evaluation simulation was chosen for comparison. In the simulation result, the best possible image quality improvement was 1.75 and the least improvement was 1.19 under the same conditions as the experiment. We computed the pixel count for the experimental result in trial 1 on a wire phantom, the image quality improvement compared to the value of single pose experiment result was 1.84. This number is close to that seen in the simulation.
Fig. 9.
Evaluation of experimental results based on simulation. (a) Analysis of precision in in UR5. (b) Analysis of a possible range of rotational error in , and (c) the possible image quality improvement in the best case.
5.2. Error Sources Affecting Synthetic Tracked Aperture Ultrasound Imaging
STRATUS imaging is very sensitive to the registration error between multiple poses, because the acceptable range of error in the beamforming is smaller than the transmission acoustic wavelength. Thus, compared to conventional SA, more error sources should be considered and analyzed. Errors in tracking systems and ultrasound calibration can be regarded as the static error that is independent from the imaging subject, while motion artifacts, tissue deformation, or tissue aberration5 are regarded as the dynamic error strongly depends on the subject or the operation conditions. The static error could be reduced by improving tracking systems and ultrasound calibration as discussed in simulation. On the other hand, the dynamic error is more difficult to handle, but should be overcome by optimizing the scanning plan and developing adaptive beamforming algorithms. Investigation on both the static and the dynamic error is essential to improve the performance of STRATUS imaging.
In particular, the effect of tissue deformation introduced by the ultrasound probe could be overcome for the following reasons. First, the primary imaging target of this technique is deep tissue. According to Buijs et al.’s work,16 it is demonstrated in simulation and experiment that the force applied on the surface will not be equally distributed in the tissue, but it will cause most of its compression on the surface, and the compression or tissue deformation becomes less as the depth increases. In addition, the compressibility of different tissues depends on their Young’s modulus, and it is known that the near field tissue, which is occupied by fat, has a much higher compressibility compared to the deep field tissue of muscle or internal organs. Second, the tissue deformation that matters for this technique is not the absolute amount of tissue deformation, but the relative tissue deformation between neighboring poses. When a robotic arm with force sensing functionality is used, we can measure the force applied to the tissue, and control the robot arm to keep the same amount of force throughout the scan.17 In other words, the relative tissue deformation could be even smaller by keeping the force applied on the tissue to be the same. Third, one of the purposes of conducting general ultrasound phantom experiment is to observe the effect of clinically realistic errors including tissue deformation. The general ultrasound phantom mimics soft-tissue properties of the human body, and tissue deformation should happen when the probe directly touched the phantom surface. However, as a result, the tissue deformation effect was not significant to cause negative effect on the synthesized image.
5.3. Effect of Tracking Systems and Ultrasound Calibrations
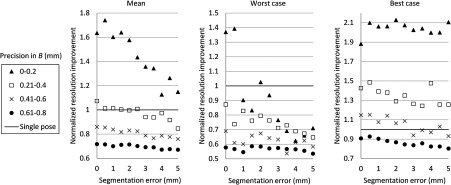
Figure 10 merged Figs. 6, 11 (from Appendix B), and 12 (from Appendix C) to compare tracking accuracy (precision error in ) versus the ultrasound calibration performance in terms of segmentation error. The number in each segmentation error metric was estimated by computing the corresponding rotational error in through Fig. 12. Since the accuracy of is closely related to , Fig. 6 contains certain regions that are unrealistic in reality. To show the trend with different parameters, the precision error in was taken in 0.2 mm bins, and the average value in each bin is shown. The robot arm used in the experiment (UR5) should be considered as a system with precision in the range of 0.17 to 0.43 mm. If better tracking systems are used, the performance of the ultrasound calibration as well as the STRATUS image quality will improve. The segmentation error must always be smaller than the worst-case result if we wish for the result to always be an improvement in image quality. The best-case result in Fig. 10 shows the acceptable limit for the system. The plots show that a precision error in of 0.41 to 0.60 mm is the limit. In this range, the segmentation error plays a major role in determining if the system is acceptable or not; however, we can see a trend that the effect of the segmentation is less compared to the worst-case and mean-case.
Fig. 10.
The image quality corresponding to precision in and segmentation error. The bold line represents the line of image quality for a single pose case.
Fig. 12.
Result of error propagation analysis based on BXp formulation.
Two approaches can be considered to improve ultrasound calibration: reducing the segmentation error and the covariance of . The first approach is related to using a better calibration phantom or imaging system. We also can improve the segmentation algorithm through accurate wavefront detection or reconstructed point segmentation. The second approach is to improve the optimization algorithm to solve . Optimizing solves a complicated function, which can easily result in local minima but not the global minimum. Therefore, if the optimization algorithm is able to decrease the variance of the computed , higher image quality improvement can be expected even in the worst case. In addition, the compensation of the segmentation error can also be expected.
6. Conclusions
We proposed a method to extend the aperture size during ultrasound image acquisition—named synthetic tracked aperture ultrasound (STRATUS) imaging—by sweeping the ultrasound array transducer while tracking its orientation and location, and combining this information into an SA beamformer. To support our conclusions, we estimated the effects of overall tracking errors involved in the system on final beamformed image quality through simulation. We also demonstrated the feasibility of the system by moving the ultrasound probe with a robot arm, and showed the lateral resolution improvement through a line phantom, and CNR improvement through a cystic region in a general ultrasound phantom.
A pure translational motion in the focus of this paper, and this motion can be a basic scanning strategy, as it can be applied to almost all planar surfaces. Another advantage of lateral-direction scanning is that only the rotational component of will be used, so the error in the translational component can be neglected. This property helps to reduce the possible errors between different poses. Motion that includes rotation will be useful in a sense that if the target region is known, more coherent information can be acquired. Each element has its angular sensitivity, and the element far from the region of interest has limited sensitivity to receive signals from the target region. If the motions include rotations to make the transducer elements face the target region, the signals will be more coherent for beamforming. Practically, the opportunity to scan the target with a remote center of motion is limited except cases where the tissue surface is a round shape. Hence, the combination of translational motion with rotation motion should be implemented as a realistic trajectory.
Acknowledgments
Authors acknowledge Ezgi Ergun for helpful discussion and Hyun Jae Kang for experimental support. Financial support was provided by Johns Hopkins University internal funds and NSF Grant No. IIS-1162095.
Biographies
Haichong K. Zhang is a PhD candidate in the Department of Computer Science at Johns Hopkins University. He earned his BS and MS degrees in laboratory science from Kyoto University, Japan, in 2011 and 2013, respectively. His research interests include medical imaging related to ultrasonics, photoacoustics, and medical robotics.
Alexis Cheng is currently a PhD student in the Department of Computer Science at Johns Hopkins University. He previously completed his Bachelor of Applied Science at the University of British Columbia. His current research interests include ultrasound-guided interventions, photoacoustic tracking, and surgical robotics.
Nick Bottenus received his BSE degree in biomedical engineering and electrical and computer engineering from Duke University, Durham, NC, USA, in 2011. He is currently a PhD student in biomedical engineering at Duke University and is a member of the Society of Duke Fellows. His current research interests include coherence-based imaging and beamforming methods.
Gregg E. Trahey received his BGS and MS degrees from the University of Michigan in 1975 and 1979, respectively. He received his PhD in biomedical engineering in 1985 from Duke University. He currently is a professor with the Department of Biomedical Engineering at Duke University and holds a secondary appointment with the Department of Radiology. His current research interests include adaptive phase correction and beamforming, and acoustic radiation force imaging methods.
Emad M. Boctor received his master’s and doctoral degrees in 2004 and 2006 from the computer science department of Johns Hopkins University. He currently is an engineering research center investigator and holds a primary appointment as an assistant professor in the Department of Radiology and a secondary appointment in both the computer science and electrical engineering departments at Johns Hopkins. His research focuses on image-guided therapy and surgery.
Appendix A: Tracking Systems and Ultrasound Calibration
Two rigid-body transformations are required to track an ultrasound image: a transformation from the tracking base to the tracking sensor, and a transformation from the tracking sensor to ultrasound image. Various tracking systems can be used to obtain the transformation from the tracking base to the tracking sensor, including electromagnetic (EM), optical, and mechanical tracking systems. EM tracking systems are based on the transmission of an EM field and the EM sensor localizing itself within this field. The advantages of an EM tracking system are that no line of sight is required, and the sensor size can be small. The drawbacks are interference from ferromagnetic metals, wired EM sensors, and its limited tracking accuracy compared to other tracking systems.18 Optical tracking systems are based on tracking fiducials or markers using single or multiple optical cameras. The accuracy is typically below 0.35 mm,19,20 and this number is stable and lower than that of the EM tracker. The main problem for optical trackers is that line of sight is required. On the contrary, mechanical tracking systems consisting of mechanical linkages can also be used for tracking. An example of an active mechanical tracking system is a robot arm, which tracks its end-effector or the end of its mechanical linkages. Robot arms have been reported to achieve precisions of 0.05 to 0.10 mm.21 While a robot arm is generally more intrusive than EM or optical tracking systems, it is also able to resolve controlled motions.
The process to acquire the rigid-body transformation between the tracking sensor and the ultrasound image is known as ultrasound calibration, a variation of the classic hand-eye calibration problem.22 Ultrasound calibration is a preoperative procedure and would be conducted prior to STRATUS imaging. Many factors can easily affect its accuracy, and the design of calibration phantoms is one of the most important components. A point-based calibration phantom is a classic phantom used by many groups.23,24 Since it is difficult to fix a single point in 3-D space, a cross-wire phantom or stylus phantom are used instead. Other than point-based calibration, a Z-bar phantom25 and wall phantom have also been proposed. The performance of ultrasound calibration largely depends on the ultrasound image quality and segmentation method. Point-based calibration is considered to be more accurate than other calibration methods because it is less dependent on image segmentation. The synthetic-aperture technique requires subwavelength localization accuracy to merge information from multiple poses, which is challenging to achieve in conventional ultrasound calibration. Therefore, a more accurate calibration technique is in demand.
Appendix B: Error Terms in Rigid-Body Transformation
To express the error in a transformation matrix as a single metric, we defined the precision error expressing the extent of errors in both rotation and translation. Assuming a point location from a transformation coordinate is , then the point location from the world coordinate is
| (12) |
When error in exists, the point location becomes
| (13) |
The precision error was calculated in units of mm as the standard deviation of for multiple and combinations, while the global point position was fixed. To evaluate the contribution from rotational and translational components in to the precision error, we run a simulation based on Eq. (13).
In this simulation, three components in both rotation and translation were randomized. The rotational components were represented by its three Euler angles, and the translational components were represented by its 3-D vector. The norm of the three components in both rotation and translation was used as the input to the simulation to represent the extent of errors. The magnitude of the norm was varied in a range from 0 deg to 1 deg for rotation and from 0 to 1 mm for translation. Six components in rotation and translation were randomized 100 times, and the mean of 100 trials is shown as the value of the precision error. The result is shown in Fig. 11. This result represents the magnitude of precision error when certain rotational and translational errors exist in a transformation.
Appendix C: Error Propagation Analysis of BXp Formulation
RP of a point can be regarded as an indirect way to guess the error in , but RP is not entirely reliable because RP depends on the motions taken, and on the segmentation error in . Thus, we conducted a mathematical analysis to derive the connection between the error in , , and to estimate the feasible error range of in the experiment.
In a point-based calibration, a fixed point location can be expressed as
| (14) |
where and are the rotational component of the transformation and , respectively. , , and are translational components of and , respectively; however, in reality, although is a constant number, suffers from errors. Therefore, under the condition that BXP contains error, the realistic formation becomes
| (15) |
where represents the error in the component. Rotations can be represented as , where is a unit vector for the axis of rotation and represents the magnitude. In this case, assuming the rotational error stands, Taylor’s infinite series expansion gives us
| (16) |
where
| (17) |
Thus, Eq. (15) can be rewritten as
| (18) |
Subtracting Eq. (16) from Eq. (14), and assuming that double skew term and multiplication with term is small enough to be negligible earns
| (19) |
Rearranging Eq. (19) becomes
| (20) |
The rotational error can be computed by providing error matrix , , and . In simulation, the following equation is used to considering realistic pose determination and corresponding behavior of
| (21) |
where is the number of poses used in calibration, and , , and are unit vectors of , , and , respectively. Each pose contributes a single row in the data matrices on either side of Eq. (21). For each pose, a different and will be provided, and the unit vector in , , and also changes while its magnitude is fixed.
The rotational error variation in was analyzed based on both the tracking system and the performance of calibration expressed as the segmentation error. Figure 12 shows the result of the analytical simulation that describes the contribution of the precision in and segmentation error to the final rotational component error in . This result indicates that the segmentation error is less influential compared to the precision error in for the same magnitude of error. The real segmentation error could be more sensitive to the error in , because the segmentation error in simulation was chosen as a randomized distribution, and the random distribution could converge when a large number of poses were used. In reality, the segmentation error could be biased in a particular direction due to multiple physical reasons; incorrect speed of sound estimation could cause error in the axial direction, and the lateral width of the point could be degraded because of the limited aperture size of ultrasound array transducer.
References
- 1.Jensen J. A., et al. , “Synthetic aperture ultrasound imaging,” Ultrasonics 44, e5–e15 (2006). 10.1016/j.ultras.2006.07.017 [DOI] [PubMed] [Google Scholar]
- 2.Nock L. F., Trahey G. E., “Synthetic receive aperture imaging with phase correction for motion and for tissue inhomogeneities. I. Basic principles,” IEEE Trans. Ultrason., Ferroelect. Freq. Control 39, 489–495 (1992). 10.1109/58.148539 [DOI] [PubMed] [Google Scholar]
- 3.Trahey G. E., Nock L. F., “Synthetic receive aperture imaging with phase correction for motion and for tissue inhomogeneities. II. Effects of and correction for motion,” IEEE Trans. Ultrason. Ferroelect. Freq. Control 39, 496–501 (1992). 10.1109/58.148540 [DOI] [PubMed] [Google Scholar]
- 4.Zhang H. K., et al. , “Synthetic aperture ultrasound imaging with robotic aperture extension,” Proc. SPIE 9419, 94190L (2015). 10.1117/12.2084602 [DOI] [Google Scholar]
- 5.Bottenus N., et al. , “Implementation of swept synthetic aperture imaging,” Proc. SPIE 9419, 94190H (2015). 10.1117/12.2081434 [DOI] [Google Scholar]
- 6.Rosenberg L. B., “Virtual fixtures: perceptual tools for telerobotic manipulation,” in Proc. IEEE Virtual Reality Annual Int. Symp. (1993). 10.1109/VRAIS.1993.380795 [DOI] [Google Scholar]
- 7.Jensen J. A., Svendsen N. B., “Calculation of pressure fields from arbitrarily shaped, apodized, and excited ultrasound transducers,” IEEE Trans. Ultrason. Ferroelec. Freq. Control 39, 262–267 (1992). 10.1109/58.139123 [DOI] [PubMed] [Google Scholar]
- 8.Guo X., et al. , “Active ultrasound pattern injection system (AUSPIS) for interventional tool guidance,” PLoS One 9(10), e104262 (2014). 10.1371/journal.pone.0104262 [DOI] [PMC free article] [PubMed] [Google Scholar]
- 9.Guo X., et al. , “Active echo: a new paradigm for ultrasound calibration,” in Medical Image Computing and Computer-Assisted Intervention–MICCAI, Golland P., et al., Eds., Vol. 8674, pp. 397–404, Springer International Publishing; (2014). [DOI] [PubMed] [Google Scholar]
- 10.Detmer P. R., et al. , “3D ultrasonic image feature localization based on magnetic scanhead tracking: in vitro calibration and validation,” Ultrasound Med. Biol. 20(9), 923–936 (1994). 10.1016/0301-5629(94)90052-3 [DOI] [PubMed] [Google Scholar]
- 11.Barry C. D., et al. , “Three-dimensional freehand ultrasound: image reconstruction and volume analysis,” Ultrasound Med. Biol. 23(8), 1209–1224 (1997). 10.1016/S0301-5629(97)00123-3 [DOI] [PubMed] [Google Scholar]
- 12.Huang Q. H., et al. , “Development of a portable 3D ultrasound imaging system for musculosketetal tissues,” Ultrasonics 43, 153–163 (2005). 10.1016/j.ultras.2004.05.003 [DOI] [PubMed] [Google Scholar]
- 13.Krupa A., “Automatic calibration of a robotized 3D ultrasound imaging system by visual servoing,” in Proc. IEEE Int. Conf. on Robotics and Automation, pp. 4136–4141 (2006). 10.1109/ROBOT.2006.1642338 [DOI] [Google Scholar]
- 14.Ackerman M. K., et al. , “Online ultrasound sensor calibration using gradient descent on the Euclidean Group,” in Proc. IEEE Int. Conf. on Robotics and Automation (ICRA), pp. 4900–4905 (2014). 10.1109/ICRA.2014.6907577 [DOI] [Google Scholar]
- 15.Ameri G., et al. , “Synthetic aperture imaging in ultrasound calibration,” Proc. SPIE 9036, 90361l (2014). 10.1117/12.2043899 [DOI] [Google Scholar]
- 16.op den Buijs J., et al. , “Predicting target displacements using ultrasound elastography and finite element modeling,” IEEE Trans. Biomed. Eng. 58(11), 3143–3155 (2011). 10.1109/TBME.2011.2164917 [DOI] [PubMed] [Google Scholar]
- 17.Ming L., Kapoor A., Taylor R. H., “A constrained optimization approach to virtual fixtures,” in Proc. Intelligent Robots and Systems (IROS), pp. 1408–1413 (2005). [Google Scholar]
- 18.Hummel J., et al. , “Evaluation of a new electromagnetic tracking system using a standardized assessment protocol,” Phys. Med. Biol. 51, N205–N210 (2006). 10.1088/0031-9155/51/10/N01 [DOI] [PubMed] [Google Scholar]
- 19.Elfring R., de la Fuente M., Radermacher K, “Assessment of optical localizer accuracy for computer aided surgery systems,” Comput. Aided Surg. 15, 1–12 (2010). 10.3109/10929081003647239 [DOI] [PubMed] [Google Scholar]
- 20.Wiles A. D., Thompson D. G., Frantz D. D., “Accuracy assessment and interpretation for optical tracking systems,” Proc. SPIE 5367, 421 (2004). 10.1117/12.536128 [DOI] [Google Scholar]
- 21.Morten L., “Automatic robot joint offset calibration,” in Int. Workshop of Advanced Manufacturing and Automation, Tapir Academic Press; (2012). [Google Scholar]
- 22.Tsai R., Lenz R., “A new technique for fully autonomous and efficient 3D robotics hand/eye calibration,” IEEE Trans. Rob. Autom. 5(3), 345–358 (1989). 10.1109/70.34770 [DOI] [Google Scholar]
- 23.Mercier L., et al. , “A review of calibration techniques for freehand 3-D ultrasound systems,” Ultrasound Med. Biol. 31(2), 143–165 (2005). 10.1016/j.ultrasmedbio.2004.11.001 [DOI] [PubMed] [Google Scholar]
- 24.Hsu P. W, et al. , “Freehand 3D ultrasound calibration: a review,” in Advanced Imaging in Biology and Medicine, Chapter 3, Sensen C. W., Hallgrímsson B., Eds., pp. 47–84, Springer Berlin Heidelberg; (2009). [Google Scholar]
- 25.Boctor E., et al. , “A novel closed form solution for ultrasound calibration,” in Proc. IEEE Int. Symp. in Biomedical Imaging: Nano to Macro, pp. 527–530 (2004). 10.1109/ISBI.2004.1398591 [DOI] [Google Scholar]


