

Abstract
Expression of apoptosis-regulating proteins (B-cell CLL/lymphoma 2 - BCL-2, Myeloid Cell Leukemia 1 - MCL-1, BCL-2 like 1 - BCL-X and BCL-2-associated X protein - BAX) in acute myeloid leukemia (AML) blasts at diagnosis is associated with disease-free survival. We previously found that the initially high apoptosis-resistance of AML cells decreased after therapy, while regaining high levels at relapse. Herein, we further explored this aspect of dynamic apoptosis regulation in AML. First, we showed that the intraindividual ex vivo apoptosis-related profiles of normal lymphocytes and AML blasts within the bone marrow of AML patients were highly correlated. The expression values of apoptosis-regulating proteins were far beyond healthy control lymphocytes, which implicates the influence of microenvironmental factors. Second, we demonstrated that apoptosis-resistant primary AML blasts, as opposed to apoptosis-sensitive cells, were able to up-regulate BCL-2 expression in sensitive AML blasts in contact cultures (p = 0.0067 and p = 1.0, respectively). Using secretome proteomics, we identified novel proteins possibly engaged in apoptosis regulation. Intriguingly, this analysis revealed that major functional protein clusters engaged in global gene regulation, including mRNA splicing, protein translation, and chromatin remodeling, were more abundant (p = 4.01E-06) in secretomes of apoptosis-resistant AML. These findings were confirmed by subsequent extracellular vesicle proteomics. Finally, confocal-microscopy-based colocalization studies show that splicing factors-containing vesicles secreted by high AAI cells are taken up by low AAI cells. The current results constitute the first comprehensive analysis of proteins released by apoptosis-resistant and sensitive primary AML cells. Together, the data point to vesicle-mediated release of global gene regulatory protein clusters as a plausible novel mechanism of induction of apoptosis resistance. Deciphering the modes of communication between apoptosis-resistant blasts may in perspective lead to the discovery of prognostic tools and development of novel therapeutic interventions, aimed at limiting or overcoming therapy resistance.
Despite good remission rates observed in acute myeloid leukemia (AML) patients, the 5-year event-free survival rates reach only 35–40% in adults and 60–70% in children (1, 2). Apoptosis is one of the crucial mechanisms influencing survival of AML cells, and its deregulation can possibly lead to chemotherapy resistance and eventually relapse (3–5). The ability of cells to undergo apoptosis is largely defined by the relative expression of anti- (i.e. BCL-2, BCL-X long isoform - BCL-XL, or MCL-1) and proapoptotic (i.e. BAX, BH3 interacting domain death agonist - BID, caspases) proteins. Several studies have shown that the levels of BCL-2 and BCL-2/BAX ratio are a determinant of apoptosis-resistance in AML blasts and are associated with survival in AML patients (3, 6). We have previously demonstrated that the expression of several apoptosis-related proteins, such as BCL-2, BCL-XL, MCL-1, and BAX, can be reliably measured in AML samples by flow cytometry (6). These four quantitative parameters, which constitute an anti-apoptosis index (AAI)1, have proven to be a reliable predictor of AML patients' survival, with a high apoptosis-resistant profile (i.e. higher AAI) of diagnosis leukemic blasts being associated with shorter disease-free survival (7). Accordingly, AAI determined at the time of diagnosis also correlated with the frequency of minimal residual disease (MRD), which is a reflection of drug-resistant leukemic cells that have survived chemotherapy (7). MRD can be detected at a low frequency in bone marrow (BM) at the time of remission and is thought to contain the relapse-initiating cells (8–10). These observations imply that leukemic cells that harbor an apoptosis-resistant protein profile at diagnosis can better survive chemotherapy, thereby eventually causing a relapse. Consequently, we further hypothesized that the AAI of MRD cells would be either elevated or at least similar to the profile of leukemic cells at diagnosis. Surprisingly, in complete remission patients, the AAI decreased in the MRD situation compared with apoptosis-resistant profile as measured in leukemic blasts at diagnosis. The values of the AAI profile increased again at relapse, indicating apoptosis-resistance (11). Based on these unexpected findings, we hypothesized that expression of apoptosis-related proteins in AML blasts, and possibly also in bystander cells in the bone marrow, is regulated by extracellular factors present in the AML microenvironment.
Tumor cell communication with its microenvironment is emerging as an important determinant playing multiple roles in cancer. In this respect, both soluble factors and extracellular vesicles (EVs), most notably exosomes, have been shown to influence cellular processes of malignant and normal cells in the tumor microenvironment (12–14). Apoptosis in the AML setting can be regulated by several cytokines as well as by EVs, which carry variable cargoes, including multiple proteins (15–18). In line with our hypothesis, apoptosis of BM cells was shown to be inhibited in the presence of secretome derived from AML blasts (19). These observations suggest that factors secreted by apoptosis-resistant leukemic blasts are likely to confer a drug resistance phenotype upon initially sensitive blasts. Therefore, the aim of our current study was to characterize the microenvironment produced by apoptosis-resistant AML blasts in terms of its capacity to influence apoptosis regulation in neighboring cells and protein content.
EXPERIMENTAL PROCEDURES
Antibodies and Reagents
APC (allophycocyanin)-conjugated anti-human CD34 (cluster of differentiation - CD34 molecule), anti-CD45-PerCP (peridinin chlorophyll protein), and BCL-2-PE (phycoerythrin) antibodies were purchased from Becton Dickinson (Franklin Lakes, NJ). BCL-2-FITC (fluorescein, IgG1, clone 124) and FITC-conjugated anti-rabbit antibodies were from DAKO (Glostrup, Belgium). The rabbit polyclonal antibodies against BAX (P-19), BCL-XS/L (S-18), MCL-1 (S-19), and normal rabbit immune globulins (nrIgG) were purchased from Santa Cruz Biotechnology (Santa Cruz, CA). Mouse monoclonal antibody against SF3B3 (splicing factor 3b subunit 3, sc-514034) and rabbit polyclonal antibody against HNRNP A3 (heterogeneous nuclear ribonucleoprotein A3, sc-133665) were from Santa Cruz Biotechnology). Donkey polyclonal anti-mouse IgG antibody conjugated with Alexa Fluor 647 (A-31571) and goat anti-rabbit IgG polyclonal conjugated with Alexa Fluor 594 (A-11012) were purchased from Life Technologies (Carlsbad, CA). Sodium azide and saponin were purchased from Sigma-Aldrich (St. Louis, MO). 7-AAD (7-amino actinomycin D, Via-Probe™) was from Pharmingen (San Diego, CA). 5-(and 6)-CFSE (CFSE) were from Molecular Probes Europe BV (Leiden, The Netherlands). RPMI 1640 and Iscov's modified Eagle's medium (IMDM) media were purchased from Gibco (Carlsbad, CA).
AML Patients and Healthy Controls
A total of 61 newly diagnosed AML patients were included in the current study after obtaining a written informed consent. AML patients ≤ 60 years were treated according to the Dutch HOVON 29 (1998–2000) and HOVON 42 (2001–2003) protocols, while patients > 60 years according to the HOVON 32 (1996–2001) and HOVON 43 (2000–2003) protocols. Patients with acute promyelocytic leukemia were treated according to HOVON 52 (2001–2003) protocol (www.hovon.nl). Patient characteristics are shown in Supplemental Table S1. Complete remission was defined as less than 5% blasts present in the BM, absence of extramedullary disease with concomitant evidence of granulopoiesis, and megakaryopoiesis: Granulocytes and platelets in peripheral blood should be at least 1.5 × 10⁹/l and 100 × 109/l, respectively. Relapse was defined as marrow infiltration by more than 5% blasts in previously morphologically normal BM.
From the 61 AML patients, 62 follow up BM (FU BM) samples were collected after different cycles of chemotherapy (including 49 remission BM samples obtained after the first, second, or third cycle, six refractory BM samples taken either after the first or the second cycle of chemotherapy and seven relapse samples). Control BM samples, not infiltrated by tumor cells, were obtained after informed consent from healthy individuals or from patients undergoing cardiac surgery.
Flow Cytometry
We used flow cytometry for blast, lymphocyte, and MRD detection in AML patient samples and for AAI measurement. Preparation (including Ficoll density separation) and phenotypic analysis of diagnosis AML was performed as previously described (10). Shortly, the analysis was performed on BM mononuclear cells upon staining with FITC-, PE-, PerCP- and APC- conjugated monoclonal antibodies. Lymphocytes, at diagnosis, follow up, and at relapse were identified by a high CD45 expression and a low side scatter (20). At diagnosis, AML blasts characterized by a low CD45 staining and a low SSC (20) were screened for aberrant leukemia-associated phenotypes that are not or are in very low frequencies present in normal BM (8).. MRD cells were detected using these aberrant antigen combination(s).
The detection and quantification of apoptosis-related proteins expression by flow cytometry has also been described previously (6, 21).
Secretome and Cell Lysate Production
Secretome harvesting was performed as described previously (22). Cryopreserved primary samples were thawed and washed twice in serum-free IMDM (Gibco). Cells were resuspended in serum-free IMDM (lacking phenol red) at a concentration of 2 × 10⁶/ml and incubated at 37 °C in 5% CO2 for 18 h. Subsequently, 5 × 10⁶ cells were lysed in 200 μl of lysis buffer, containing 150 mm NaCl (Merck, Darmstadt, Germany) 10 mm Tris/HCl, pH 7.5 (MP biomedicals, Santa Ana, CA), 5 mm EDTA (Merck), 1% Triton X-100 (Sigma-Aldrich) with the addition of protease inhibitor mixture (Roche, Basel, Switzerland). Finally, the samples were centrifuged (25,000 × g, 5 min, 4 °C), followed by supernatant collection for subsequent SDS-PAGE. Cell conditioned medium was processed as described by Piersma et al. (23). Briefly, the conditioned medium was harvested by centrifugation (10 min, 480 × g), filter sterilized (Millex-HA Syringe Filter Unit, 0.45 μm, Millipore, Billerica, MA), and stored at −80 °C until further analysis. Finally, the conditioned medium was concentrated using Amicon Ultra-4 centrifugal filters (cutoff 3 kDa) according to the manufacturer's instructions (Milipore). The resulting secretome samples were lysed using reducing sample buffer (NuPAGE reducing agent 10x + NuPAGE LDS sample buffer 4x, Invitrogen, Carlsbad, CA).
Protein Fractionation
Secretome and lysate proteomics was performed as bench marked previously (22). Proteins were resolved using 1D SDS-PAGE. For each sample, 60–80 μg of protein was loaded onto a precast 4–12% NuPAGE Novex Bis-Tris 1.5 mm mini gel (Invitrogen). Electrophoresis was carried out at 200V in NuPAGE MES SDS running buffer (50 mm Tris base, 50 mm MES, pH 7.3, 0.1% w/v SDS, and 1 mm EDTA, Invitrogen) until the dye front reached the end of the gel. Fixation and staining with Coomassie Brilliant Blue G250 (Pierce, Rockford, IL) was performed as described previously (24).
In-Gel Digestion, Nano-LC-MS/MS and Database Searching
Proteomics analysis based on 1D gel-nano-LC-MS/MS was performed as described previously (24, 25). Briefly, the gel lanes were sliced into nine pieces and subsequently digested in-gel with trypsin. Peptides were extracted from the gel bands, concentrated in a vacuum centrifuge, and adjusted to 50 μl using 0.05% formic acid. Peptides were separated by an Ultimate 3000 nano-LC-MS/MS system (Dionex LC-Packings, Amsterdam, The Netherlands) equipped with a 20 cm × 75 μm inner diameter fused silica column custom packed with 3 μm 120 Å ReproSil Pur C18 aqua (Dr Maisch GMBH, Ammerbuch-Entringen, Germany). After injection (10 μl), peptides were trapped at 6 μl/min on a 10 mm × 100 μm inner diameter trap column packed with 5 μm 120 Å ReproSil Pur C18 aqua at 2% buffer B (buffer A: 0.05% formic acid in Milli-Q water - MQ; buffer B: 80% acetonitrile, ACN + 0.05% formic acid in MQ) and separated at 300 nl/min in a 10–40% buffer B gradient in 60 min (90 min inject-to-inject) at 1.7 kV in a Nanomate Triversa Chip-based nanospray source using a Triversa LC coupler (Advion, Ithaca, NJ). In the primary analysis (secretome) peptides were measured on a LTQ-FTMS instrument (ThermoFisher, San Jose, CA, USA). Intact masses were measured at resolution 50.000 in the ICR cell using a target value of 1 × 10⁶ charges. In parallel, following an Fourier transform (FT) prescan, the top five peptide signals (charge-states 2+ and higher) were submitted to MS/MS in the linear ion trap (3 amu isolation width, 30 ms activation, 35% normalized activation energy, Q value of 0.25, and a threshold of 5,000 counts). Dynamic exclusion was applied with a repeat count of 1 and an exclusion time of 30 s. A database search was performed as described previously (25, 26). MS/MS spectra were searched against the human International Protein Index (IPI) human 3.59 database (80,128 entries) using Sequest (version 27, revision 12, default settings)—a part of the BioWorks 3.3 data analysis package (Thermo Fisher). MS/MS spectra were searched with a maximum allowed deviation of 10 ppm for the precursor mass and 1 atomic mass unit for fragment masses. Variable modifications included methionine oxidation and cysteine carboxamidomethylation, two missed cleavages were allowed, and the minimum number of tryptic termini was 1. Next, the DTA and OUT files were imported into Scaffold version 2.06.01 (Proteome Software, Portland, OR) and used to organize the gel band data and to validate peptide identifications using the Peptide Prophet algorithm with default settings (27, 28). Protein identifications with a probability of >99% were retained if at least two peptides were identified (at 95% confidence) in minimum one sample. Peptide identifications matching multiple isoforms of the same protein were reduced to the reported isoform using the principles of parsimony. For each protein identified, the total number of MS/MS spectra detected (spectral counts) was exported to Excel 2003 (Microsoft, Redmond, WA). In the secondary analysis (exosomes and secretomes), peptides were analyzed by nano-LC-MS/MS using a Q Exactive mass spectrometer. Nano-LC conditions were similar as in the LTQ-FTMS analysis, only formic acid was substituted for 0.5% acetic acid. Eluting peptides were ionized at a potential of +2 kVa into a Q Exactive mass spectrometer (ThermoFisher) using the Nanospray Flex Ion source and a stainless steel emitter (ThermoFisher). Intact masses were measured at resolution 70.000 (at m/z 200) in the Orbitrap using an automatic gain control (AGC) target value of 3 × 10⁶ charges. The top 10 peptide signals (charge states 2+ and higher) were submitted to MS/MS in the higher-energy collision (HCD) cell (4 amu isolation width, 25% normalized collision energy). MS/MS spectra were acquired at a resolution of 17.500 (at m/z 200) in the Orbitrap using an AGC target value of 2 × 10⁵ charges, a normalized collision energy of 25, and an underfill ratio of 0.1%. Dynamic exclusion was applied with a repeat count of 1 and an exclusion time of 30 s. MS/MS spectra were searched against the IPI human 3.68 database (87,061 entries) using default settings (including the default contaminant list) in MaxQuant 1.2.2.5 or against the Uniprot human reference proteome (downloaded January 2014, no fragments, 42,104 entries) using MaxQuant 1.5.2.8 (29). MS/MS spectra were searched with a maximum allowed deviation of 4.5 ppm for the precursor mass and 20 ppm for fragment masses. Cysteine carboxamidomethylation was treated as fixed modification and methionine oxidation and N-acetylation were treated as variable modifications. One missed cleavage was allowed, and the minimum number of tryptic termini was 2. Peptide and protein group identifications were filtered to a false discovery rate of 1% using the target-decoy method. Peptide identifications matching multiple isoforms of the same protein were reduced to the reported protein group using the principles of parsimony. For each protein group identified, the total number of MS/MS spectra detected (spectral counts) was exported to Excel 2003. The mass spectrometry proteomics data have been deposited to the ProteomeXchange Consortium (30) via the PRIDE partner repository with the dataset identifier PXD001476 (for the whole secretome analysis), PXD003471 (for the corresponding lysate), PXD001487 (for the exosome analysis), and PXD003478 (for the exosome and soluble secretome analysis of a high AAI patient).
Data Mining
Normalization was performed as described previously (24). The beta-binomial test was applied to find proteins with statistically significant differences in spectral count numbers between the high and low AAI secretome (31). Proteins associated with a p value below 0.05 were considered significantly differentially expressed. Hierarchical clustering was performed using R statistical software. For clustering analysis, the protein abundances were normalized to zero means and unit variance for each individual protein. IPI identifiers were mapped to human gene symbols, which were uploaded to the STRING (Search Tool for the Retrieval of Interacting Genes/Protein) tool (version 9.0) to retrieve protein–protein interactions (32). STRING interaction networks were imported and annotated in Cytoscape version 2.8.3 (33). Gene ontology analysis was performed within Cytoscape using the BiNGO (Biological Networks Gene Ontology tool) plugin (34). The ClusterONE plugin was used to identify groups (p value <0.1) of well-connected proteins (35). The analysis of secretion signals was performed using the SignalP and SecretomeP tools (http://www.cbs.dtu.dk/services/).
BCL-2 Up-Regulation in Contact Culture
Cryopreserved primary BM samples with either high or low AAI were thawed. High AAI samples were washed once in RPMI 1640 (Gibco) with 10% FCS, followed by incubation of cells for 15 min at 37 °C in PBS containing 2.5 μm CFSE (Molecular Probes Europe BV). Next, cells were incubated for 30 min at 37 °C in PBS with 40% FCS and washed twice with PBS containing 0.1% HSA (human serum albumin). Finally, cells were resuspended in IMDM (lacking phenol red) containing 10% FCS. Low AAI samples were washed twice in RPMI 1640 containing 10% FCS and resuspended in IMDM (lacking phenol red) containing 10% FCS. High AAI cells were incubated with low AAI cells in a 4:1 ratio at 37 °C in 5% CO2 for 48 h. Cells were stained for 15 min with CD34-APC and CD45-PerCP, followed by fixation in 1% paraformaldehyde (Merck) and permeabilization with 0.1% saponin. Subsequently, samples were stained with BCL-2-PE antibody or the isotype control (IgG1-PE) and analyzed using flow cytometry. Blast cells were selected as CD45low and low side scatter. The CFSE signal was used to distinguish the high AAI blasts (high CFSE) from the low AAI blasts (low CFSE).
Extracellular Vesicle Preparation by Ultracentrifugation
Extracellular vesicle preparation by differential ultracentrifugation was performed as described previously (36, 37). Cells were washed twice in cold serum-free IMDM (Gibco) and resuspended in IMDM (lacking phenol red) at a cell density of 2 × 10⁶/ml. Cells were incubated at 37 °C in 5% CO2 for 18 h, followed by centrifugation (RT, 500 × g, 10 min). The conditioned medium was collected and filtered through a 0.45 μm filter. The obtained fraction was subjected to three consecutive centrifugation steps, each followed by collection of the supernatant (first step: 4 °C, 2,000 × g, 15 min; second step: 4 °C, 20,000g, 75 min; third step: 4 °C, 100,000 × g, 90 min). After the last centrifugation, the pellet was resuspended in ice cold PBS and further centrifuged (4 °C, 100,000 × g, 90 min) followed by discarding of the supernatant. For the proteomics analysis, the pellet was dissolved in a volume of 60 μl NuPage SDS sample buffer and further processed for gel-LC-MS/MS as described above. For vesicle uptake analysis, the pellet was processed further as described below.
Vesicle Uptake Analysis
HeLa cells (purchased from DSMZ, Braunschweig, Germany) were maintained in RPMI 1640 (Gibco) with addition of 10% FCS. Cryopreserved primary BM samples with either high or low AAI were thawed. High AAI cells were washed twice in serum-free RPMI 1640 and stained with PKH67 (Sigma-Aldrich) according to the instructions of the manufacturer. Briefly, the cells were incubated in presence of 2 μm PKH67 in Diluent C for 5 min, after which the staining was stopped by adding RPMI 1640 with 10% HSA. Next, the cells were washed three times with RPMI 1640 + 10% FCS and resuspended in IMDM without phenol red. Low AAI samples were washed twice in RPMI 1640 containing 10% FCS and resuspended in IMDM (lacking phenol red) containing 5% vesicle-free FCS. High AAI cells were incubated with HeLa cells in a 4:1 ratio at 37 °C in 5% CO2 for 24 h. Subsequently, the HeLa cells were washed three times with PBS (to assure removal of the high AAI AML cells) prior to trypsinization and harvesting. PKH67 uptake was controlled in HeLa cells by flow cytometry and cytospins of HeLa cells were prepared for immunocytochemistry. For assessment of vesicle uptake in low AAI cells, high AAI cells were allowed to produce exosomes for 24 h. Subsequently, EVs were purified as described above and stained with PKH67. Finally, unlabeled low AAI cells were incubated with purified PKH67-stained EVs (volume of the EV suspension used corresponded to the 4:1 ratio of high AAI:low AAI cells) at 37 °C in 5% CO2 for 24 h. The incubation was followed by flow cytometry analysis and cytospin preparation.
Immunocytochemistry and Fluorescence Microscopy
Cytospins were fixed for 10 min with 4% of paraformaldehyde (Merck), permeabilized for 10 min with 0.1% of Triton-X (Sigma-Aldrich), and blocked with 10% FCS for 1 h. Primary antibodies were incubated for 2 h and secondary antibodies for 1 h, each at 4 °C. Confocal images were obtained using a Leica TCS SP8 STED 3X superresolution microscope (Leica, Mannheim, Germany). Obtained data were processed and quantified using dedicated LAS-X (Leica) and Huygens (Scientific Volume Imaging (SVI), Hilversum, The Netherlands) software. The data acquisition protocol included 3D stacks of optical planes to obtain 3D confocal definition.
Staining and image acquisition using the digital imaging fluorescence microscope work station are detailed in supplemental material (see supplemental experimental procedures).
Statistics
The Shapiro–Wilk test was used to assess the distribution of the data. Since all variables were not normally distributed, a Spearman's Rho test was used to assess correlations. A Wilcoxon paired test was used to compare differences in BCL-2 expression in low AAI blasts upon incubation with high AAI cells. For both tests a two-sided p value <0.05 was considered significant. All statistical tests were performed using the IBM SPSS Statistics20 software.
RESULTS
Expression of Apoptosis-Associated Proteins in Lymphocytes Resembles Profiles of AML Blasts
We first investigated whether or not the apoptosis-resistant protein profile (AAI) of AML blasts was concurrent with nonmalignant cells (e.g. lymphocytes) in the BM. This would imply that the AAI is likely to be influenced by tumor microenvironmental factors. To this end, the expression of apoptosis-related proteins was determined by flow cytometry in leukemic blasts and lymphocytes of AML patients (Fig. 1A). BCL-2 expression in lymphocytes of AML patients was significantly higher than in lymphocytes derived from healthy controls (mean fluorescence index 24.2 and 10.7, respectively; p = 0.016). Assessment of levels of the remaining apoptosis-related proteins including BCL-XL, MCL-1 and BAX did not show any significant differences (Supplemental Table S2). Next, the expression levels and subsequent AAI were examined for correlation between lymphocytes and blasts from 61 AML specimens as well as in 10 normal bone marrow (nBM) samples (Fig. 1A). We observed that the AAI in leukemic blasts correlated with that of lymphocytes (r = 0.885, p < 0.01). Accordingly, the expression of each of the components comprising the AAI also showed a strong and significant (p < 0.01) association between the two analyzed cell types. In nBM samples, significant correlations were only found for BCL-2 (n = 10, r = 0.671, p = 0.034) and MCL1 (n = 10, r = 0.879, p < 0.01) but not for BAX (n = 9, r = 0.597, p = 0.09), BCL-X (n = 10, r = 0.067, p = 0.853), and the AAI (n = 9, r = -0.05, p = 0.898). In addition, we determined BCL-2 levels in lymphocytes at different time points during the course of therapy (Fig. 1B). Strikingly, BCL-2 expression of lymphocytes followed the same pattern of changes as we previously reported for leukemic blasts (11). High BCL-2 expression in lymphocytes at diagnosis decreased in patients who achieved complete remission and remained low in individuals displaying a stable complete remission, even after completing induction therapy. A limited amount of samples derived at relapse was available for analysis, hence posing difficulties at estimating the differences. In three out of seven relapsed patient specimens, BCL-2 levels were comparably high to the levels present at diagnosis. In the remaining four cases, the values corresponding to relapse were markedly decreased as compared with the levels measured at diagnosis (Fig. 1B). For two of these four patients, BCL-2 expression at diagnosis was high, while in the other two, it was relatively low (Fig. 1B samples indicated with dark gray and light gray arrows, respectively).
Fig. 1.

Expression of apoptosis-related genes in lymphocytes and leukemic blasts of AML patients. (A) Correlation between apoptosis-related protein expression (mean fluorescence index—MFI) of lymphocytes and leukemic blasts (both freshly isolated upon diagnosis) of AML patients (black dots) and normal bone marrows (nBM - gray dots). The expression of BCL-2, BCL-Xl, MCL-1, and BAX in blast cells of AML patients and corresponding lymphocytes (derived from the same individuals) shows a strong association (p < 0.001) as depicted by Spearman's rho correlation coefficient (R). Sample numbers, correlation coefficients, and p values for AML samples are indicated. (B) BCL-2 expression in lymphocytes of AML patients (who either have relapsed or remained in stable complete remission), measured at several time points in the course of therapy. In the right panel, black arrows indicate three patients, for whom BCL-2 levels were high both at diagnosis and relapse, and gray arrows point to four patients, for whom BCL-2 levels were decreased at relapse compared with their matching diagnosis samples (dark gray arrows—patients with high BCL-2 at diagnosis, light gray arrows—patients with relatively low BCL-2 at diagnosis); FU - follow up sample. Panels C and D depict results of contact culture experiments performed on thawed samples. (C) BCL-2 expression in low AAI leukemic blasts cultured in presence of high AAI blasts (+ high AAI) or low AAI cells cultured alone (control). (D) BCL-2 expression in low AAI leukemic blasts cultured in presence of other low AAI blasts (+ low AAI) or low AAI cells cultured alone (control).
BCL-2 Protein Expression of Apoptosis-Sensitive AML Blasts Is Up-Regulated Upon Coculture with Apoptosis-Resistant AML Cells
To test the ability of apoptosis-resistant AML blasts to influence apoptosis-related protein profile in sensitive blasts, we cocultured both types of cells for 48 h, followed by a flow cytometric analysis of BCL-2 expression. Direct contact cultures were applied to assure the highest gradient of secreted factors possible. We selected six patients with an AAI level above 98, which was previously shown to be of adverse prognostic significance (7). In addition, five patients with low AAI were selected as the source for drug sensitive AML blasts. The values for high AAI (220.3–687.4) and low AAI (1.6–34.6) samples used in this study are summarized in Supplemental Table S3. AML blasts with high AAI were labeled with CFSE prior to the incubation in order to distinguish between the two cell types in subsequent flow cytometric analyses. Blasts from each high AAI sample were cocultured with several (one to three) different low AAI samples. Together, we studied 12 combinations, including six different high AAI patients and five low AAI patients (details in Table I). Overall, BCL-2 expression was significantly elevated in low AAI blasts cocultured with apoptosis-resistant blasts as compared with low AAI blasts cultured alone (1.7 fold, p = 0.0067; Fig. 1C). Three high AAI samples induced a more pronounced increase in BCL-2 levels in the low AAI samples upon contact culture (2.1–2.7 fold, details in Table I). However, two high AAI samples induced only a marginal increase (below 1.5-fold), and one sample brought about a slight decrease in BCL-2 expression in low AAI samples (Table I) under the study conditions.
Table I. Overview of high AAI and low AAI AML patient samples used in the 48 h contact culture experiments.
| AML samples in contact cultures | Functiona | Bcl-2 MFI in blasts at diagnosis | Co-incubated with | Mean Bcl-2 MFI in low AAI controls | Mean Bcl-2 MFI in low AAI upon co-incubation | Fold change | |
|---|---|---|---|---|---|---|---|
| High AAI | AML 1 | donor | 18.8 | AML 13, 14 | 3.85 | 10.32 | 2.68 |
| AML 2 | donor | 15.1 | AML 13, 14 | 3.06 | 6.67 | 2.18 | |
| AML 3 | donor | 24 | AML 9, 14, 16 | 3.58 | 7.57 | 2.11 | |
| AML 4 | donor | 21.8 | AML 13, 14, 15 | 3.61 | 4.37 | 1.21 | |
| AML 5 | donor | 18.9 | AML 14 | 3.01 | 3.76 | 1.25 | |
| AML 6 | donor | 16 | AML 13 | 3.95 | 2.07 | 0.52 | |
| Low AAI | AML 7 | donor | 3.6 | AML 14 | 3.01 | 1.5 | 0.5 |
| AML 8 | donor | 2.6 | AML 14 | 3.01 | 1.97 | 0.65 | |
| AML 9 | donor | 11.5 | AML 9, 14, 16 | 3.07 | 3.38 | 1.49 | |
| AML 13 | acceptor | 5 | AML1, AML2, AML4, AML6 | − | − | − | |
| AML 14 | acceptor | 4.5 | AML1–5, AML7–9 | − | − | − | |
| AML 15 | acceptor | 5.8 | AML4 | − | − | − | |
| AML 16 | acceptor | 2.2 | AML3, AML9 | − | − | − |
a Samples used as donors (CFSE-labeled cells tested for ability to induce BCL-2 upregulation in cells with low AAI) or acceptors (unlabeled cells examined for BCL-2 upregulation upon co-incubation with donor cells).
To confirm that the observed BCL-2 up-regulation was specifically due to coculturing with high AAI blasts, we labeled three low AAI AML samples with CFSE and cultured these in contact with three different unlabeled low AAI samples, summing up to a total of five combinations (Table I). Only one marginal change (1.49-fold), and slight decreases in BCL-2 expression (0.5–0.65-fold, n = 2, Fig. 1D) with no statistical significance (p = 1.0) were observed in any of the combinations tested, indicating that the ability to upregulate BCL-2 is selectively associated with AML blasts displaying high AAI. Moreover, we performed a measurement of BCL-2 levels upon thawing of samples and after a 24 h incubation period to assess for possible spontaneous changes in protein expression. For both high and low AAI samples, BCL-2 levels were increased after thawing as compared with freshly isolated cells (Supplemental Table S4). Furthermore, BCL-2 levels remained relatively stable upon 24 h of culture with an exception of two high AAI samples (in one sample BCL-2 further increased by 47% during the culture time, while in the other it decreased by 46%). Overall, consistent with the AAI determined in fresh cells at diagnosis, BCL-2 expression was lower in low AAI cells compared with high AAI cells. Together, these experiments indicate that high BCL-2 expression is associated with high AAI cells under these culture conditions.
Apoptosis-Resistant AML Blasts Display Unconventional Protein Secretion
In order to identify proteins secreted by apoptosis-resistant AML blasts potentially engaged in regulation of apoptosis in recipient cells, we compared five whole secretome samples released by high AAI (220.3–687.4) AML blasts with secretomes of six low AAI (2.1–34.6) samples (Fig. 2A; left column and Supplemental Table S3). The secretome samples were generated during an 18 h incubation of cells in serum-free culture media. Under these conditions the vitality of cells decreased significantly, which is a common phenomenon for primary AML cells cultured in serum-free media; however, the decrease in number of intact cells after the incubation was comparable in high AAI (decrease by 63.8%, final cell count 3.8 mln cells) and low AAI (decrease by 56.4%, final cell count 2.9 mln cells) samples. Moreover, for proteomics analysis, we aimed to load equal protein loads on gel and normalized the spectral counts in both types of samples to correct for the differences in the total amount of proteins in the secretome. The secretome protein profiles were analyzed using label-free comparative proteomics, which employed fractionation by SDS-PAGE in combination with nano-LC-MS/MS of in-gel digested proteins and spectral counting as described before (22). This workflow has proven to be a reproducible approach for secretome proteomics (22). As indicated by the overlap analysis (Fig. 2B), we identified 1,492 proteins (Supplemental Tables S5 and S6) in all 11 samples, with the vast majority (n = 1,283) identified in both high and low AAI AML secretomes. Statistical analysis of the normalized protein spectral counts revealed that 214 proteins were significantly (p < 0.05) up-regulated in secretomes of the high AAI AML blasts, whereas 44 proteins were significantly up-regulated in the low AAI secretomes. Supervised hierarchical clustering analysis using differential proteins revealed that the majority of high AAI as well as low AAI specimens cluster together (Fig. 2C).
Fig. 2.

Overview of proteomics analysis performed on the whole secretome of high AAI and low AAI leukemic blasts of AML patients. (A) Study design. (B) Overlap analysis of proteins identified in secretomes of high and low AAI blasts. The numbers represent protein identified in both types of secretomes (overlapping proteins), as well as proteins specific for either high (absent from low AAI secretomes) or low AAI secretomes (absent from high AAI secretomes). (C) Supervised hierarchical cluster analysis of proteins differentially expressed in the whole secretome of high and low AAI AML patients.
To pinpoint which secreted proteins are strongly associated with high AAI cells and thereby harbor a significant potential to confer apoptosis resistance, we first performed further quantitative filtering of differential proteins found in the high AAI secretomes. The top 84 most discriminating high AAI-associated secretome proteins (p < 0.05; fold change >4; mean spectral count >1; detected in minimum 3/5 biological replicates) are listed in Table II (for low AAI-associated proteins see Supplemental Table S7).
Table II. Top 84 proteins upregulated in the secretome of high AAI AML patients in comparison to low AAI AML patients.
| Protein description | Human gene symbol | Mean spectral count |
Fold Changea | p value | |
|---|---|---|---|---|---|
| Low AAI | High AAI | ||||
| Splicing factor, arginine/serine-rich 9 | SRSF9 | 0.00 | 3.58 | ∞ | 0.000 |
| Isoform 1 of transcription elongation factor SPT6 | SUPT6H | 0.00 | 3.57 | ∞ | 0.000 |
| Isoform long of transformer-2 protein homolog | TRA2A | 0.00 | 1.56 | ∞ | 0.000 |
| Deoxycytidine kinase | DCK | 0.00 | 3.48 | ∞ | 0.001 |
| cDNA FLJ55988, highly similar to RNA-binding protein Luc7-like 2 | LUC7L2 | 0.00 | 2.65 | ∞ | 0.001 |
| Isoform 1 of JmjC domain-containing histone demethylation protein 2B | KDM3B | 0.00 | 1.53 | ∞ | 0.001 |
| Tubulin beta chain | TUBB | 0.00 | 4.57 | ∞ | 0.001 |
| Bis(5′-adenosyl)-triphosphatase | FHIT | 0.00 | 4.89 | ∞ | 0.001 |
| mRNA turnover protein 4 homolog | MRTO4 | 0.00 | 5.73 | ∞ | 0.001 |
| splicing factor 3B subunit 2 | SF3B2 | 0.00 | 1.53 | ∞ | 0.002 |
| Isoform A of methyl-CpG-binding protein 2 | MECP2 | 0.00 | 2.59 | ∞ | 0.002 |
| Hsc70-interacting protein | ST13 | 0.00 | 2.31 | ∞ | 0.002 |
| Coilin | COIL | 0.00 | 1.06 | ∞ | 0.003 |
| Cytochrome c oxidase polypeptide 7A2, mitochondrial | COX7A2 | 0.00 | 1.04 | ∞ | 0.003 |
| Isoform 1 of coiled-coil domain-containing protein 66 | CCDC66 | 0.00 | 1.02 | ∞ | 0.003 |
| histone deacetylase 2 | HDAC2 | 0.00 | 1.11 | ∞ | 0.004 |
| Rho-associated protein kinase 1 | ROCK1 | 0.00 | 1.03 | ∞ | 0.007 |
| Chromobox protein homolog 5 | CBX5 | 0.13 | 5.90 | 46.26 | 0.008 |
| Isoform 1 of nuclear autoantigenic sperm protein | NASP | 0.16 | 6.44 | 41.49 | 0.001 |
| Isoform 1 of DNA repair protein RAD50 | RAD50 | 0.13 | 3.48 | 27.29 | 0.000 |
| Metastasis-associated protein MTA2 | MTA2 | 0.13 | 3.32 | 26.05 | 0.002 |
| SPRY domain-containing protein 4 | SPRYD4 | 0.24 | 5.92 | 24.89 | 0.000 |
| Isoform 1 of Inorganic pyrophosphatase 2, mitochondrial | PPA2 | 0.13 | 2.51 | 19.64 | 0.001 |
| Histone H2A.V | H2AFV | 0.13 | 2.19 | 17.15 | 0.018 |
| Similar to delta(3,5)-delta(2,4)-dienoyl-CoA isomerase, mitochondrial precursor | N/A | 0.13 | 1.96 | 15.38 | 0.005 |
| Isoform 1 of putative deoxyribonuclease TATDN3 | TATDN3 | 0.16 | 2.29 | 14.73 | 0.003 |
| Isoform 1 of DNA damage-binding protein 2 | DDB2 | 0.13 | 1.79 | 14.00 | 0.003 |
| Isoform 1 of peptidyl-prolyl cis-trans isomerase SDCCAG10 | CWC27 | 0.13 | 1.77 | 13.84 | 0.003 |
| Exosome complex exonuclease RRP41 | EXOSC4 | 0.13 | 1.70 | 13.31 | 0.011 |
| Cytoplasmic dynein 1 heavy chain 1 | DYNC1H1 | 0.51 | 6.36 | 12.46 | 0.012 |
| Isoform 2 of HD domain-containing protein 2 | HDDC2 | 0.13 | 1.59 | 12.44 | 0.018 |
| Proteasome assembly chaperone 4 | PSMG4 | 0.13 | 1.38 | 10.82 | 0.009 |
| DnaJ homolog subfamily C member 9 | DNAJC9 | 0.57 | 6.05 | 10.69 | 0.004 |
| Isoform 1 of actin-like protein 6A | ACTL6A | 0.13 | 1.33 | 10.44 | 0.010 |
| Calponin-2 | CNN2 | 0.13 | 1.33 | 10.43 | 0.013 |
| Interleukin-16 | IL16 | 0.26 | 2.65 | 10.38 | 0.004 |
| Electron transfer flavoprotein subunit alpha, mitochondrial | ETFA | 0.16 | 1.60 | 10.28 | 0.040 |
| Protein SCO1 homolog, mitochondrial | SCO1 | 0.37 | 3.64 | 9.97 | 0.005 |
| Fatty acid synthase | FASN | 0.13 | 1.25 | 9.78 | 0.030 |
| Isoform 1 of PC4 and SFRS1-interacting protein | PSIP1 | 0.43 | 4.12 | 9.64 | 0.027 |
| Eukaryotic translation initiation factor 3 subunit G | EIF3G | 0.13 | 1.20 | 9.39 | 0.018 |
| Treacher Collins–Franceschetti syndrome 1 isoform a | TCOF1 | 0.13 | 1.20 | 9.39 | 0.018 |
| 15 kDa selenoprotein isoform 1 precursor | SEP15 | 0.13 | 1.17 | 9.20 | 0.018 |
| Isoform 2 of Sister chromatid cohesion protein PDS5 homolog A | PDS5A | 0.39 | 3.55 | 9.19 | 0.016 |
| 175 kDa protein | AGL | 0.38 | 3.19 | 8.34 | 0.016 |
| Transcription elongation factor B polypeptide 2 | TCEB2 | 0.26 | 2.10 | 8.25 | 0.009 |
| 14 kDa phosphohistidine phosphatase | PHPT1 | 0.13 | 1.02 | 7.96 | 0.036 |
| Isoform p150 of dynactin subunit 1 | DCTN1 | 0.21 | 1.69 | 7.91 | 0.010 |
| Isoform 2 of microtubule-actin cross-linking factor 1, isoforms 1/2/3/5 | MACF1 | 0.78 | 6.15 | 7.90 | 0.014 |
| Ras-related protein Rab-2A | RAB2A | 0.26 | 2.01 | 7.89 | 0.010 |
| ATP synthase subunit alpha, mitochondrial | ATP5A1 | 0.26 | 2.01 | 7.86 | 0.016 |
| GA-binding protein alpha chain | GABPA | 0.28 | 2.21 | 7.82 | 0.008 |
| Isoform 1 of plasminogen activator inhibitor 1 RNA-binding protein | SERBP1 | 0.26 | 1.99 | 7.79 | 0.012 |
| Structural maintenance of chromosomes protein 3 | SMC3 | 0.77 | 5.85 | 7.65 | 0.008 |
| 60S ribosomal protein L6 | RPL6 | 0.34 | 2.54 | 7.43 | 0.013 |
| Isoform 1 of Mps one binder kinase activator-like 3 | MOB4 | 0.26 | 1.85 | 7.25 | 0.015 |
| Signal recognition particle 14 kDa protein | SRP14 | 0.96 | 6.49 | 6.78 | 0.002 |
| RNA binding protein, autoantigenic (HnRNP-associated with lethal yellow homolog (mouse)), isoform CRA_a (fragment) | RALY | 0.71 | 4.76 | 6.74 | 0.001 |
| Heme oxygenase 2 | HMOX2 | 0.41 | 2.71 | 6.60 | 0.007 |
| BolA-like protein 2 | BOLA2 | 0.21 | 1.31 | 6.11 | 0.036 |
| Isoform Crk-II of Proto-oncogene C-crk | CRK | 0.38 | 2.32 | 6.07 | 0.028 |
| Isoform 1 of Malignant T cell amplified sequence 1 | MCTS1 | 0.26 | 1.51 | 5.94 | 0.024 |
| DNA replication licensing factor MCM6 | MCM6 | 0.72 | 4.26 | 5.91 | 0.016 |
| Splicing factor 3B subunit 1 | SF3B1 | 0.26 | 1.49 | 5.84 | 0.030 |
| Proteasome assembly chaperone 3 | PSMG3 | 0.65 | 3.75 | 5.81 | 0.016 |
| 60 kDa heat shock protein, mitochondrial | HSPD1 | 2.30 | 12.93 | 5.63 | 0.000 |
| cDNA FLJ51718, highly similar to Caspase recruitment domain-containing protein 8 | CARD8 | 0.64 | 3.61 | 5.62 | 0.024 |
| UPF0568 protein C14orf166 | C14orf166 | 0.64 | 3.41 | 5.35 | 0.031 |
| U2 small nuclear ribonucleoprotein A' | SNRPA1 | 0.79 | 4.22 | 5.32 | 0.011 |
| Isoform 2 of Bcl-2-like protein 13 | BCL2L13 | 0.60 | 3.15 | 5.28 | 0.027 |
| Prefoldin subunit 2 | PFDN2 | 0.41 | 2.08 | 5.07 | 0.013 |
| Histone-binding protein RBBP7 | RBBP7 | 0.54 | 2.69 | 5.00 | 0.024 |
| Isoform 3 of anamorsin | CIAPIN1 | 0.50 | 2.46 | 4.95 | 0.004 |
| Isoform 2 of Ena/VASP-like protein | EVL | 1.30 | 6.24 | 4.78 | 0.018 |
| Nuclease-sensitive element-binding protein 1 | YBX1 | 3.88 | 17.65 | 4.55 | 0.004 |
| Isoform 1 of Proteasome activator complex subunit 3 | PSME3 | 1.30 | 5.83 | 4.47 | 0.025 |
| Isoform ASF-1 of splicing factor, arginine/serine-rich 1 | SRSF1 | 3.80 | 16.98 | 4.46 | 0.001 |
| GTP:AMP phosphotransferase mitochondrial | AK3 | 0.89 | 3.95 | 4.43 | 0.011 |
| Tubulin alpha-1C chain | TUBA1C | 1.94 | 8.48 | 4.37 | 0.028 |
| Diablo homolog, mitochondrial precursor | DIABLO | 1.77 | 7.29 | 4.11 | 0.019 |
| Isoform 3 of FUS-interacting serine-arginine-rich protein 1 | SRSF10 | 0.71 | 2.88 | 4.08 | 0.005 |
| Ras-related protein Rab-5B | RAB5B | 0.51 | 2.08 | 4.04 | 0.027 |
| ubiquitin-conjugating enzyme E2L 6 isoform 1 | UBE2L6 | 0.51 | 2.08 | 4.04 | 0.027 |
| Lymphocyte-specific protein 1 | LSP1 | 0.64 | 2.56 | 4.02 | 0.048 |
a - ∞ –unique protein.
Next, we used two related algorithms to analyze secretion signals in proteins up-regulated in high and low AAI secretomes. Classical signal peptides were detected in the amino acid sequence of analyzed proteins by SignalP algorithm, while SecretomeP was used to predict signal peptide-independent secretion (Fig. 3). Interestingly, 53% of secretome proteins of high AAI patients were not predicted to be secreted, and 41% of proteins displayed nonclassical secretion signals (compared with 30% of not predicted to be secreted and 30% nonclassically secreted proteins in low AAI secretomes, Chi2 = 34.7, p < 0.001). Proteins containing only classical signal peptides and those having both classical and nonclassical properties each constituted only 3% of all proteins that were up-regulated in high AAI. These figures were seven and 33% for the low AAI cases. These findings suggest that a specific profile of nonclassically secreted proteins is associated with apoptosis-resistant AML.
Fig. 3.
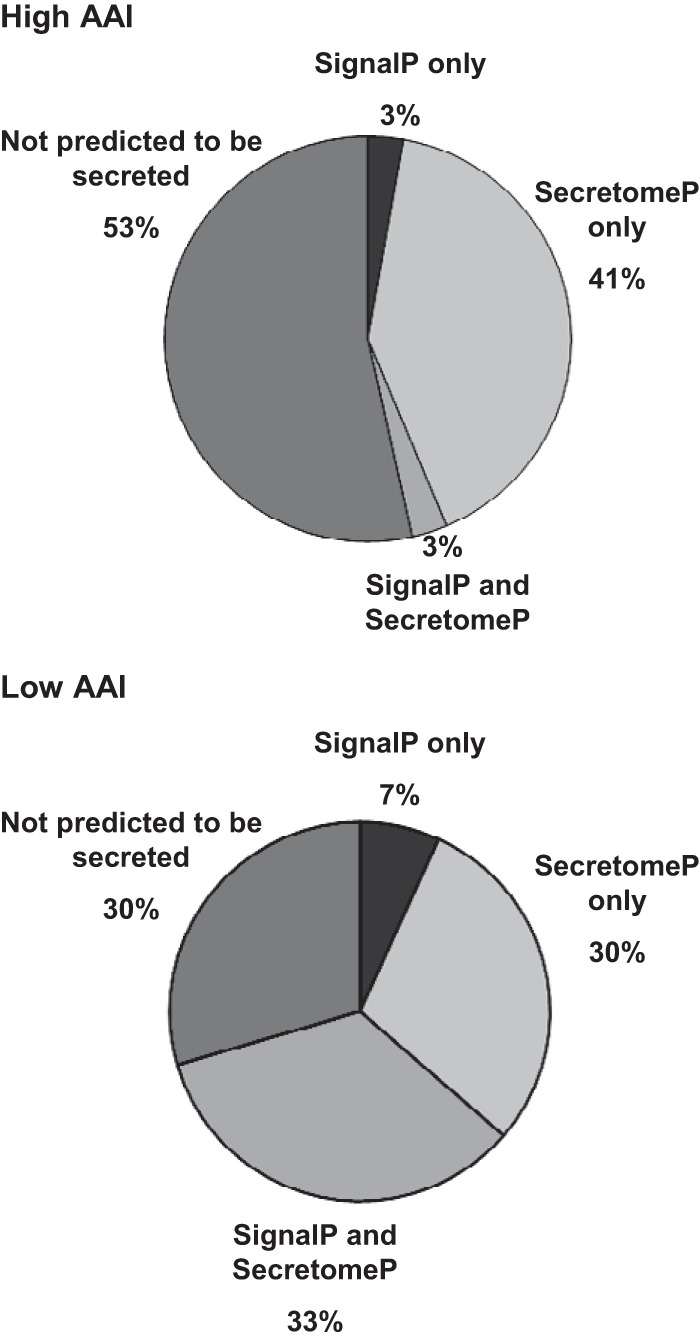
Analysis of classical and nonclassical secretion signals in proteins up-regulated in high AAI and low AAI primary AML samples. Pie charts depict the fraction of proteins in high AAI and low AAI secretome, which are predicted to contain classical signal peptides (SignalP only), nonclassical secretion signals (SecretomeP only), both classical and nonclassical properties (SignalP and SecretomeP), as well as proteins predicted not to be secreted (not predicted to be secreted).
Proteomics Profile of Secretome of Apoptosis-Resistant and -Sensitive AML Blasts
For unbiased functional data mining, we visualized the identified secretome proteins of high AAI and low AAI AML blasts using protein–protein interaction analysis in the STRING tool (32) with visualization in Cytoscape (33). Next, Cluster ONE software (35) and BiNGO (34) analysis were employed to assign presumed biological function to subnetworks of proteins. We identified six major clusters of highly connected proteins up-regulated in high AAI secretomes (Fig. 4, upper panel) and five clusters in the low AAI secretomes. The top two clusters detected in high AAI samples include 20 and 32 members, respectively. Both protein subnetworks were associated with GO (Gene Ontology) terms involving RNA/nucleic acid metabolism with the top cluster showing the strongest link to mRNA splicing. This cluster includes well-established components of the spliceosome (i.e. SF3B1 - splicing factor 3 subunit 1, HNRNPC - heterogeneous nuclear rybonucleoprotein C, and SNRPA1 - small nuclear rybonucleoprotein polypeptide A') as well as splicing factors (serine/arginine-rich splicing factors: SRSF1, SRSF2 and SRSF9). The cluster representing nucleic acid metabolism mostly consists of proteins that play a role in various aspects of RNA metabolism, such as transcription, splicing, stability, and processing (i.e. YBX1 - Y-box binding protein 1, TRIM28 - tripartite motif containing 28, C14ORF166 - chromosome 14 open reading frame 166). This cluster also contains the nucleophosmin (NPM1) protein, which is known to be frequently mutated in AML (38). Other major clusters involved GO terms such as ribosome biogenesis/translation, chromosome organization/chromatin remodeling, protein ubiquitination, and inositol metabolic processes (Fig. 4, upper panel). Altogether, protein subnetworks identified in high AAI secretomes were associated with complex regulation of gene expression, including transcription, mRNA splicing, and translation. In contrast, top clusters detected in the low AAI were associated with GO terms involving ER catabolic processes, small molecule catabolic processes, chemotaxis/response to stimuli, proteolysis, and transferrin transport (Fig. 4, lower panel).
Fig. 4.

Functional clusters of proteins up-regulated in the whole secretome of high AAI and low AAI primary AML cells. The figure depicts major functional protein clusters identified by Cluster ONE analysis in interaction networks generated in STRING and visualized in Cytoscape. Nodes correspond to up-regulated proteins and edges symbolize physical or functional associations. Blue clusters represent proteins up-regulated in secretome of apoptosis-resistant (high AAI) AML cells, and green clusters correspond to secretome of apoptosis-sensitive (low AAI) AML blasts. Representative GO terms identified by BiNGO analysis in both high and low AAI AML samples are listed together with the number of proteins (nodes) per cluster and their significance.
Many proteins up-regulated in the secretome of high AAI compared with low AAI cells were of nuclear origin. Therefore, we addressed the question of whether these proteins might be released from cells undergoing apoptosis. If this would be the case, up-regulation of nuclear proteins in high AAI secretome may either be explained by more extensive cell death in high AAI over low AAI samples or by higher intracellular expression of nuclear proteins in high AAI over low AAI cells. As indicated in the previous paragraph, both high and low AAI cells displayed comparable viability during secretome production, indicating that increased apoptosis in high AAI is not affecting this analysis. To exclude the second possibility, we have also profiled the proteome of the whole cell lysates derived from the same samples that were used to generate secretomes. The processes up-regulated in the whole cell lysates of high AAI cells differed from those up-regulated in the secretomes (Supplemental Fig. S1 and Supplemental Tables S8 and S9). Only a minor functional overlap was found and included RNA processing and ribosome biogenesis/translation; however, particular protein components included in both clusters were also different (see Fig. 4 and Supplemental Fig. S1). Moreover, two of the major functional clusters found in the secretome—mRNA splicing and chromatin organization—were not represented among proteins up-regulated in the whole cell lysates of high AAI cells. Together, these results indicate that although contaminants from cell lysates may be present in the analyzed proteome, they do not significantly affect our differential analysis.
The Secretome of Apoptosis-Resistant AML Blasts Contains Proteins with Apoptosis Regulatory Potential
Surprisingly, none of the major networks identified among proteins up-regulated in high AAI secretomes was directly associated with apoptosis. Therefore, to complement the unbiased functional GO analysis of differential proteins in high AAI secretomes, we performed a targeted search for proteins involved in apoptosis regulation. In total, we detected 24 proteins associated with GO terms related to apoptosis that were significantly up-regulated in high AAI secretomes (Table III). This includes several negative regulators of apoptosis such as cytokine-induced apoptosis inhibitor 1, signal transducing adaptor molecule (STAM)-binding protein, and high mobility group box 1 (HMGB1). On the other hand, stimulators of apoptosis could also be detected among proteins up-regulated in secretomes of high AAI cells, i.e. BCL-2-like protein 13 (BCL2L13), pyrin domain (PYD) and caspase recruitment domain (CARD) domain-containing (PYCARD) or IAP-binding mitochondrial protein (DIABLO).
Table III. Apoptosis related proteins upregulated in the secretome of high AAI AML patients in comparison to low AAI AML patients.
| Protein description | Human gene symbol | Mean spectral count |
Fold Changea | p value | |
|---|---|---|---|---|---|
| Low AAI | High AAI | ||||
| Tubulin beta chain | TUBB | 0.00 | 4.57 | ∞ | 0.001 |
| Isoform DFF45 of DNA fragmentation factor subunit alpha (Fragment) | DFFA | 0.00 | 1.31 | ∞ | 0.004 |
| Isoform 1 of Rho guanine nucleotide exchange factor 6 | ARHGEF6 | 0.00 | 1.09 | ∞ | 0.005 |
| Rho-associated protein kinase 1 | ROCK1 | 0.00 | 1.03 | ∞ | 0.007 |
| Isoform 1 of myosin-XVIIIa | MYO18A | 0.00 | 1.31 | ∞ | 0.010 |
| Isoform 1 of ATP-dependent RNA helicase DDX42 | DDX42 | 0.00 | 1.60 | ∞ | 0.012 |
| Heat shock protein beta-1 | HSPB1 | 0.00 | 2.45 | ∞ | 0.013 |
| Eukaryotic translation elongation factor 1 epsilon-1 | EEF1E1 | 0.00 | 0.66 | ∞ | 0.015 |
| Isoform MEF2DAB of myocyte-specific enhancer factor 2D | MEF2D | 0.00 | 0.68 | ∞ | 0.038 |
| STAM-binding protein | STAMBP | 0.00 | 0.47 | ∞ | 0.043 |
| programmed cell death 4 isoform 2 | PDCD4 | 0.00 | 0.47 | ∞ | 0.043 |
| Isoform 1 of plasminogen activator inhibitor 1 RNA-binding protein | SERBP1 | 0.26 | 1.99 | 7.79 | 0.012 |
| 60 kDa heat shock protein, mitochondrial | HSPD1 | 2.30 | 12.93 | 5.63 | 0.000 |
| cDNA FLJ51718, highly similar to caspase recruitment domain-containing protein 8 | CARD8 | 0.64 | 3.61 | 5.62 | 0.024 |
| Isoform 2 of Bcl-2-like protein 13 | BCL2L13 | 0.60 | 3.15 | 5.28 | 0.027 |
| Isoform 3 of anamorsin | CIAPIN1 | 0.50 | 2.46 | 4.95 | 0.004 |
| Isoform 1 of proteasome activator complex subunit 3 | PSME3 | 1.30 | 5.83 | 4.47 | 0.025 |
| Diablo homolog, mitochondrial precursor | DIABLO | 1.77 | 7.29 | 4.11 | 0.019 |
| Isoform 2 of eukaryotic translation initiation factor 5A-1 | EIF5A | 2.04 | 7.18 | 3.52 | 0.017 |
| High mobility group protein B1 | HMGB1 | 12.61 | 33.04 | 2.62 | 0.042 |
| Isoform 2 of nucleophosmin | NPM1 | 11.53 | 26.11 | 2.27 | 0.047 |
| Isoform 1 of apoptosis-associated speck-like protein containing a CARD | PYCARD | 6.48 | 12.68 | 1.96 | 0.034 |
| Multisynthetase complex auxiliary component p43 | AIMP1 | 6.99 | 13.53 | 1.94 | 0.031 |
| Nucleoside diphosphate kinase | NME1-NME2 | 27.37 | 38.89 | 1.42 | 0.035 |
a - ∞ –unique protein.
Proteomics Profile of Exosomes of Apoptosis-Resistant and -Sensitive AML Blasts
Intracellular (including nuclear) proteins constitute a surprisingly large part of the high AAI-associated secretome. Therefore, we explored the possibility that a subset of these proteins is secreted via exosomes, which additionally may validate the findings from our primary secretome analysis. Toward this end, we chose one high AAI (AML2: AAI = 316) and one low AAI (AML7: AAI = 15.8) AML patient sample that were used in the whole secretome analysis (Table I) for which sufficient amounts of blasts were available (Fig. 2, right panel). Next, we used differential centrifugation to isolate EVs from the secretome derived from selected patient specimens. The purity of vesicle preparation using this protocol was previously demonstrated (36, 37). Proteins isolated from EVs were analyzed by gel-LC-MS/MS-based proteomics. Exosome markers were enriched in the purified EV fraction as compared with the soluble secretome fraction (Supplemental Fig. S2 and Supplemental Table S10), indicating that our preparation contained exosomes. Statistical analysis revealed that out of a total of 4,232 proteins (Supplemental Tables S10 and S11) 729 were significantly up-regulated in high AAI exosomes and 498 were up-regulated in low AAI exosomes (Supplemental Tables S12-S14). The analysis of functional clusters of proteins in exosomes of high AAI samples consistently revealed five major clusters with GO terms, including noncoding RNA (ncRNA) metabolism, DNA replication/DNA repair, translation elongation, mRNA splicing, and stress response (Fig. 5, upper panel). These results were further supported by abundant nuclear proteins found in EV fraction, which was profiled for one additional high AAI sample (Supplemental Table S15 and S16). In contrast, the top five clusters detected in exosomes of low AAI cells were involved in defense/inflammatory response, response to stress/stimuli, small molecule metabolic process, small GTPase-mediated signal transduction, and regulation of ubiquitin protein ligase activity (Fig. 5, lower panel). Together, proteomics of high and low AAI AML blasts are in line with the secretome results and indicate exosomes as carriers of apoptosis-resistance-associated protein complexes involved in gene regulation.
Fig. 5.

Proteins up-regulated in exosomes of high AAI and low AAI AML patient samples. Interaction networks were generated using STRING and visualization in Cytoscape. The figure depicts major functional protein clusters, corresponding to either high or low AAI samples, identified by Cluster ONE analysis. Nodes correspond to up-regulated proteins and edges symbolize physical or functional associations. Blue clusters represent proteins up-regulated in exosomes of apoptosis-resistant AML cells and green clusters correspond to exosomes of apoptosis-sensitive AML blasts. Representative GO terms identified by BiNGO analysis in both high and low AAI AML samples are listed together with the number of proteins (nodes) per cluster and their significance.
Vesicle Uptake in Low AAI Cells
First, to assess if EVs secreted by high AAI cells can be taken up by the neighboring cells, we incubated PKH67-labeled high AAI cells with HeLa cells (known for efficient vesicle uptake) for 24 h. Confocal imaging clearly showed very efficient PKH67 uptake in HeLa cells (Fig. 6A, upper panel and Supplemental Fig. S3) with vesicle-like structures visible in the intracellular space as well as in the area of the cytoplasmic membrane. These data were supported by flow cytometry, which showed approximately a 100-fold increase in PKH67 signal in HeLa cells after contact cultures as compared with control cells (data not shown). Moreover, additional imaging using digitally enhanced fluorescent microscope further demonstrated clear PKH26 signal in HeLa cells incubated with PKH67-stained purified EVs of high AAI AML cells (Supplemental Fig. S4). In this experiment, HeLa cells were incubated with highly purified EV fraction, which excludes the possibility of PKH67 transfer via direct contact with the PKH67-stained cells as well as via uptake of PKH67-stained cellular debris.
Fig. 6.

Confocal images of high AAI cells-derived EVs uptake. (A) Selected images of HeLa (upper panel) and low AAI (lower panel) cells, which took up high-AAI derived vesicles (white arrows). (B, C) Quantitation of signal intensity in HeLa (B) and low AAI (C) cells (yellow arrows). Signal intensity for PKH67 as well as SF3B3 and HNRNPA3 staining was quantified along the white line indicated in the image (B and C). The intensity plots indicate several areas of colocalization of PKH67 signal with HNRNPA3 signal and SF3B3 signal (indicated by dotted lines).
To assess the ability of apoptosis-sensitive AML cells to take up the EVs, we incubated low AAI AML cells for 24 h with PKH67-stained purified EVs produced by high AAI AML cells. PKH67 uptake was clearly visible in all low AAI cells with high variability among individual cells within a single low AAI sample. While the majority of low AAI cells displayed moderate signal, about 10% of cells were highly positive (Fig. 6A, lower panel and Supplemental Figs. S3 and S4). The reasons underlying these differences remain currently unknown, however could include different cell types or maturation stadia.
Furthermore, we attempted to visualize the intracellular colocalization of nuclear proteins with the PKH67-positive vesicles taken up by HeLa and low AAI AML cells (Figs. 6B and 6C). Therefore, we stained both cell types with antibodies against two splicing factors, which were found abundant in exosomes secreted by high AAI cells—SF3B3 and HNRNPA3. Staining for both splicing factors was abundant in the nuclear and cytoplasmic area of all cells. Subsequently, signal for PKH67 as well as the two splicing factors was quantified along a selected line (white line in Figs. 6B and 6C). For each sample, we have assessed at least three lines in different locations in the cell. Interestingly, along each assessed line, quantification of the signal intensities was suggestive of colocalization in several selected areas in the intracellular space, indicating the presence of PKH67-labeled vesicles containing splicing factors. We have also observed PKH67 signal not colocalized with the splicing factors, indicating heterogeneity in the protein content of particular vesicles. Moreover, in some areas, signal for HNRNPA3 and SF3B3 was not associated with PKH67 signal, which likely corresponds to endogenously expressed proteins or proteins released by vesicles to the cytosol.
As opposed to the 48 h contact cultures, no increase in BCL-2 expression was observed upon the 24 h incubation (data not shown). This indicates that 48 h might be necessary to observe this effect. Taken together, our results show that the neighboring cells, including potential low AAI blasts, are able to take up high AAI-blasts-derived vesicles containing splicing factors.
DISCUSSION
In the current study (see Fig. 7 for an overview), we report the ability of apoptosis-resistant AML blasts to influence apoptosis-related protein expression in their neighboring therapy sensitive cells. In addition, we elucidated the proteins secreted by AML blast cells with high AAI, potentially involved in conferring apoptosis resistance. We first showed that apoptosis-resistant AML cells are able to directly modulate the apoptosis-related protein profile of drug-sensitive blasts. This observation is supported by our earlier findings, which prove that elevated expression of BCL-2 and BCL-X is associated with higher rates of spontaneous apoptosis in vitro (39). Moreover, our results are in line with a previous report showing that the secretome of AML blasts can inhibit apoptosis of neighboring bone marrow cells (19). The most direct evidence for the putative clinical importance of secreted proteins in apoptosis regulation comes from our observation that, ex vivo, the apoptosis protein profile of the lymphocytes present in the bone marrow of AML patients, mirrors that of the corresponding blasts cells, even far beyond the expression ranges of normal lymphocytes. The levels of BCL-2 and MCL-1 correlated between lymphocytes and CD34+ blasts also in the normal bone marrow samples, suggesting that microenvironment-mediated determination of apoptotic protein profiles might extend to healthy bone marrow as well. Moreover, the association of protein profiles between lymphocytes and AML blast cells was not limited to the time of diagnosis but also remained during the course of treatment, as reflected by the decrease in BCL-2 expression during complete remission. Hence, the current study constitutes the first demonstration that, in the bone marrow of AML patients, expression levels of apoptosis-related proteins in leukemic blasts and lymphocytes of AML patients are highly correlated. Taken together, these observations strongly suggest that apoptosis resistance can be induced by factors present in the leukemic microenvironment that are secreted by high AAI AML blasts.
Fig. 7.

Comprehensive overview of the current findings. For details see the results section.
To identify which factors in the AML secretomes are potentially involved in apoptosis regulation, we performed proteome profiling of secretomes produced by high and low AAI AML blasts. Unlike most studies using secretomes derived from leukemic cell line models, we focused on secretomes generated by primary cells of AML patients. We identified a total of 1,492 secretome proteins, produced in all AML samples regardless of the AAI status. Analysis of the putative function of the discovered protein networks showed that high AAI blasts display a relatively high level of unconventional protein secretion. Intriguingly, none of the major functional clusters identified in high AAI secretome was directly linked to apoptosis regulation. Instead, they represented protein networks involved in global regulation of gene expression at several levels and many of these candidates constitute nuclear proteins. The top ranking cluster was associated with mRNA splicing, a process that is well documented to regulate multiple apoptosis-related proteins (40). Many members of the BCL-2 family of apoptosis regulators, including BCL-X and MCL-1, are differentially spliced into functionally antagonistic isoforms, and their intricate balance is thought to be crucial in determining cell fate (41). Several components of the SF3B subunit of the spliceosome (i.e. SF3B1 or SF3B2) as well as SRSF1 and SRSF9 have previously been reported to regulate splicing of MCL-1, BCL-X, and caspase 9 (42, 43). SRSF1 and SRSF2 were also shown to regulate splicing of caspase 2 (44). Enrichment of these splicing regulators in the secretomes of apoptosis-resistant AML blasts points to their likely role in conferring apoptosis-resistance. According to this paradigm, the AML blasts may provide their surrounding cells with regulatory network proteins that alter their apoptosis profile rather than delivering the anti-apoptotic proteins directly.
The second top cluster was associated with various aspects of nucleic acid metabolism with a pronounced involvement in RNA processing. This cluster also contained the NPM1 protein, which is involved in tumorigenesis of AML (45). Overexpression of, and mutations in, NPM1 were implicated in increased apoptosis resistance (46, 47). Therefore, transfer of NPM1 via exosomes may elevate its level in the recipient cells, thereby possibly affecting their apoptotic pathway. Other top clusters include proteins involved in chromatin remodeling and ribosome biogenesis, which may modulate transcription and translation of genes involved in apoptosis, respectively. In contrast, protein clusters up-regulated in low AAI secretomes were involved in more specific metabolic processes, such as ER catabolism, chemotaxis or response to stimuli. The distinct secretome profiles found in high and low AAI samples underscore the likely functional relevance of the detected regulatory clusters. Taken altogether, protein networks secreted by high AAI blasts appear to bear the potential to globally regulate expression of multiple apoptosis-related proteins at different levels. The presence of nuclear proteins in secretome is often assumed to be a contaminant and thereby may be frequently ignored; however, the functional implications of this phenomenon are currently emerging (48). In this respect, we recently identified an enrichment of nuclear proteins, including factors involved in splicing in secretomes derived from colorectal cancer tissues in comparison to healthy controls (49). In addition, recent detection of splicing regulators (including SF3B1 and SRSF1) in exosomes derived from the polarized Madin–Darby canine kidney cell line MDCK transformed with oncogenic H-Ras was postulated to play a functional role (50). The identified splicing factors were linked to induction of epithelial-to-mesenchymal transition leading to more aggressive phenotype of the malignant disease. Based on our data, we suggest that secretion of complex nuclear and cytoplasmic regulatory protein clusters by apoptosis-resistant primary AML cells has an enormous potential to impact apoptosis-related protein expression in the neighboring cells.
Although no functional networks directly linked to apoptosis regulation were found in the unbiased analysis of the high AAI secretome, a targeted search was able to detect a set of proteins involved in apoptosis modulation. For some of the 24 apoptosis-related proteins (i.e. cytokine-induced apoptosis inhibitor 1, HMGB1) a direct role in apoptosis was reported (51, 52); however, their engagement in mediating apoptosis resistance needs to be confirmed in further studies.
Major functional clusters, i.e. related to regulation of RNA metabolism and translation, identified in the whole secretome of high AAI patients were also detected in exosomes derived from high AAI AML cells. This suggests that exosome-mediated release may well be one of the mechanisms contributing to the presence of nuclear proteins in apoptosis-resistant AML secretome. We performed this validation experiment using two high AAI and one low AAI patient specimens. The obtained results confirm our previous findings in the whole secretome. Furthermore, our confocal-microscopy-based colocalization analysis showed that vesicles, carrying splicing factors, secreted by high AAI cells have the potential to be taken up by other cells residing in their proximity, including low AAI cells. Altogether, these data indicate vesicle-mediated transfer of regulatory protein networks as a plausible mode of conferring apoptosis resistance upon sensitive AML; however, further studies to confirm these novel findings are warranted.
EV-mediated modulation of gene expression and consequently the phenotype in recipient cells is an emerging and intriguing concept (53). A recently published study shows that AML-derived vesicles mediate functional RNA transfer between cells, thereby modulating several pathogenic properties, including proliferative capacity (54). Here we showed that EV-mediated regulatory protein release in AML may be an important determinant of therapy resistance.
Altogether, the data point to secretion of complex nuclear and cytoplasmic regulatory protein clusters by apoptosis-resistant primary AML cells with a large potential to influence apoptosis-related protein expression in the neighboring cells. Exosome proteomics analysis confirmed the secretome findings and underscored the role of exosomes as carriers of nuclear protein complexes with a potential role in conferring apoptosis resistance upon neighbor cells. This is the first comprehensive proteomics analysis of the AML microenvironment. Our unique ex vivo analysis performed using AML patient cells underlines distinct properties of the secretomes of apoptosis-resistant and sensitive primary cells. Understanding mechanistic and functional differences in cell-to-cell communication between apoptosis-resistant and -sensitive cells could lead to the development of novel therapeutic interventions, targeted at limiting the emergence of chemoresistance. In addition, our results provide potential markers for therapy resistance, which could be detected in the plasma of AML patients; however, further extensive research is warranted to address the clinical implications of our findings.
Supplementary Material
Footnotes
Author contributions: G.J.S., G.J., S.Z., J.C., and C.R.J. designed the research; A.W., F.L.K., S.R.P., R.J.M., and J.v. performed the research; A.W., G.J.S., F.L.K., S.R.P., J.C.K., T.V.P., G.J., R.J.M., J.v., Y.G.A., G.J.K., S.Z., J.C., and C.R.J. analyzed data; A.W. wrote the paper; G.J.S., and S.R.P., J.C.K., T.V.P., G.J., R.J.M., J.v., Y.G.A., G.J.K., S.Z., J.C., and C.R.J. edited the paper.
* This work was financially supported by the VUmc Cancer Center Amsterdam. A. Wojtuszkiewicz was supported by Vonk (VUmc Onderzoek Naar Kinderkanker).
 This article contains supplemental material.
1 The abbreviations used are:
- AAI
- anti-apoptosis index
- AML
- acute myeloid leukemia
- BM
- bone marrow
- CFSE
- carboxyfluorescein succinimidyl ester
- MRD
- minimal residual disease.
REFERENCES
- 1.Cornelissen J. J., van Putten W. L., Verdonck L. F., Theobald M., Jacky E., Daenen S. M., van Marwijk Kooy M., Wijermans P., Schouten H., Huijgens P. C., van der Lelie H., Fey M., Ferrant A., Maertens J., Gratwohl A., and Lowenberg B. (2007) Results of a HOVON/SAKK donor versus no-donor analysis of myeloablative HLA-identical sibling stem cell transplantation in first remission acute myeloid leukemia in young and middle-aged adults: Benefits for whom? Blood 109, 3658–3666 [DOI] [PubMed] [Google Scholar]
- 2.Kaspers G. J. L. (2012) Pediatric acute myeloid leukemia. Expert Rev. Anticancer Ther. 12, 405–413 [DOI] [PubMed] [Google Scholar]
- 3.Campos L., Rouault J. P., Sabido O., Oriol P., Roubi N., Vasselon C., Archimbaud E., Magaud J. P., and Guyotat D. (1993) High expression of bcl-2 protein in acute myeloid leukemia cells is associated with poor response to chemotherapy. Blood 81, 3091–3096 [PubMed] [Google Scholar]
- 4.Del Poeta G., Venditti A., Del Principe M. I., Maurillo L., Buccisano F., Tamburini A., Cox M. C., Franchi A., Bruno A., Mazzone C., Panetta P., Suppo G., Masi M., and Amadori S. (2003) Amount of spontaneous apoptosis detected by BAX/BCL-2 ratio predicts outcome in acute myeloid leukemia (AML). Blood 101, 2125–2131 [DOI] [PubMed] [Google Scholar]
- 5.Sharawat S. K., Bakhshi R., Vishnubhatla S., Gupta R., and Bakhshi S. (2013) BAX/BCL2 RMFI ratio predicts better induction response in pediatric patients with acute myeloid leukemia. Pediatr. Blood Cancer 60, E63–E66 [DOI] [PubMed] [Google Scholar]
- 6.van Stijn A., Kok A., van der Pol M. A., Feller N., Roemen G. M., Westra A. H., Ossenkoppele G. J., and Schuurhuis G. J. (2003) A flow cytometric method to detect apoptosis-related protein expression in minimal residual disease in acute myeloid leukemia. Leukemia 17, 780–786 [DOI] [PubMed] [Google Scholar]
- 7.van Stijn A., Feller N. Kok A., van der Pol M. A., Ossenkoppele G. J., and Schuurhuis G. J. (2005) Minimal residual disease in acute myeloid leukemia is predicted by an apoptosis-resistant protein profile at diagnosis. Clin. Cancer Res. 11, 2540–2546 [DOI] [PubMed] [Google Scholar]
- 8.Terwijn M., van Putten W. L., Kelder A., van der Velden V. H. J., Brooimans R. A., Pabst T., Maertens J., Boeckx N., de Greef G. E., Valk P. J., Preijers F. W., Huijgens P. C., Dräger A. M., Schanz U., Jongen-Lavrecic M., Biemond B. J., Passweg J. R., van Gelder M., Wijermans P., Graux C., Bargetzi M., Legdeur M.-C., Kuball J., de Weerdt O., Chalandon Y., Hess U., Verdonck L. F., Gratama J. W., Oussoren Y. J., Scholten W. J., Slomp J., Snel A. N., Vekemans M.-C., Löwenberg B., Ossenkoppele G. J., and Schuurhuis G. J. (2013) High prognostic impact of flow cytometric minimal residual disease detection in acute myeloid leukemia: Data from the HOVON/SAKK AML 42A study. J. Clin. Oncol. 31, 3889–3897 [DOI] [PubMed] [Google Scholar]
- 9.Venditti A., Buccisano F., Del Poeta G., Maurillo L., Tamburini A., Cox C., Battaglia A., Catalano G., Del Moro B., Cudillo L., Postorino M., Masi M., and Amadori S. (2000) Level of minimal residual disease after consolidation therapy predicts outcome in acute myeloid leukemia. Blood 96, 3948–3952 [PubMed] [Google Scholar]
- 10.Feller N., van der Pol M. A., van Stijn A., Weijers G. W., Westra A. H., Evertse B. W., Ossenkoppele G. J., and Schuurhuis G. J. (2004) MRD parameters using immunophenotypic detection methods are highly reliable in predicting survival in acute myeloid leukaemia. Leukemia 18, 1380–1390 [DOI] [PubMed] [Google Scholar]
- 11.van Stijn A., Kok A., van Stalborch M. A., van der Pol M. A., Feller N., Westra A. H., Ossenkoppele G. J., and Schuurhuis G. J. (2004) Minimal residual disease cells in AML patients have an apoptosis-sensitive protein profile. Leukemia 18, 875–877 [DOI] [PubMed] [Google Scholar]
- 12.Baj-Krzyworzeka M., Szatanek R., Weglarczyk K., Baran J., and Zembala M. (2007) Tumour-derived microvesicles modulate biological activity of human monocytes. Immunol. Lett. 113, 76–82 [DOI] [PubMed] [Google Scholar]
- 13.Roccaro A., Sacco A., Maiso P., Azab A. K., Tai Y.-T., Reagan M., Azab F., Flores L. M., Campigotto F., Weller E., Anderson K. C., Scadden D. T., and Ghobrial I. M. (2013) BM mesenchymal stromal cell-derived exosomes facilitate multiple myeloma progression. J. Clin. Invest. 123, 1542–1555 [DOI] [PMC free article] [PubMed] [Google Scholar]
- 14.Buggins A. G., Milojkovic D., Arno M. J., Lea N. C., Mufti G. J., Thomas N. S., and Hirst W. J. (2001) Microenvironment produced by acute myeloid leukemia cells prevents T cell activation and proliferation by inhibition of NF-kappaB, c-Myc, and pRb pathways. J. Immunol. 167, 6021–6030 [DOI] [PubMed] [Google Scholar]
- 15.Lotem J., and Sachs L. (1999) Cytokines as suppressors of apoptosis. Apoptosis 4, 187–196 [DOI] [PubMed] [Google Scholar]
- 16.Ryningen A., Wergeland L., Glenjen N., Gjertsen B. T., and Bruserud O. (2005) In vitro crosstalk between fibroblasts and native human acute myelogenous leukemia (AML) blasts via local cytokine networks results in increased proliferation and decreased apoptosis of AML cells as well as increased levels of proangiogenic Interleukin 8. Leuk. Res. 29, 185–196 [DOI] [PubMed] [Google Scholar]
- 17.Macanas-Pirard P., Leisewitz A., Broekhuizen R., Cautivo K., Barriga F. M., Leisewitz F., Gidi V., Riquelme E., Montecinos V. P., Swett P., Besa P., Ramirez P., Ocqueteau M., Kalergis A. M., Holt M., Rettig M., DiPersio J. F., and Nervi B. (2012) Bone marrow stromal cells modulate mouse ENT1 activity and protect leukemia cells from cytarabine induced apoptosis. PLoS ONE 7, e37203. [DOI] [PMC free article] [PubMed] [Google Scholar]
- 18.Ratajczak J., Wysoczynski M., Hayek F., Janowska-Wieczorek A., and Ratajczak M. Z. (2006) Membrane-derived microvesicles: Important and underappreciated mediators of cell-to-cell communication. Leukemia 20, 1487–1495 [DOI] [PubMed] [Google Scholar]
- 19.Milojkovic D., Devereux S., Westwood N. B., Mufti G. J., Thomas N. S., and Buggins A. G. S. (2004) Antiapoptotic microenvironment of acute myeloid leukemia. J. Immunol. 173, 6745–6752 [DOI] [PubMed] [Google Scholar]
- 20.Lacombe F., Durrieu F., Briais A., Dumain P., Belloc F., Bascans E., Reiffers J., Boisseau M. R., and Bernard P. (1997) Flow cytometry CD45 gating for immunophenotyping of acute myeloid leukemia. Leukemia 11, 1878–1886 [DOI] [PubMed] [Google Scholar]
- 21.van Stijn A., Kok A., van der Pol M. A., Feller N., Roemen G. M., Westra A. H., Ossenkoppele G. J., and Schuurhuis G. J. (2003) Multiparameter flow cytometric quantification of apoptosis-related protein expression. Leukemia 17, 787–788 [DOI] [PubMed] [Google Scholar]
- 22.Piersma S. R., Fiedler U., Span S., Lingnau A., Pham T. V., Hoffmann S., Kubbutat M. H. G., and Jiménez C. R. (2010) Workflow comparison for label-free, quantitative secretome proteomics for cancer biomarker discovery: method evaluation, differential analysis, and verification in serum. J. Proteome Res. 9, 1913–1922 [DOI] [PubMed] [Google Scholar]
- 23.Piersma S. R., Broxterman H. J., Kapci M., de Haas R. R., Hoekman K., Verheul H. M. W., and Jiménez C. R. (2009) Proteomics of the TRAP-induced platelet releasate. J. Proteomics 72, 91–109 [DOI] [PubMed] [Google Scholar]
- 24.Warmoes M., Jaspers J. E., Pham T. V., Piersma S. R., Oudgenoeg G., Massink M. P. G., Waisfisz Q., Rottenberg S., Boven E., Jonkers J., and Jimenez C. R. (2012) Proteomics of mouse BRCA1-deficient mammary tumors identifies DNA repair proteins with potential diagnostic and prognostic value in human breast cancer. Mol. Cell. Proteomics 11, M111.013334. [DOI] [PMC free article] [PubMed] [Google Scholar]
- 25.Piersma S. R., Warmoes M. O., de Wit M., de Reus I., Knol J. C., and Jiménez C. R. (2013) Whole gel processing procedure for GeLC-MS/MS based proteomics. Proteome Science 11, 17. [DOI] [PMC free article] [PubMed] [Google Scholar]
- 26.Warmoes M., Jaspers J. E., Xu G., Sampadi B. K., Pham T. V., Knol J. C., Piersma S. R., Boven E., Jonkers J., Rottenberg S., and Jimenez C. R. (2013) Proteomics of genetically engineered mouse mammary tumors identifies fatty acid metabolism members as potential predictive markers for cisplatin resistance. Mol. Cell. Proteomics 12, 1319–1334 [DOI] [PMC free article] [PubMed] [Google Scholar]
- 27.Nesvizhskii A. I., Keller A., Kolker E., and Aebersold R. (2003) A statistical model for identifying proteins by tandem mass spectrometry. Anal. Chem. 75, 4646–4658 [DOI] [PubMed] [Google Scholar]
- 28.Keller A., Nesvizhskii A. I., Kolker E., and Aebersold R. (2002) Empirical statistical model to estimate the accuracy of peptide identifications made by MS/MS and database search. Anal. Chem. 74, 5383–5392 [DOI] [PubMed] [Google Scholar]
- 29.Cox J., and Mann M. (2008) MaxQuant enables high peptide identification rates, individualized p.p.b.-range mass accuracies and proteome-wide protein quantification. Nat. Biotechnol. 26, 1367–1372 [DOI] [PubMed] [Google Scholar]
- 30.Vizcaíno J., Deutsch E., Wang R., Csordas A., Reisinger F., Ríos D., Dianes J., Sun Z., Farrah T., Bandeira N., Binz P., Xenarios I., Eisenacher M., Mayer G., Gatto L., Campos A., Chalkley R., Kraus H., Albar J., Martinez-Bartolomé S., Apweiler R., Omenn G., Martens L., Jones A., and Hermjakob H. (2014) ProteomeXchange provides globally co-ordinated proteomics data submission and dissemination. Nat. Biotechnol. 32, 223–226 [DOI] [PMC free article] [PubMed] [Google Scholar]
- 31.Pham T. V., Piersma S. R., Warmoes M., and Jimenez C. R. (2010) On the beta-binomial model for analysis of spectral count data in label-free tandem mass spectrometry-based proteomics. Bioinformatics 26, 363–369 [DOI] [PubMed] [Google Scholar]
- 32.Szklarczyk D., Franceschini A., Kuhn M., Simonovic M., Roth A., Minguez P., Doerks T., Stark M., Muller J., Bork P., Jensen L. J., and von Mering C. (2011) The STRING database in 2011: Functional interaction networks of proteins, globally integrated and scored. Nucleic Acids Res. 39, D561–568 [DOI] [PMC free article] [PubMed] [Google Scholar]
- 33.Smoot M. E., Ono K., Ruscheinski J., Wang P. L., and Ideker T. (2011) Cytoscape 2.8: New features for data integration and network visualization. Bioinformatics 27, 431–432 [DOI] [PMC free article] [PubMed] [Google Scholar]
- 34.Maere S., Heymans K., and Kuiper M. (2005) BiNGO: A Cytoscape plugin to assess overrepresentation of gene ontology categories in biological networks. Bioinformatics 21, 3448–3449 [DOI] [PubMed] [Google Scholar]
- 35.Nepusz T., Yu H., and Paccanaro A. (2012) Detecting overlapping protein complexes in protein–protein interaction networks. Nat. Methods 9, 471–472 [DOI] [PMC free article] [PubMed] [Google Scholar]
- 36.Théry C., and Amigorena S. (2006) Isolation and characterization of exosomes from cell culture supernatants and biological fluids. Curr. Protoc. Cell Biol. 30, 3.22.1–29. [DOI] [PubMed] [Google Scholar]
- 37.Chiasserini D., van Weering J. R., Piersma S. R., Pham T. V., Malekzadeh A., Teunissen C. E., de Wit H., and Jiménez C. R. (2014) Proteomic analysis of cerebrospinal fluid extracellular vesicles: A comprehensive dataset. J. Proteomics 106, 191–204 [DOI] [PubMed] [Google Scholar]
- 38.Becker H., Marcucci G., Maharry K., Radmacher M. D., Mrózek K., Margeson D., Whitman S. P., Wu Y.-Z., Schwind S., Paschka P., Powell B. L., Carter T. H., Kolitz J. E., Wetzler M., Carroll A. J., Baer M. R., Caligiuri M. A., Larson R. A., and Bloomfield C. D. (2010) Favorable prognostic impact of NPM1 mutations in older patients with cytogenetically normal de novo acute myeloid leukemia and associated gene- and microRNA-expression signatures: A Cancer and Leukemia Group B study. J. Clin. Oncol. 28, 596–604 [DOI] [PMC free article] [PubMed] [Google Scholar]
- 39.van Stijn A., van der Pol M., Kok A., Bontje P. M., Roemen G. M. J. M., Beelen R. H. J., Ossenkoppele, and G. J., Schuurhuis G. J. (2003) Differences between the CD34+ and CD34-blast compartments in apoptosis resistance in acute myeloid leukemia. Haematologica 88, 497–508 [PubMed] [Google Scholar]
- 40.Schwerk C., and Schulze-Osthoff K. (2005) Regulation of apoptosis by alternative pre-mRNA splicing. Mol. Cell 19, 1–13 [DOI] [PubMed] [Google Scholar]
- 41.Akgul C., Moulding D. A., and Edwards S. W. (2004) Alternative splicing of Bcl-2-related genes: Functional consequences and potential therapeutic applications. Cell. Mol. Life Sci. 61, 2189–2199 [DOI] [PMC free article] [PubMed] [Google Scholar]
- 42.Moore M. J., Wang Q., Kennedy C. J., and Silver P. A. (2010) An alternative splicing network links cell-cycle control to apoptosis. Cell 142, 625–636 [DOI] [PMC free article] [PubMed] [Google Scholar]
- 43.Cloutier P., Toutant J., Shkreta L., Goekjian S., Revil T., and Chabot B. (2008) Antagonistic effects of the SRp30c protein and cryptic 5′ splice sites on the alternative splicing of the apoptotic regulator BCL-x. J. Biol. Chem. 283, 21315–21324 [DOI] [PubMed] [Google Scholar]
- 44.Jiang Z. H., Zhang W. J., Rao Y., and Wu J. Y. (1998) Regulation of Ich-1 pre-mRNA alternative splicing and apoptosis by mammalian splicing factors. Proc. Natl. Acad. Sci. U.S.A. 95, [DOI] [PMC free article] [PubMed] [Google Scholar]
- 45.Verhaak R. G., Goudswaard C. S., van Putten W., Bijl M. A., Sanders M. A., Hugens W., Uitterlinden A. G., Erpelinck C. A., Delwel R., Löwenberg B., and Valk P. J. (2005) Mutations in nucleophosmin (NPM1) in acute myeloid leukemia (AML): Association with other gene abnormalities and previously established gene expression signatures and their favorable prognostic significance. Blood 106, 3747–3754 [DOI] [PubMed] [Google Scholar]
- 46.Hsu C. Y., and Yung B. Y. (2000) Over-expression of nucleophosmin/B23 decreases the susceptibility of human leukemia HL-60 cells to retinoic acid-induced differentiation and apoptosis. Int. J. Cancer 88, 392–400 [DOI] [PubMed] [Google Scholar]
- 47.Colombo E., Bonetti P., Denchi E. L., Martinelli P., Zamponi R., Marine J. C., Helin K., Falini B., and Pelicci P. G. (2005) Nucleophosmin is required for DNA integrity and p19Arf protein stability. Mol. Cell. Biol. 25, 8874–8886 [DOI] [PMC free article] [PubMed] [Google Scholar]
- 48.Schaaij-Visser T. B. M., de Wit M., Lam S. W., and Jiménez C. R. (2013) The cancer secretome, current status and opportunities in the lung, breast and colorectal cancer context. Biochim. Biophys. Acta 1834, 2242–2258 [DOI] [PubMed] [Google Scholar]
- 49.De Wit M., Kant H., Piersma S. R., Pham T. V., Mongera S., van Berkel M. P., Boven E., Pontén F., Meijer G. A., Jimenez C. R., and Fijneman R. J. (2014) Colorectal cancer candidate biomarkers identified by tissue secretome proteome profiling. J. Proteomics 99, 26–39 [DOI] [PubMed] [Google Scholar]
- 50.Tauro B. J., Mathias R. A., Greening D. W., Gopal S. K., Ji H., Kapp E. A., Coleman B. M., Hill A. F., Kusebauch U., Hallows J. L., Shteynberg D., Moritz R. L., Zhu H.-J., and Simpson R. J. (2013) Oncogenic H-ras reprograms Madin–Darby canine kidney (MDCK) cell-derived exosomal proteins following epithelial-mesenchymal transition. Mol. Cell. Proteomics 12, 2148–2159 [DOI] [PMC free article] [PubMed] [Google Scholar]
- 51.Shibayama H., Takai E., Matsumura I., Kouno M., Morii E., Kitamura Y., Takeda J., and Kanakura Y. (2004) Identification of a cytokine-induced antiapoptotic molecule anamorsin essential for definitive hematopoiesis. J. Exp. Med. 199, 581–592 [DOI] [PMC free article] [PubMed] [Google Scholar]
- 52.Yu Y., Xie M., Kang R., Livesey K. M., Cao L., and Tang D. (2012) HMGB1 is a therapeutic target for leukemia. Am. J. Blood Res. 2, 36–43 [PMC free article] [PubMed] [Google Scholar]
- 53.EL Andaloussi S., Mäger I., Breakefield X. O., and Wood M. J. (2013) Extracellular vesicles: Biology and emerging therapeutic opportunities. Nat. Rev. Drug Discov. 12, 347–357 [DOI] [PubMed] [Google Scholar]
- 54.Huan J., Hornick N. I., Shurtleff M. J., Skinner A. M., Goloviznina N. A., Roberts C. T., and Kurre P. Jr. (2013) RNA trafficking by acute myelogenous leukemia exosomes. Cancer Res. 73, 918–929 [DOI] [PubMed] [Google Scholar]
Associated Data
This section collects any data citations, data availability statements, or supplementary materials included in this article.