While the bone marrow in most patients with myelodysplastic syndromes (MDS) has normal or increased cellularity (hyper-MDS), approximately 10%–15% of MDS patients will present with a hypocellular bone marrow (hypo-MDS).1 Since the diagnosis of MDS relies mainly on the presence of dyplastic morphology of myeloid precursors and/or the presence of recurrent chromosomal abnormalities, low cellularity aspirates in patients with hypo-MDS may compromise morphologic evaluation and karyotypic analyses, and ultimately contribute to difficulties in distinguishing hypo-MDS from other bone marrow failure syndromes. Further, approximately 50% of MDS patients, including those with hypo-MDS, have normal karyotype by metaphase cytogenetics (MC), which makes the distinction even more difficult.2 We previously reported that single nucleotide polymorphism (SNP) array karyotyping can improve the detection of chromosomal lesions that can distinguish hypo-MDS patients from those with aplastic anemia (AA).3 This finding suggests that clonal abnormalities can be detected in hypo-MDS and AA by using higher sensitivity methods other than MC.
Recently, next generation sequencing (NGS) technologies of the human genome identified several genes that are frequently affected by somatic mutations and play an important role in both the prognosis and the pathogenesis of MDS.4–6 Some of these mutations have a significant impact on disease phenotype, the progression of MDS to acute myeloid leukemia (AML), and on overall survival (OS).4–6 Somatic mutations in genes such as ASXL1, TET2, and DNMT3A are present in healthy individuals, and their incidence increases with age.7 More importantly, the presence of these mutations predisposes these individuals to develop hematologic malignancies.7 Furthermore, somatic mutations in genes such as ASXL1, TET2, DNMT3A and BCOR, were found in 19% of patients with AA, and their presence was associated with an increased risk of transformation to MDS and AML.8 These findings suggest that somatic mutations in certain genes have the potential to contribute to both disease initiation and progression.
Using NGS technologies, we hypothesized that identification of somatic mutations and their combinations may help to define the clonal architecture that can lead to the development of hypo-MDS, and that these somatic mutations can possibly be used to aid in establishing the diagnosis.
Bone marrow and peripheral blood samples were collected from 237 patients diagnosed with MDS (according to the 2008 WHO criteria)9 at our institution between January 2000 and December 2013. Informed consent for sample collection was obtained according to protocols approved by the institutional review boards of Cleveland Clinic and in accordance with the Declaration of Helsinki. Hypo-MDS was defined using a standard definition of bone marrow cellularity </= 25%, regardless of age. When indicated based on clinical suspicion, immunohistochemical staining for CD34 was performed to rule out/in collections of immature cells. Pathomorphologic evaluation of the marrow was performed by a hematopathologist not associated with the study, in a blinded fashion, as the study was conceived after the bone marrow review. All bone marrow biopsies that are included in our analysis were deemed to be adequate for evaluation of cellularity by our experienced hematopathologists. Cytogenetic analysis was performed on fresh aspirates according to the standard metaphase karyotyping protocol and analyzed according to ISCN guidelines.10 NGS of 62 significantly affected genes, selected based on the frequency observed in a separate cohort of MDS patients analyzed by whole exome sequencing (WES), were analyzed. The selected observations were validated by targeted deep sequencing using MiSeq (Illumina, San Diego, CA). Our sequence library for deep sequencing was generated by TruSeqCustomAmplicon (Illumina). Mutations were considered individually and grouped into several functional pathways which were hypothesized to characterize MDS pathogenesis. Variant allele frequencies (VAFs) adjusted by zygosity were used to define clonal architecture of driver versus subclonal mutations. Differences among variables were evaluated by Fisher’s exact test and the Mann-Whitney U test (i.e. Wilcoxon rank-sum test) for categorical and continuous output variables, respectively. Time-to-event analyses were plotted using the Kaplan-Meier method, and curves were compared with the two-tailed log rank test. A two sided P value <0.05 was considered to be statistically significant.
Of the 237 MDS patients included in the analysis, 32 (14%) had hypo-MDS. Compared to hyper-MDS, hypo-MDS patients presented with lower white blood cell counts (median 2.4 vs. 3.7×10⁹/L, P=0.002), and lower absolute neutrophil counts (median, 1.07 vs. 1.67×10⁹/L, P=0.01) (Online Supplementary Table S2). Cytogenetic analyses showed no significant differences between groups in: normal karyotype 38% in hyper-MDS vs. 42% in hypo-MDS, P=0.85), +8 (6% vs. 9%, P=0.43), −7/−7q (5% vs. 6%, P=0.67), complex ≥3 (17% vs. 9%, P=0.43). With a median follow up of 33.6 months (range, 0.4–128.5), the median OS for hyper-MDS was similar to hypo-MDS (23.4 vs. 29.4 months, P=0.9) (Online Supplementary Figure S1).
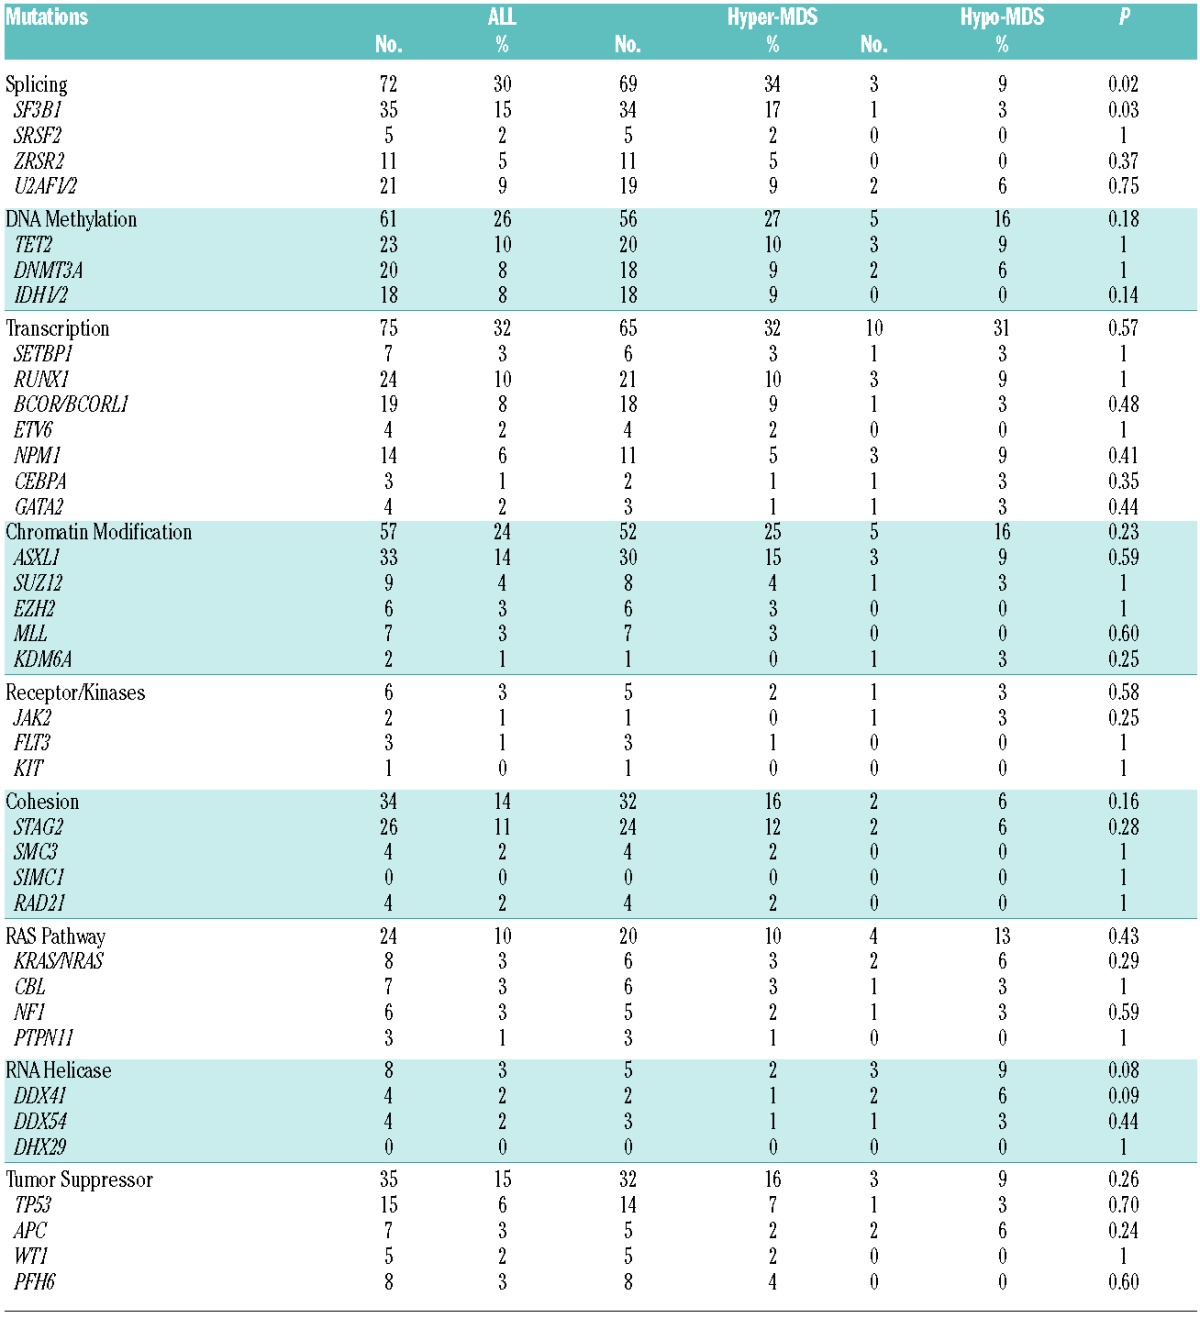
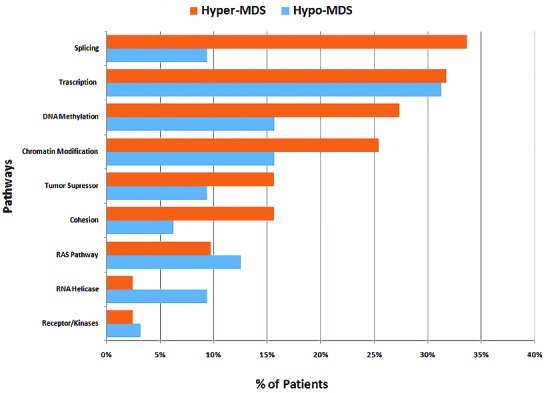
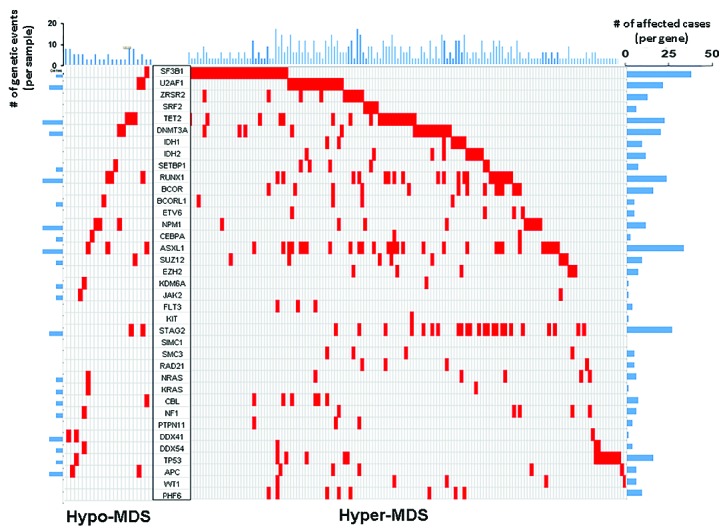
Overall, 76% of patients had at least one of the 62 screened mutations, the most common being SF3B1 (15%), ASXL1 (14%), STAG2 (11%), TET2 (10%), RUNX1 (10%), U2AF1/2 (9%), and DNMT3A (8%), (Table 1). Mutations in SF3B1 (3% vs. 17%, P=0.02), and IDH1/2 (0% vs. 9%, P=0.06) were more likely to be observed in hyper-MDS (Table 1). The mutations and their positions in hypo-MDS are included in Online Supplementary Table S3. When mutations were grouped into functional pathways known to play an important role in MDS pathophysiology, mutations in splicing machinery genes were more common in hyper-MDS compared to hypo-MDS (34% vs. 9%, P=0.03), (Table 1, Figure 1). Patients with hypo-MDS also had a lower average number of somatic mutations (mean, 1 vs. 2, P=0.03) and consonant with this finding, fewer had 2 or more mutations (28% vs. 49%, P=0.02) compared to hyper-MDS (Figure 2).
Table 1.
Mutations and pathways distribution between Hypo-MDS and Hyper-MDS.

Figure 1.

Frequency of gene mutations involved in common functional pathways. Genes included in common functional pathways: Splicing: SF3B1, SRSF2, ZRSR2, U2AF1/2. DNA methylation: TET2, DNMT3A, IDH1/2. Transcription: SETBP1, RUNX1, BCOR/BCORL1, ETV6, NPM1, CEBPA, GATA2. Chromatin Modification: ASXL1, SUZ12, EZH2, MLL, KDM6A. Receptor/Kinases: JAK2, FLT3, KIT. Cohesion: STAG2, SMC3, SIMC1, RAD21. RAS Pathway: KRAS/NRAS, CBL, NF1, PTPN11. RNA Helicase: DDX41, DDX54, DHX29. Tumor Suppressor: TP53, APC, WT1, PFH6.
Figure 2.

Distribution of mutations of significantly mutated genes in hypo-MDS vs. hyper-MDS.
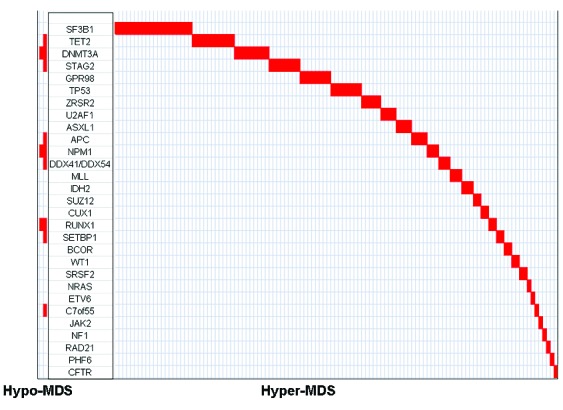
Clonal evolution has been previously described at relapse in primary AML and in MDS transforming to AML.11,12 VAF have been used to estimate the proportion of tumor cells that carry a given mutation and can identify driver clones (mutations are present in all cells) or sub-clones (mutations are present in a fraction of cells). When analyses were limited to samples with one or more mutations, 42 (13%) showed multiple driver mutations, and no distinctions between founder and subclones could be identified. However, among other samples the average size of the driver clone was higher in hyper-MDS compared to hypo-MDS (45% vs. 34%, P<0.001). Furthermore, mutations in SF3B1, ZRSR2, U2AF1, SRSF2, TET2, ASXL1, and BCOR were predominantly observed as driver clones in patients with hyper-MDS compared to hypo-MDS (Figure 3). None of the mutations were exclusively observed as a driver clone in hypo-MDS (Figure 3).
Figure 3.

Distribution of driver clones in hypo-MDS vs. hyper-MDS.
In this study, we investigated the genomic pattern of acquired somatic mutations in patients with hypo- and hyper-MDS. Although patients with hypo-MDS had similar clinical and survival characteristics, except lower WBC and ANC, acquired somatic mutation patterns were different in these two groups. Patients with hypo-MDS acquired fewer somatic mutations and had smaller driver clones compared to hyper-MDS. Somatic mutations in splicing machinery were observed predominantly in patients with hyper-MDS, and as driver clones were found exclusively in patients with hyper-MDS. Several other mutations, such as TET2, ASXL1, and BCOR, etc..(Figure 1), were also found to be driver clones in patients with hyper-MDS compared to hypo-MDS. One possible explanation for these findings is that the immune system in patients with hypo-MDS may suppress the driver clone, inhibiting its growth and genetic evolution, thus limiting the acquisition of downstream somatic lesions. On the other hand, some driver clones, such as SF3B1, SRSF2, TET2, ASXL1, and BCOR may overcome this inhibitory effect. Supporting this theory, experimental and clinical evidence suggests that immune-mediated damage to hematopoietic precursors plays an important role in a subset of patients with MDS – particularly hypo-MDS.13,14 Additionally, some patients with MDS - especially hypo-MDS - respond to treatment with immunosuppressive therapy such as cyclosposine +/−ATG, and alemtuzumab, suggesting that immune-mediated mechanisms play an important role in the pathophysiology of hypo-MDS.14,15 Two patients in our hypo-MDS cohort received treatment with ATG +/− cyclosporine: one with a DNMT3A mutation and an initial bone marrow cellularity of <5% progressed to AML with a bone marrow cellularity of 90% after 6 months of treatment with ATG/cyclosporine; another with an APC mutation and an initial bone marrow cellularity of <25% progressed after 10 months of treatment with ATG/cyclosporine, with a 50% cellularity marrow with increased blasts. These limited examples suggest that disrupting the immune system in patients with hypo-MDS may result in a growth advantage of the driver clone, leading to progression to hypercellular marrows. Another piece of evidence of the interaction between acquired somatic mutations and the immune system has been recently explored in patients with AA. Kulasekararaj et al. showed that 19% of patients with AA acquire somatic mutations in genes such as ASXL1, TET2, DNMT3A, and BCOR, and that the presence of these genes was associated with longer disease duration and an increased risk of transformation to MDS/AML.8 Similar mutations were found as driver clones in our patient cohort with hyper-MDS, suggesting that these mutations have a progressive advantage that may overcome the inhibitory effect from the immune system that is also seen in patients with AA. Since the diagnosis of AA is often difficult to distinguish morphologically from hypo-MDS, the use of somatic mutations patterns to aid with the diagnosis should be explored further in future studies.
In conclusion, hypo-MDS is a morphological entity, rather than a truly separate diagnosis from classic hyper-MDS. Although clinical characteristics and outcome are similar for hypo-and hyper-MDS, genomic differences in the driver clones exist between the two groups. Additional analyses comparing genomic changes in hypo-MDS to other bone marrow failure syndromes such as AA are needed to further understand the underlying genetic changes in these diseases.
Footnotes
Funding: Supported in part by NIH grants from R01 655365071402, U54 655365070704, K24 655365071503.
Information on authorship, contributions, and financial & other disclosures was provided by the authors and is available with the online version of this article at www.haematologica.org.
References
- 1.Sloand EM. Hypocellular myelodysplasia. Hematol Oncol Clin North Am 2009;23(2):347–360. [DOI] [PubMed] [Google Scholar]
- 2.Huang TC, Ko BS, Tang JL, et al. Comparison of hypoplastic myelodysplastic syndrome (MDS) with normo-/hypercellular MDS by International Prognostic Scoring System, cytogenetic and genetic studies. Leukemia 2008;22(3):544–550. [DOI] [PubMed] [Google Scholar]
- 3.Afable MG, 2nd, Wlodarski M, Makishima H, et al. SNP array-based karyotyping: differences and similarities between aplastic anemia and hypocellular myelodysplastic syndromes. Blood 2011; 117(25):6876–6884. [DOI] [PMC free article] [PubMed] [Google Scholar]
- 4.Haferlach T, Nagata Y, Grossmann V, et al. Landscape of genetic lesions in 944 patients with myelodysplastic syndromes. Leukemia 2014;28(2):241–247. [DOI] [PMC free article] [PubMed] [Google Scholar]
- 5.Bejar R, Stevenson K, Abdel-Wahab O, et al. Clinical effect of point mutations in myelodysplastic syndromes. N Engl J Med 2011; 364(26):2496–2506. [DOI] [PMC free article] [PubMed] [Google Scholar]
- 6.Papaemmanuil E, Gerstung M, Malcovati L, et al. Clinical and biological implications of driver mutations in myelodysplastic syndromes. Blood 2013;122(22):3616–3627; quiz 3699. [DOI] [PMC free article] [PubMed] [Google Scholar]
- 7.Jaiswal S, Fontanillas P, Flannick J, et al. Age-related clonal hematopoiesis associated with adverse outcomes. N Engl J Med 2014;371(26):2488–2498. [DOI] [PMC free article] [PubMed] [Google Scholar]
- 8.Kulasekararaj AG, Jiang J, Smith AE, et al. Somatic mutations identify a subgroup of aplastic anemia patients who progress to myelodysplastic syndrome. Blood 2014;124(17):2698–2704. [DOI] [PMC free article] [PubMed] [Google Scholar]
- 9.Vardiman JW, Thiele J, Arber DA, et al. The 2008 revision of the World Health Organization (WHO) classification of myeloid neoplasms and acute leukemia: rationale and important changes. Blood 2009;114(5):937–951. [DOI] [PubMed] [Google Scholar]
- 10.International Standing Committee on Human Cytogenetic Nomenclature., Shaffer LG, Tommerup N. ISCN 2005 : an international system for human cytogenetic nomenclature (2005) : recommendations of the International Standing Committee on Human Cytogenetic Nomenclature Basel; Farmington, CT: Karger, 2005. [Google Scholar]
- 11.Walter MJ, Shen D, Ding L, et al. Clonal architecture of secondary acute myeloid leukemia. N Engl J Med 2012;366(12):1090–1098. [DOI] [PMC free article] [PubMed] [Google Scholar]
- 12.Ding L, Ley TJ, Larson DE, et al. Clonal evolution in relapsed acute myeloid leukaemia revealed by whole-genome sequencing. Nature 2012;481(7382):506–510. [DOI] [PMC free article] [PubMed] [Google Scholar]
- 13.Calado RT. Immunologic aspects of hypoplastic myelodysplastic syndrome. Semin Oncol 2011;38(5):667–672. [DOI] [PMC free article] [PubMed] [Google Scholar]
- 14.Sloand EM, Barrett AJ. Immunosuppression for myelodysplastic syndrome: how bench to bedside to bench research led to success. Hematol Oncol Clin North Am 2010;24(2):331–341. [DOI] [PMC free article] [PubMed] [Google Scholar]
- 15.Yazji S, Giles FJ, Tsimberidou AM, et al. Antithymocyte globulin (ATG)-based therapy in patients with myelodysplastic syndromes. Leukemia 2003;17(11):2101–2106. [DOI] [PubMed] [Google Scholar]


