

Abstract
The 2008 World Health Organization classification proposed a new entity in childhood myelodysplastic syndrome, refractory cytopenia of childhood. However, it is unclear whether this morphological classification reflects clinical outcomes. We retrospectively reviewed bone marrow morphology in 186 children (median age 8 years; range 1–16 years) who were enrolled in the prospective study and received horse antithymocyte globulin and cyclosporine between July 1999 and November 2008. The median follow-up period was 87 months (range 1–146 months). Out of 186 patients, 62 (33%) were classified with aplastic anemia, 94 (49%) with refractory cytopenia of childhood, and 34 (18%) with refractory cytopenia with multilineage dysplasia. Aplastic anemia patients received granulocyte colony-stimulating factor more frequently and for longer durations than other patients (P<0.01). After six months, response rates to immunosuppressive therapy were not significantly different among the 3 groups. Acquisition of chromosomal abnormalities was observed in 5 patients with aplastic anemia, 4 patients with refractory cytopenia of childhood, and 3 patients with refractory cytopenia with multilineage dysplasia. Although the cumulative incidence of total clonal evolution at ten years was not significantly different among the 3 groups, the cumulative incidence of monosomy 7 development was significantly higher in aplastic anemia than in the other groups (P=0.02). Multivariate analysis revealed that only granulocyte colony-stimulating factor administration duration of 40 days or more was a significant risk factor for monosomy 7 development (P=0.02). These findings suggest that even the introduction of a strict morphological distinction from hypoplastic myelodysplastic syndrome cannot eradicate clonal evolution in children with aplastic anemia.
Introduction
Childhood bone marrow failures (BMFs) are classified as aplastic anemia (AA), hypoplastic myelodysplastic syndrome (MDS), and inherited bone marrow failure syndromes (IBMFs). The distinction between AA and hypoplastic MDS is challenging, particularly when no chromosomal aberrations are detected. In 2008, the revised World Health Organization (WHO) classification proposed “refractory cytopenia of childhood” (RCC) as a group of provisional entities.1 The spectrum of patients with RCC is wide, ranging from those with severe hypocellular bone marrow (BM) with mild dysplasia, to those with normocellular BM with distinct dysplasia who meet the criteria for refractory cytopenia with multilineage dysplasia (RCMD) in adults. Currently, the WHO classification recommends that children who fit the criteria for RCMD be considered as having RCC until it is fully clarified whether the number of lineages involved is an important prognostic discriminator in childhood MDS.1 To date, few studies have focused on the correlation between morphological classifications of childhood BMFs according to the new WHO classification and clinical outcomes. Before 2008, a considerable proportion of patients in Japan who met the criteria of RCC were diagnosed with AA. We conducted a prospective study involving antithymocyte globulin (ATG) and cyclosporine (CyA) therapy for AA (AA-97 study) that may have included not only children with AA but also those with RCC.2 Fortunately, this provided a unique opportunity to compare the long-term outcomes of patients with AA and RCC because we had reserved BM specimens from enrolled patients.
Methods
Patients
Between October 1997 and November 2008, a total of 464 Japanese children from 138 hospitals were enrolled in the AA-97 multicenter study conducted by the Japan Childhood Aplastic Anemia Study Group. Patients with acquired AA were eligible if the following criteria were satisfied: age under 18 years; newly-diagnosed disease (<180 days) without specific prior treatment; and moderate to very severe AA. The disease was considered severe if at least 2 of the following were noted: neutrophil count less than 0.5×10⁹/L, platelet count less than 20×109/L, or reticulocyte count less than 20×109/L with hypocellular BM. Aplastic anemia was considered very severe if the criteria for severe disease were fulfilled and the neutrophil count was less than 0.2×10⁹/L. Moderate disease was defined by at least 2 of the following: neutrophil count less than 1.0×10⁹/L, platelet count less than 50×109/L, or reticulocyte count less than 60×109/L. Patients with IBMFs or paroxysmal nocturnal hemoglobinuria (PNH) were excluded. Specifically, Fanconi anemia was excluded by chromosome fragility test administered to all patients. Dyskeratosis congenita was screened by measuring the telomere length of the peripheral lymphocytes, as previously reported.3 Because allogeneic stem cell transplantation was recommended for patients with severe or very severe disease who had a human leukocyte antigen (HLA)-matched sibling, these patients were not included in the AA-97 study. Written informed consent was obtained from all parents and all patients over the age of ten years in accordance with the Declaration of Helsinki. All study protocols were approved by the ethics committee of each participating hospital.
Out of the 464 patients enrolled in the AA-97 study, 57 with hepatitis-associated AA were excluded from the study. Out of the remaining 407 patients, we could retrospectively review BM morphology in 186 patients (median age 8 years; range 1–16 years) with available BM specimens (Table 1). The characteristics of the patients with available BM specimens were comparable with those of patients without available BM specimens. The median follow-up period was 87 months (range 1–146 months). Fifty patients had non-severe, 54 had severe, and 82 had very severe disease. According to the 2008 WHO classification, all 186 patients were classified as AA, RCC, or RCMD. Refractory cytopenia of childhood was defined as persistent cytopenia with less than 2% blasts in the peripheral blood (PB) and less than 5% blasts in the BM. Additionally, BM marrow aspirate smears exhibited dysplastic changes in 2 cell lineages or more, or 10% or more within one cell lineage. On the other hand, RCMD was defined as persistent cytopenia with less than 1% blasts in the PB and less than 5% blasts in the BM. In addition, BM smears exhibited 10% or more dysplastic changes in 2 or more cell lineages.1
Table 1.
Comparison of patients’ characteristics and laboratory findings among children with aplastic anemia, refractory cytopenia of childhood, refractory cytopenia with multilineage dysplasia.

Immunosuppressive therapy
All patients were treated with a combination of intravenous horse ATG (Lymphoglobulin; Genzyme, Cambridge, USA) at 15 mg/kg/day for five days and oral CyA at 6 mg/kg/day. The CyA dose was adjusted to maintain trough levels between 100 and 200 ng/mL, and appropriate doses were administered for at least six months. Granulocyte colony stimulating factor (G-CSF, Filgrastim; Kyowa Hakko Kirin, Tokyo, Japan) was administered intravenously or subcutaneously at doses of 400 μg/m2 for three months to patients with very severe disease. After the neutrophil count increased to more than 1.0×10⁹/L, the G-CSF was administered at the same dose 3 times a week for two months. Responses to immunosuppressive therapy (IST) were evaluated at six months after therapy initiation, according to previously described criteria.2 The overall response was defined as a complete response (CR) or partial response (PR) at six months after IST. Death, relapse, MDS or acute myeloid leukemia (AML) development, and disease progression requiring clinical intervention were considered treatment failures.
Statistical analyses
Differences in base-line characteristics and treatment outcomes among patients with AA, RCC, and RCMD were assessed using the χ2 or Fisher’s exact test for categorical variables and the Mann-Whitney U test for continuous variables. Parameters for univariate analyses to determine predictors of response to IST included age at diagnosis, gender, morphological classification, disease severity, leukocyte count, neutrophil count, hemoglobin level, reticulocyte count, platelet count and interval between diagnosis and treatment. Parameters for univariate analyses to determine risk factors for monosomy 7 development included age at diagnosis, gender, morphological classification, disease severity, G-CSF therapy duration, and no response to IST after six months. Pre-treatment laboratory values were defined as the lowest values without transfusion during the four weeks preceding IST. To evaluate correlations between these parameters and the response to IST, or monosomy 7 development, differences in continuous variables were analyzed using the Mann-Whitney U-test; whereas differences in frequencies were tested using the χ2 or Fisher’s exact test. Logistic regression modeling was performed for multivariate analyses. Important co-variates in the multivariate models were chosen using stepwise variable selection procedures. The overall survival (OS) and failure-free survival (FFS) rates, and cumulative incidence of clonal evolution were analyzed using the Kaplan-Meier method. Differences among study arms were evaluated using the log rank test. P<0.05 was considered statistically significant. All analyses were performed using SPSS 22.0 software (SPSS, Inc., Chicago, IL, USA).
Results
Morphological classification
One hundred and eighty-six patients were classified as having AA (n=61, 32%), RCC (n=91, 50%), or RCMD (n=34, 18%). Median ages in the AA, RCC, and RCMD groups were 7, 6, and 12 years, respectively (P=0.60). Male/female ratios in the AA, RCC, and RCMD groups were 1.9, 1.3, and 1.3, respectively (P=0.46). Distributions of disease severity differed among the 3 groups. Although 47 of 61 (77%) patients in the AA group had very severe disease, only 28 of 91 (31%) patients in the RCC group and 7 of 34 (21%) patients in the RCMD group had very severe disease. On the other hand, 31 of 91 (34%) patients in the RCC group and 14 of 34 (41%) patients in the RCMD group had non-severe disease (P<0.01). Leukocyte, neutrophil, reticulocyte and platelet counts were significantly lower in the AA group than in the RCC and RCMD groups (Table 1).
Treatment outcome
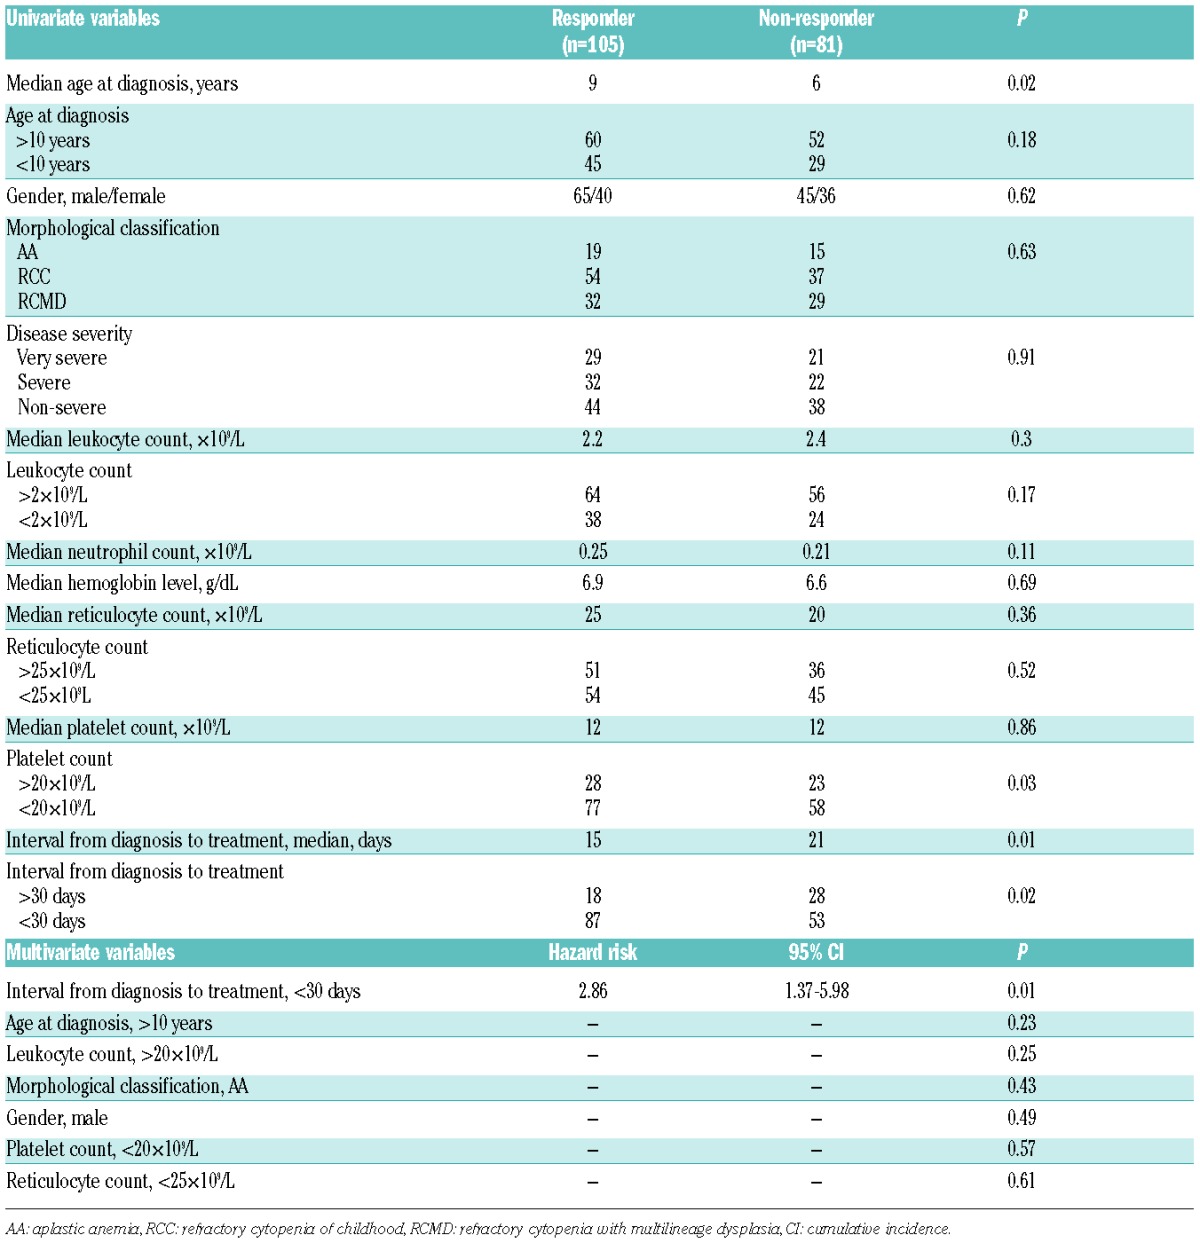
After three and six months, there was no significant difference in respective response rates to IST among the 3 groups: AA, 38% and 52%; RCC, 51% and 59%; and RCMD, 41% and 56% (P=0.29 and 0.63) (Table 2). Predictors of IST response were evaluated through univariate and multivariate analyses. Univariate analysis revealed that an older age at diagnosis, lower platelet count (<20×109/L), and shorter interval between diagnosis and treatment (<30 days) were predictive of the IST response. Morphological classification was not associated with the IST response (P=0.43). Multivariate analysis revealed that only a shorter interval between diagnosis and treatment (<30 days; P=0.01) significantly predicted a better response to IST (Table 3).
Table 2.
Comparison of treatment outcomes among children with aplastic anemia, refractory cytopenia of childhood, refractory cytopenia with multilineage dysplasia.
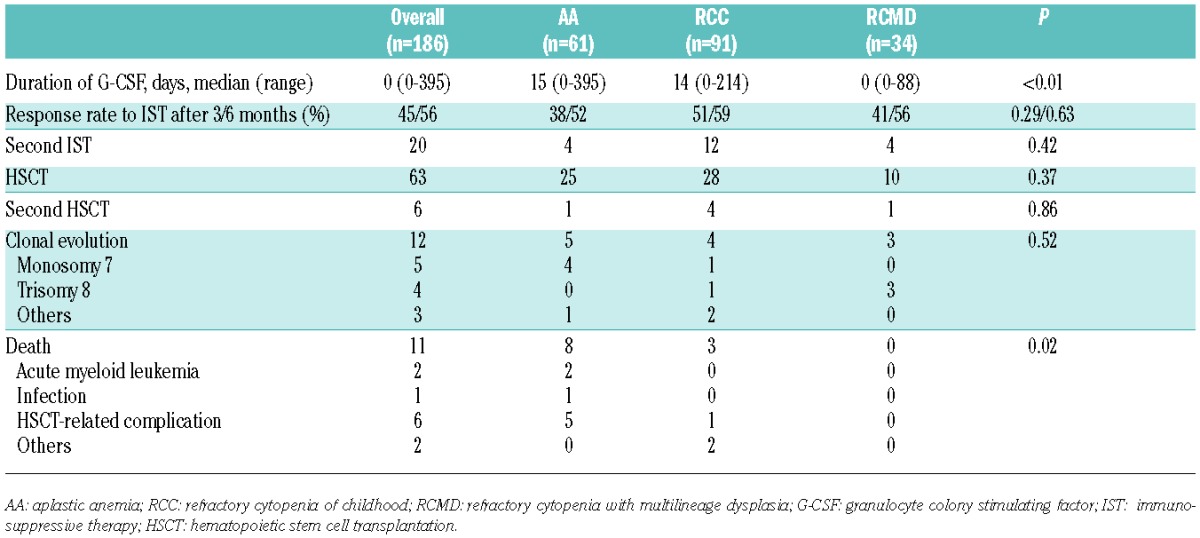
Table 3.
Univariate and multivariate analyses for the IST response.
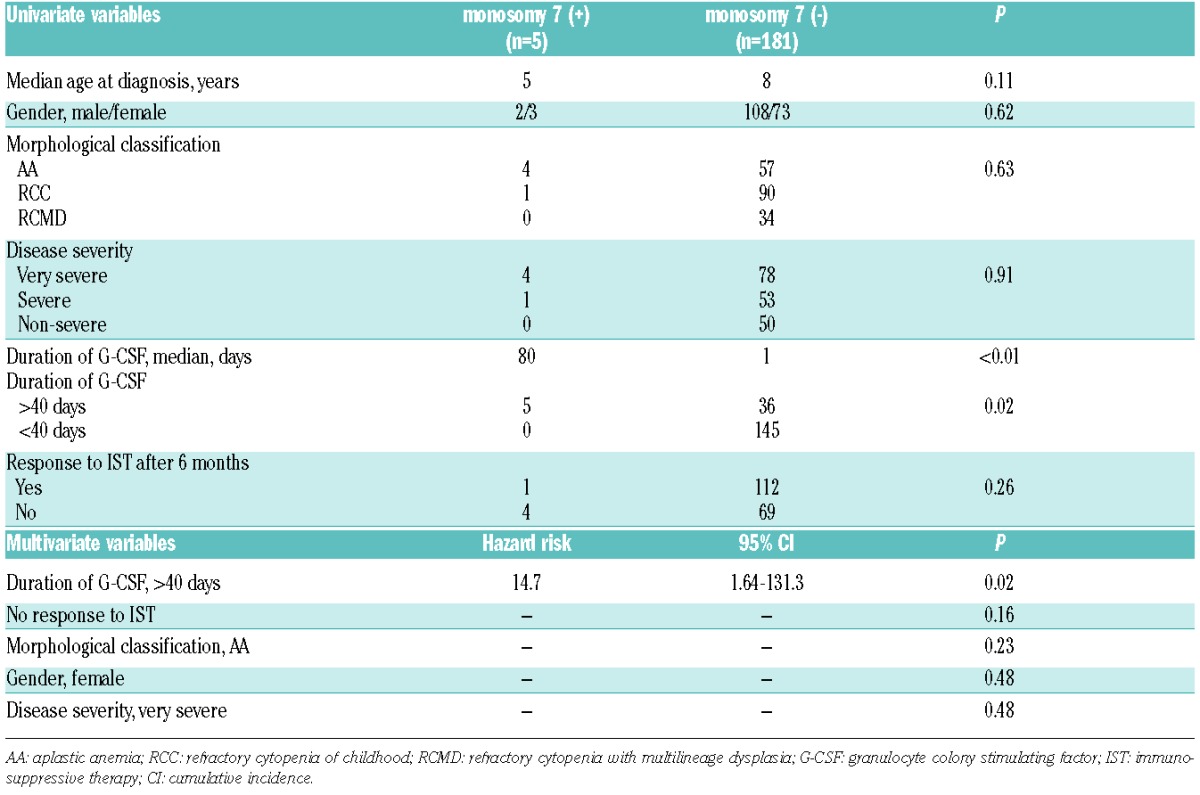
Acquisition of clonal cytogenetic abnormalities was observed in 5 patients in the AA group (monosomy 7, n=4; other, n=1), 4 patients in the RCC group (monosomy 7, n=1; trisomy 8, n=1; others, n=2), and 3 patients in the RCMD group (trisomy 8, n=3) (Table 4). All 5 patients in the AA group had very severe disease and were administered G-CSF for 40 days or more (median 139 days; range 43–393 days). One patient in the RCC group who developed monosomy 7 was also administered G-CSF for 80 days. All 3 patients in the RCMD group had non-severe disease, and one was administered G-CSF for eight days. All 5 patients who developed monosomy 7 underwent hematopoietic stem cell transplantation (HSCT). Two of these patients died of disease progression to AML, and one died of veno-occlusive disease of the liver. On the other hand, 3 patients who developed trisomy 8 was still alive without HSCT. A fourth patient who developed trisomy 8 underwent HSCT and was still alive. Although the cumulative incidence of total clonal evolution at ten years did not significantly differ among the 3 groups (Figure 1A), the cumulative incidence of monosomy 7 was significantly higher in the AA group (6.9%, 95%CI: 3.3–10) than in the other groups (0.1%, 95%CI: 0.0–0.9) (P=0.02) (Figure 1B). Risk factors for development of monosomy 7 were evaluated through univariate and multivariate analyses. Univariate analysis revealed that morphological classification did not associate with monosomy 7 development (P=0.63), and that only a longer duration of G-CSF administration was identified as a risk factor for monosomy 7 development (P<0.01). Multivariate analysis confirmed the univariate analysis result (P=0.02) (Table 5). The cumulative incidence of monosomy 7 development was significantly higher in patients who were administered G-CSF for 40 days or more (11%, 95%CI: 6.0–16) versus less than 40 days (5.5%, 95%CI: 3.4–7.6) (P<0.01) (Figure 1C). The numbers of patients administered G-CSF for 40 days or more were 27 (44%) in the AA, 11 (12%) in the RCC, and 3 (9%) in the RCMD groups (P<0.01).
Table 4.
Patients with clonal evolution after immunosuppressive therapy.

Figure 1.

The cumulative incidence (CI) of clonal evolution at ten years in the aplastic anemia, refractory cytopenia of childhood, refractory cytopenia with multilineage dysplasia groups. (A) The cumulative incidence of total clonal evolution at ten years did not significantly differ among the aplastic anemia (AA), refractory cytopenia of childhood (RCC), and refractory cytopenia with multilineage dysplasia (RCMD) groups. (B) The cumulative incidence of monosomy 7 development was significantly higher in the AA group [6.9%, 95% confidence interval (CI): 3.3–10] than in the other groups (0.1%, 95% CI: 0.0–0.9) (P=0.02). (C) he cumulative incidence of monosomy 7 development was significantly higher in patients who were administered G-CSF for ≥40 days (11%, 95%CI: 6.0–16) versus <40 days (5.5%, 95% CI:3.4–7.6) (P<0.01).
Table 5.
Univariate and multivariate analyses of risk factors for monosomy 7 development.
Twenty patients, including 4 in the AA, 12 in the RCC, and 4 in the RCMD groups, received a second IST. HSCT was performed in 63 patients, including 25 in the AA, 28 in the RCC, and 10 in the RCMD groups (Table 2). The estimated probability of FFS at ten years did not significantly differ among the 3 groups (Figure 2A). On the other hand, the estimated probability of OS at ten years was significantly lower in the AA group (85%, 95%CI: 80–90) than in the RCC (97%, 95%CI: 95%–99%) and RCMD (100%, 95%CI: 100–100) groups (P=0.01) (Figure 2B). In the AA group, 2 patients died of AML and 5 patients died of HSCT-related complications (Table 2).
Figure 2.

The estimated probability of failure-free survival (FFS) and overall survival (OS). (A) The estimated probability of FFS at ten years did not significantly differ among the aplastic anemia (AA), refractory cytopenia of childhood (RCC), and refractory cytopenia with multilineage dysplasia (RCMD) groups. (B) The estimated probability of OS at ten years was significantly lower in the AA group [85%, 95% confidence interval (CI): 80–90] than in the RCC (97%, 95%CI: 95–99%) and RCMD groups (100%, 95%CI: 100–100) (P=0.01).
Discussion
With the opening of a prospective study conducted by the European Working Group of MDS of Childhood (EWOG-MDS) in 1998, a central morphological review was initiated and the new diagnostic entity refractory cytopenia of childhood, “RCC”, was proposed by the EWOG-MDS group. Refractory cytopenia of childhood is characterized by persistent cytopenia with less than 2% blasts in the PB and less than 5% blasts in the BM. In addition, RCC patients exhibit dysplastic changes in at least 10% of erythroid precursors or granulocytic precursors and neutrophils.1 Since approximately 75% of children with RCC have hypocellular BM, differentiation between acquired AA and RCC is difficult even for experienced hematologists and pathologists. The diagnosis of RCC had been mainly used by the EWOG-MDS members until 2008, when the WHO classification proposed RCC as a subtype of MDS in children. In adults, hypoplastic MDS is separated into refractory cytopenia with unilineage dysplasia (RCUD) and RCMD. The latter is defined as persistent cytopenia with less than 1% blasts in the PB and less than 5% blasts in the BM and 10% or more of dysplasia in 2 or more cell lineages. The WHO classification recommends that children who fit the criteria for RCMD be considered as having RCC until it is clarified whether the number of lineages involved is an important prognostic factor.1
To date, few studies outside of the EWOG-MDS have investigated the clinical relevance of RCC. In collaboration with hematologists and pathologists, we previously conducted a joint review of BM smears and trephine biopsies from 100 children with BMFs. We found that a considerable percentage of these patients met the criteria of RCMD. The final consensus for these diagnoses was AA in 29 patients, RCC in 58 patients and RCMD in 13 patients. None of the RCMD patients had severe hypoplastic BM.4 In the EWOG-MDS study, 355 patients with RCC were classified as either RCC with decreased cellularity (n=288) or RCC with increased or normal cellularity (n=67).5 Because the RCMD/RCC ratio (13/58, 0.22) in our study was similar to RCC with increased or normal cellularity/RCC with decreased cellularity ratio (67/288, 0.23) in the EWOG-MDS study, the cases of RCMD in our study may correspond to the cases of RCC with increased or normal cellularity in the EWOG-MDS study.
We re-classified 186 patients who had received IST with ATG and CyA according to the WHO classification. Of these patients, 61 (32%) were classified as AA, 91 (50%) as RCC, and 34 (18%) with RCMD. The distribution of each diagnosis was similar to that in our previous study.
Aplastic anemia is considered as an immune-mediated BMF, and IST is indicated for children with severe AA who do not have an HLA-matched family donor. Refractory cytopenia of childhood and RCMD are subtypes of MDS and are generally considered curable only by HSCT. The EWOG-MDS group indicated IST with ATG and CyA for 95 selected patients with hypocellular BM but without unfavorable karyotypes such as monosomy 7. The researchers compared the outcomes of 46 patients who received horse ATG and 49 who received rabbit ATG. The response rates at six months were 74% for horse ATG and 53% for rabbit ATG. Seven patients with RCC and normocellular BM who received IST were excluded from the analysis because they did not meet the eligibility criteria. In fact, only one of these 7 patients responded to IST. The researchers concluded that IST could be a promising option for selected patients with RCC, although the response of RCC to IST is less favorable than that of severe AA.6
In the current study, there was no significant difference in response rates to IST among patients with AA, RCC, and RCMD. Through univariate and multivariate analyses, morphological diagnosis was found not to associate with the response to IST. It is noteworthy that even the RCMD patients with normocellular BM responded to IST. Recently, Qin et al. retrospectively analyzed the clinical data and histopathological morphology in BM biopsies from 130 children with acquired BMFs.7 Through collaboration with Baumann, a reference pathologist in the EWOG-MDS, these patients were classified as RCC (n=78, 60%) or AA patients (n=52, 40%). The rate of response to IST at six months was superior in RCC patients (75%) relative to AA patients (38%) (P<0.01). These data suggest the presence of immune-mediated BM suppression in patients with both RCC and RCMD. On the other hand, 40% of patients with AA, RCC and RCMD did not respond to the IST in this study, suggesting that the immunosuppression might not be enough for patients who did not respond to the IST, or the subset of patients with these 3 diseases might be caused by a non-immunological mechanism.
T-cell receptor (TCR)-Vβ CDR3 region skewing and minor PNH clones have been described to indicate immunologically-mediated pathophysiology. The EWOG-MDS study demonstrated TCR-Vβ CDR3 skewing in the BM from 31 of 79 (39%) patients with RCC.8 The same study found minor PNH clones in erythrocytes and/or granulocytes from 36 of 87 (41%) patients with RCC.9 These frequencies among patients with RCC were comparable to those among patients with AA, implicating an immune-mediated pathogenesis in both diseases.
The evolution of AA into MDS and AML is a serious problem. Early evolution may be ascribed to the overlap between AA and RCC/RCMD at the time of diagnosis. A strict distinction between AA and RCC/RCMD is expected to reduce the incidence of early clonal evolution among patients with AA. In fact, 13 of 88 patients with AA in Germany developed clonal disease after IST between 1994 and 1998, during which a central review by reference pathologists was not conducted. In contrast, only 3 of 123 patients with AA developed clonal disease between 1998 and 2004, following the introduction of the central review.10 Unexpectedly, there was no difference in the cumulative incidence of total clonal evolution between patients with AA and RCC/RCMD in the current study. It is noteworthy that monosomy 7 was observed in 4 of 5 patients with AA, but in only one of 7 patients with RCC/RCMD. The cumulative incidence of monosomy 7 was significantly higher among patients with AA than among those with RCC/RCMD. Univariate analysis revealed that morphological classification was not related to monosomy 7 development; instead, a longer duration of G-CSF administration was associated with development of monosomy 7. Multivariate analysis confirmed the result of this univariate analysis. Most patients with AA had severe neutropenia and required G-CSF administration. On the other hand, patients with RCC/RCMD exhibited less severe neutropenia and thus had a lower requirement for G-CSF administration.
It remains controversial whether use of G-CSF might increase the incidence of MDS/AML after IST among patients with AA. A laboratory study suggested that high G-CSF concentrations favor the expansion of monosomy 7-harboring clones, which agrees with our observation.11 Until now, a total of 4 prospective studies were reported including our previous study, in which patients with AA were randomized to receive the IST with or without G-CSF.12–15 Because the patient cohort of each study was relatively small, we carried out a meta-analysis. There was no difference in frequencies of the development of cytogenetic abnormalities and MDS/AML between patients with and without G-CSF (data not shown). However, the relationship between the duration of G-CSF administration and the development of cytogenetic abnormalities and MDS/AML was not evaluated in these studies. Moreover, cytogenetic abnormalities included not only monosomy 7 but also other types of abnormalities. We previously reported that the duration of G-CSF administration was a significant risk factor for the development of MDS in patients with AA in another patient cohort.16 In the present study, a longer duration of G-CSF administration was again identified as a risk factor for the development of monosomy 7. Since monosomy 7 was sometimes detected in patients with AA who did not receive G-CSF,16 it is likely that G-CSF dose not directly cause the development of monosomy 7 but facilitates the growth of aberrant clones with monosomy 7.
Next generation sequencing has recently been applied to identify genetic alterations associated with various hematologic diseases. The frequency of somatic mutations ranges from 80% to 90% among patients with MDS.17,18 TET2, DNMT3A, and ASXL1 were the most frequently detected among these mutations. The high frequency of somatic mutations in patients with MDS contrasts with the low frequency in patients with AA.19,20 Somatic mutations, including ASXL1, DNMT3A, and BCOR, were detected in 19% and 23% of AA in adults. Although these mutations are mainly associated with myeloid malignancies, they have also been detected in blood from individuals without apparent blood diseases and were associated with advanced age.21 Therefore, the frequency of somatic mutations is expected to be low in children.
In conclusion, to reveal whether these 3 groups are different entities, it will be necessary to prospectively compare the clinical outcomes and biological findings in large numbers of patients with AA, RCC, and RCMD.
Acknowledgments
The authors would like to thank Ms. Hiroe Namizaki for secretarial assistance. We also thank all of the patients, families, and referring physicians who provided precise data.
Footnotes
Authorship and Disclosures
Information on authorship, contributions, and financial & other disclosures was provided by the authors and is available with the online version of this article at www.haematologica.org.
References
- 1.Baumann I, Niemeyer CM, Benett JM, Shannon K. Childhood myelodysplastic syndrome. In: Swerdlow SH, Campo E, Harris NL, et al., eds. World Health Organization Classification of Tumors of Haematopoietic and Lymphoid Tissues. Lyon: IARC Press; 2008:104–107. [Google Scholar]
- 2.Kosaka Y, Yagasaki H, Sano K, et al. Prospective multicenter trial comparing repeated immunosuppressive therapy with stem-cell transplantation from an alternative donor as second-line treatment for children with severe and very severe aplastic anemia. Blood 2008;111(3):1054–1059. [DOI] [PubMed] [Google Scholar]
- 3.Sakaguchi H, Nishio N, Hama A, et al. Peripheral blood lymphocyte telomere length as a predictor of response to immunosuppressive therapy in childhood aplastic anemia. Haematologica 2014; 99(8):1312–1316. [DOI] [PMC free article] [PubMed] [Google Scholar]
- 4.Yang W, Zhang P, Hama A, et al. Diagnosis of acquired bone marrow failure syndrome during childhood using the 2008 World Health Organization classification system. Int J Hematol 2012;96(1):34–38. [DOI] [PubMed] [Google Scholar]
- 5.Niemeyer CM, Baumann I. Classification of childhood aplastic anemia and myelodysplastic syndrome. Hematology Am Soc Hematol Educ Program 2011;2011:84–89. [DOI] [PubMed] [Google Scholar]
- 6.Yoshimi A, van den Heuvel-Elbrink MM, Baumann I, et al. Comparison of horse and rabbit antithymocyte globulin in immunosuppressive therapy for refractory cytopenia of childhood. Haematologica 2014;99(4):656–663. [DOI] [PMC free article] [PubMed] [Google Scholar]
- 7.Qin X, Baumann I, Chen J, et al. Refractory cytopenia of children and acquired aplastic anemia: a clinical and pathological study of 130 cases. Zhonghua Xue Ye Xue Za Zhi 2014;35(8):713–718. [DOI] [PubMed] [Google Scholar]
- 8.Aalbers AM, van den Heuvel-Elbrink MM, Baumann I, et al. T-cell receptor V skewing frequently occurs in refractory cytopenia of childhood and is associated with an expansion of effector cytotoxic T cells: a prospective study by EWOG-MDS. Blood Cancer J 2014;4:e209–215. [DOI] [PMC free article] [PubMed] [Google Scholar]
- 9.Aalbers AM, van der Velden VH, Yoshimi A, et al. The clinical relevance of minor paroxysmal nocturnal hemoglobinuria clones in refractory cytopenia of childhood: a prospective study by EWOG-MDS. Leukemia 2014;28(1):189–192. [DOI] [PubMed] [Google Scholar]
- 10.Baumann I, Fuhrer M, Behrendt S, et al. Morphological differentiation of severe aplastic anemia from hypocellular refractory cytopenia of childhood: reproducibility of histopathological diagnostic criteria. Histopathology 2012;61(1):10–17. [DOI] [PubMed] [Google Scholar]
- 11.Sloand EM, Yong AS, Ramkissoon S, et al. Granulocyte colony-stimulating factor preferentially stimulates proliferation of monosomy 7 cells bearing the isoform IV receptor. Proc Natl Acad Sci USA 2006; 103(39):14483–14488. [DOI] [PMC free article] [PubMed] [Google Scholar]
- 12.Kojima S, Hibi S, Kosaka Y, et al. Immunosuppressive therapy using antithymocyte globulin, cyclosporine, and danazol with or without human granulocyte colony-stimulating factor in children with acquired aplastic anemia. Blood 2000; 96(6):2049–2054. [PubMed] [Google Scholar]
- 13.Gluckman E, Rokicka-Milewska R, Hann I, et al. Results and follow-up of a Phase 3 randomized study of recombinant human-granulocyte stimulating factor as support for immunosuppressive therapy in patients with severe aplastic anemia. Br J Haematol 2002;119(4):1075–1082. [DOI] [PubMed] [Google Scholar]
- 14.Teramura M, Kimura A, Iwase S, et al. Treatment of severe aplastic anemia with antithymocyte globulin and cyclosporine A with or without G-CSF in adults: a multi-center randomized study in Japan. Blood 2007;110(6):1756–1761. [DOI] [PubMed] [Google Scholar]
- 15.Tichelli A, Schrezenmeier H, Socie G, et al. A randomized controlled study in patients with newly diagnosed severe aplastic anemia receiving antithymocyte globulin (ATG) and cyclosporine with or without G-CSF: a study of the SAA Working Party of the European Group for Blood and Marrow Transplantation. Blood 2011;117(17):4434–4441. [DOI] [PubMed] [Google Scholar]
- 16.Kojima S, Ohara A, Tsuchida M, et al. Risk factors for evolution of acquired aplastic anemia into myelodysplastic syndrome and acute myeloid leukemia after immunosuppressive therapy in children. Blood. 2002;100:(3)786–790. [DOI] [PubMed] [Google Scholar]
- 17.Haferlach T, Nagata Y, Grossmann V, et al. Landscape of genetic lesions in 944 patients with myelodysplastic syndromes. Leukemia 2014;28(2):241–247. [DOI] [PMC free article] [PubMed] [Google Scholar]
- 18.Papaemmanuil E, Gerstung M, Malcovati L, et al. Clinical and biological implications of driver mutations in myelodysplastic syndromes. Blood 2013;122(22):3616–3627. [DOI] [PMC free article] [PubMed] [Google Scholar]
- 19.Lane AA, Odejide O, Kopp N, et al. Low frequency clonal mutations recoverable by deep sequencing in patients with aplastic anemia. Leukemia 2013;27(4):968–971. [DOI] [PMC free article] [PubMed] [Google Scholar]
- 20.Kulasekararaj AG, Jiang J, Smith AE, et al. Somatic mutations identify a subgroup of aplastic anemia patients who progress to myelodysplastic syndrome. Blood 2014;124(17):2698–2704. [DOI] [PMC free article] [PubMed] [Google Scholar]
- 21.Xie M, Lu C, Wang J, et al. Age-related mutations associated with clonal hematopoietic expansion and malignancies. Nat Med 2014;20(12):1472–1478. [DOI] [PMC free article] [PubMed] [Google Scholar]