

Abstract
Cellular senescence is a tumor suppressor mechanism where cells enter a permanent growth arrest following cellular stress. Oncogene-induced senescence (OIS) is induced in non-malignant cells following the expression of an oncogene or inactivation of a tumor suppressor. Previously, we have shown that protein kinase C iota (PKCι) depletion induces cellular senescence in glioblastoma cells in the absence of a detectable DNA damage response. Here we demonstrate that senescent glioblastoma cells exhibit an aberrant centrosome morphology. This was observed in basal levels of senescence, in p21-induced senescence, and in PKCι depletion-induced senescence. In addition, senescent glioblastoma cells are polyploid, Ki-67 negative and arrest at the G1/S checkpoint, as determined by expression of cell cycle regulatory proteins. These markers are all consistent with cells that have undergone mitotic slippage. Failure of the spindle assembly checkpoint to function properly can lead to mitotic slippage, resulting in the premature exit of mitotic cells into the G1 phase of the cell cycle. Although in G1, these cells have the replicated DNA and centrosomal phenotype of a cell that has entered mitosis and failed to divide. Overall, we demonstrate that PKCι depletion initiates mitotic slippage-induced senescence in glioblastoma cells. To our knowledge, this is the first evidence of markers of mitotic slippage directly in senescent cells by co-staining for senescence-associated β-galactosidase and immunofluorescence markers in the same cell population. We suggest that markers of mitotic slippage be assessed in future studies of senescence to determine the extent of mitotic slippage in the induction of cellular senescence.
Keywords: glioblastoma, mitotic slippage, PKCι, Protein kinase C iota, senescence
Abbreviations
- PDK1
3-phosphoinositide dependent protein kinase-1
- APC/C
anaphase promoting complex/cyclosome
- CISH
chromogenic in situ hybridization
- GBM
glioblastoma multiforme
- OIS
oncogene-induced senescence
- PI3K
phosphoinositide 3-kinase
- PKCι
protein kinase C iota
- SAβGal
senescence-associated β-galactosidase
- SAC
spindle assembly checkpoint
- SASP
senescence-associated secretory phenotype.
Introduction
Cellular senescence is induced as a response to sustained cellular stress. The major consequence of cellular senescence is the permanent cessation of cell proliferation. Replicative senescence of cultured primary human fibroblasts was first described in 1961 by Hayflick and Moorhead.1 The observation of replicative senescence was the first demonstration that normal fibroblasts had a limited replicative potential in culture. These senescent cells developed an enlarged, flattened morphology and abnormally large interphase nuclei. Nearly three decades later the mechanism driving replicative senescence was experimentally shown to be due to the gradual shortening of telomere ends during cell division.2 The ability of a cell to override the attrition of telomeres and continue to divide is an essential hallmark of cancer.3 Replicative senescence is a fundamental tumor suppressor mechanism that limits the immortalization of cancer cells.
Oncogene-induced senescence (OIS) is a form of premature senescence that is driven by the expression of an oncogene in an otherwise normal cell. Serrano et al. first described this form of cellular senescence as the mechanism behind the inability of oncogenic Ras expression to transform normal human diploid fibroblasts.4 Senescent cells are present in premalignant tissue but lost in malignant tumors in mouse models of lung cancer and melanoma.5-7 Additionally, OIS has been observed in association with oncogenic events in human biopsies of premalignant dermal neurofibroma and melanocytic nevi.8,9 Both replicative senescence and OIS are potent tumor suppressor mechanisms that must be overcome in order for malignant transformation to occur.
An exciting area of senescence research involves the induction of senescence in cancer cells that have previously bypassed senescence and reached malignancy. This has been shown in mice where the p53 tumor suppressor was re-activated in established sarcomas and tumor regression was observed following the induction of senescence in the absence of apoptosis.10,11 Our laboratory has previously shown that knockdown of protein kinase C iota (PKCι) in human breast cancer and glioblastoma multiforme cell lines induces cellular senescence.12 Treatment with chemotherapeutics or irradiation also induces cellular senescence in a variety of human cancer cell lines.13-15 Furthermore, the induction of premature senescence has been observed in human malignant tissue in the clinic following treatment with chemotherapeutics.16,17 The induction of cellular senescence as a therapeutic outcome following the treatment of malignant tissue is an area of great interest.
Sustained cellular stress and an inability to progress through the cell cycle is a major driver of cellular senescence. The spindle assembly checkpoint (SAC) is responsible for ensuring the proper attachment of microtubules to the kinetochores of all chromosomes.18 When the SAC is not satisfied it inhibits the activity of the anaphase promoting complex/cyclosome (APC/C) E3 ubiquitin ligase and interrupts the progression to anaphase. An inability to progress through the SAC does not result in a permanent arrest in metaphase and does not invariably trigger apoptosis. Following an extended period of arrest by the SAC, a slow degradation of cyclin B occurs and if its degradation precedes pro-apoptotic signal accumulation, the cell prematurely exits from mitosis. 19 This degradation of cyclin B is due to the residual activity of the APC/C and results in mitotic slippage.20 Cells that undergo mitotic slippage exit into interphase and result in a 4N G1 cell with twice the appropriate number of centrosomes.21,22 Cells that have undergone mitotic slippage and re-entered G1 with the features of a cell entering mitosis will invoke considerable cellular stress.
Glioblastoma multiforme (GBM) is the most common and most aggressive adult primary malignant brain tumor. The invasive nature and frequent relapse of GBM contribute to its poor prognosis. The current therapy of surgery followed by radiotherapy and temozolomide treatment results in an average survival of only 12-14 months.23,24 There is therefore a need for the development of novel therapeutic strategies. An integrative analysis of the core pathways of GBM, performed by The Cancer Genome Atlas Research Network, has provided an important overview of the genetic alterations in GBM.25 The phosphoinositide 3-kinase (PI3K) pathway is frequently activated in cancer. In GBM, 36% of samples had a mutation in or homozygous deletion of PTEN and 86% of samples had at least one genetic alteration in the PI3K pathway.25 Activation of the PI3K pathway results in 3-phosphoinositide dependent protein kinase-1 (PDK1) mediated phosphorylation and activation of the AGC kinases. The atypical protein kinase C family members PKCι and PKCζ are one subgroup of kinases activated by PDK1.26,27 PKCι was the first member of the PKC family to be classified as an oncogene.28 Furthering its role in cancer, elevated levels of PKCι have been detected in various tumor types and in multiple tumor types high PKCι levels predict poor survival.29
PKCι has important roles in the malignant phenotype of GBM. We have previously demonstrated that in GBM cells PKCι: represses cisplatin-induced apoptosis; is necessary for invasion and motility; co-ordinates leading edge lamellipod formation; and is necessary for the successful progression through mitosis.30-32 We then expanded on the observed importance of PKCι in mitosis and demonstrated that knockdown of PKCι in GBM cell lines induces senescence.12 The cellular senescence induced by PKCι depletion was independent of a DNA damage response and was dependent on p21. This current study shows that senescent GBM cells have aberrant centrosomes, an increase in ploidy, and arrest in the G1 phase of the cell cycle. These are all characteristics of a cell having undergone mitotic slippage. The induction of senescence following the depletion of PKCι also displays these markers. Overall, this demonstrates that mitotic-slippage induced senescence occurs in glioblastoma cells following a cellular perturbation that does not invoke a DNA damage response.
Results
Senescent glioblastoma cells have aberrant centrosomes
A basal level of senescence is observed in untreated cell lines in culture. As we have previously reported, senescence-associated β-galactosidase (SAβGal) staining indicated that the U87MG, A172 and DBTRG glioblastoma cell lines have basal senescence levels of approximately 2%, 3%, and 11% respectively.12 In the current study, aberrant centrosomes were identified as either supernumerary centrosomes (more than 2 centrosomes) or as having 2 clearly separated centrosomes in a cell with an uncondensed interphase nuclear morphology. For analysis we defined cells either as senescent or normal (referring to a non-senescent phenotype, as opposed to non-malignant). Normal GBM cells were defined as having a single average size nucleus, normal cytoplasmic size, and being negative for SAβGal stain. Senescent cells were defined as having a single enlarged nucleus, enlarged cytoplasm, and staining positive for SAβGal. Senescent U87MG cells, at a basal level, had an aberrant centrosome phenotype as detected by immunofluorescence staining of γ-tubulin (Fig. 1A). Almost all normal U87MG cells in culture had 2 attached centrosomes, whereas the majority of senescent U87MG cells had more than 2 centrosomes (Fig. 1B). The U87MG, A172 and DBTRG glioblastoma cell lines all showed a marked increase in centrosome aberrations in senescent cells when compared to normal cells (Fig. 1C).
Figure 1.
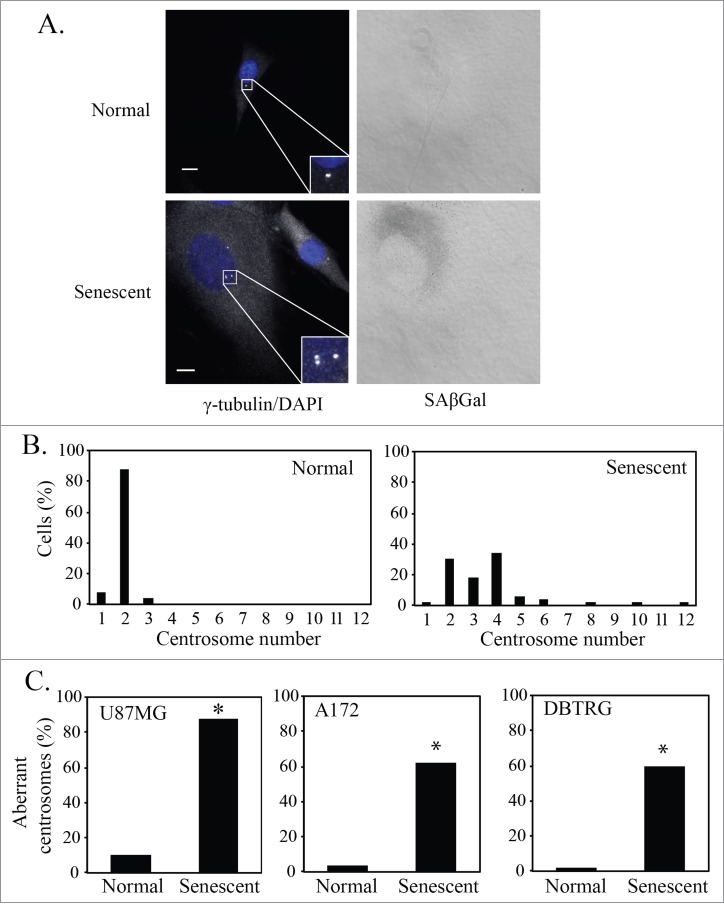
Senescent glioblastoma cells have aberrant centrosomes. (A) Representative images of untreated normal and senescent cells. Centrosomes stained by immunofluorescent staining for γ-tubulin (1:800, white) and nuclei stained with DAPI (blue), inset is a magnification of the centrosomes. To the right is the brightfield grayscale image of the cells showing the presence or absence of SAβGal stain. Normal (non-senescent) cells are characterized by a single nucleus of average size, a typical cytoplasmic size and are negative for SAβGal stain. Senescent cells are characterized by a single enlarged nucleus, increased cytoplasmic size and are positive for SAβGal stain. Scale bar = 10 μm. (B) A histogram showing the centrosome number in normal and senescent U87MG cells. (C) Percentage of normal and senescent cells with aberrant centrosomes in 3 glioblastoma cell lines (U87MG, A172, DBTRG). Centrosomes were classified as aberrant if either supernumerary or separated in an interphase cell. For B and C, a minimum of 50 normal and senescent cells were counted following immunofluorescence staining for γ-tubulin. Data for senescent cells are pooled data from the analysis of 3 separate slides. Statistical significance was determined using Pearson's chi-squared test. * p < 0.05.
p21-induced senescent glioblastoma cells have aberrant centrosomes
Previously we have shown that induction of senescence by PKCι depletion in glioblastoma cells requires p21.12 In addition, p21 has been shown to be inactivated by atypical PKCs via direct phosphorylation.33 To determine if increased p21 was sufficient to induce senescence, we constructed a lentiviral vector containing cDNA to p21 and used this to transduce U87MG and A172 cells. Overexpression of p21 in these cells resulted in 60-80% SAβGal positive cells, whereas mock transduced cells were approximately 2% SAβGal positive (Fig. S1). As in basal senescence, these cells showed increased cytoplasm and an enlarged nucleus. Consistent with the senescence phenotype, nuclei also showed increased numbers and size of PML bodies (Fig. S2A).34 As an additional marker of senescence, we took advantage of the high levels of senescence promoted by p21 transduction to determine whether senescent glioblastoma cells also express a senescence-associated secretory phenotype (SASP). Analysis of conditioned media using cytokine arrays showed that senescent U87MG cells secreted increased amounts of IL6, IL7, IL8 and CXCL1/2/3, all factors that have been previously identified as components of SASP35 (Fig. S2B). IL6 was the most prominent SASP factor. Its secretion was validated by ELISA assays, and a time course showed that the increase in its secretion closely paralleled the increase in SAβGal staining (Fig. S2C). U87MG and A172 cells that are senescent after p21 overexpression also have centrosome aberrations (Fig. 2A). When compared to cells that have a normal cell phenotype, senescent U87MG and A172 cells in the p21 overexpressing population have a greater frequency of centrosome aberrations (Fig. 2B). This suggests that basal levels of senescence and p21-induced senescence of glioblastoma cells involve a process that results in aberrant centrosome formation.
Figure 2.
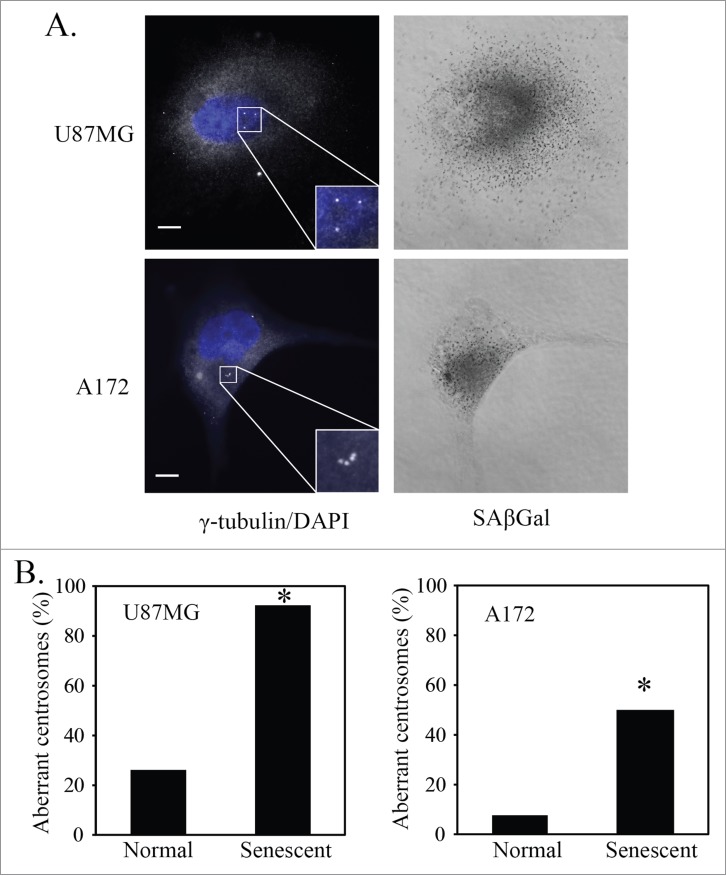
p21-induced senescent glioblastoma cells have aberrant centrosomes. (A) Representative images of p21-induced senescent U87MG and A172 glioblastoma cells after overexpression of p21. Cells underwent immunofluorescence staining for γ-tubulin (white). Nuclei were stained with DAPI (blue) and a brightfield grayscale image of SAβGal stain is included to the right. Cells were transduced with a p21 lentivirus overnight, washed and fixed for staining 4 days later (5 days after initial transduction). Inset is a magnification of the centrosomes. Scale bar = 10 μm. (B) Quantification of normal and senescent (same criteria used in Figure 1) glioblastoma cells (U87MG, A172) with aberrant centrosomes after overexpression of p21. Statistical significance was determined using Pearson's chi-square test. * p < 0.05.
Senescent U87MG cells are polyploid
Following mitotic slippage, there is an increase of the DNA content within the cell. Chromogenic in situ hybridization (CISH) labeling of the centromere of chromosome 7 demonstrated that senescent U87MG cells, based on an enlarged nucleus and cytoplasm, are polyploid when compared to cells with a normal cell morphology (Fig. 3A). U87MG cells with a normal cell morphology predominantly had 3 CISH signals of the chromosome 7 centromere, whereas the majority of senescent cells had 6 signals (Fig. 3B). This shows that the enlarged nuclear morphology associated with senescence in glioblastoma cells reflects an increase in cell ploidy. This is consistent with previous results by others, showing an increase in cell ploidy following different stressors that are known to induce cellular senescence.36-38
Figure 3.

Senescent U87MG cells are polyploid. (A) Chromogenic in situ hybridization (CISH) using a probe for the centromere of chromosome 7. Representative images of normal and senescent (by morphology) U87MG cells. Scale bar = 10 μm. (B) Quantification of CISH staining in U87MG cells (n = 30). The distribution of CISH copy number between normal and senescent cells was significantly different as determined using Pearson's chi-squared test.
Cyclin expression in senescent glioblastoma cells
Cells that have failed to progress through mitosis and have slipped into the G1 phase of the cell cycle should arrest at the G1/S checkpoint. U87MG cells express high levels of Cyclin B1 in the G2 phase of the cell cycle, peaking during metaphase (Fig. 4A, top right). Senescent U87MG cells in culture, based on a large flattened morphology, do not express discernible levels of Cyclin B1, suggesting that they are not arrested at the G2/M checkpoint (Fig. 4A, bottom right). Senescent U87MG cells, based on an enlarged morphology and positive staining for SAβGal, are positive for Cyclin E and negative for the proliferation marker Ki-67 (Fig. 4B, quantitation shown in Fig. 5C below). This demonstrates that senescent U87MG cells are arrested at the G1/S checkpoint, where Cyclin E expression levels are high and Cyclin B1 expression levels are low.
Figure 4.
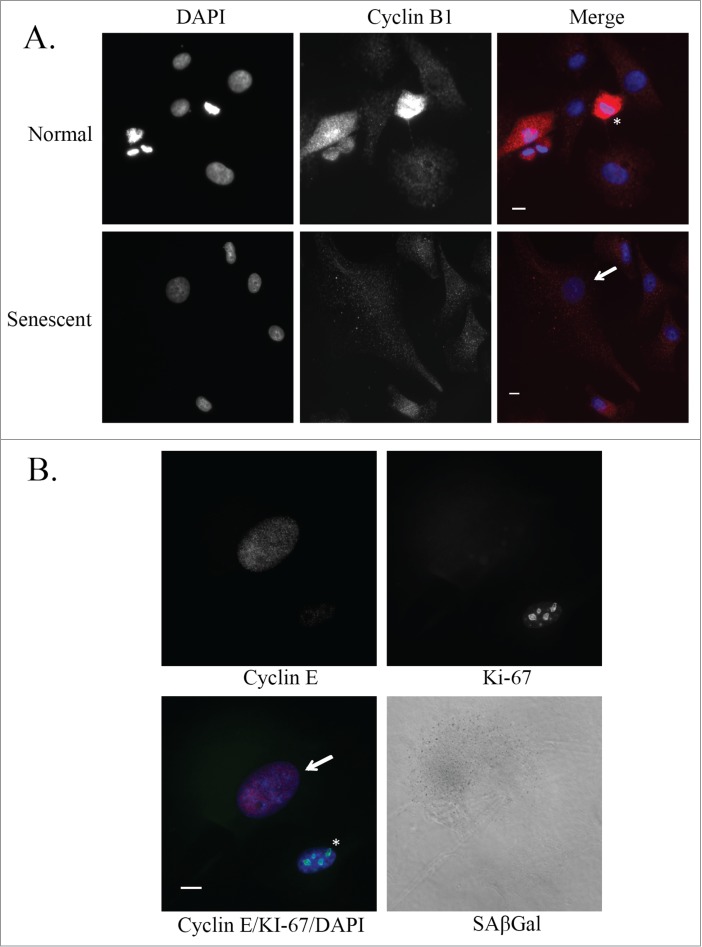
Cyclin expression in senescent glioblastoma cells. (A) Representative images of untreated normal and senescent (by morphology) U87MG cells. Immunofluorescence staining of Cyclin B1 (red) and nuclei are stained with DAPI (blue). Senescent cell of interest is shown using an arrow and the normal cell undergoing metaphase is shown using an asterisk. Scale bar = 10 μm. (B) Immunofluorescence staining of Cyclin E (red) and Ki-67 (green) in an untreated U87MG normal (asterisk) and senescent (arrow) cell. Nuclei are stained with DAPI (blue) and a brightfield grayscale image of SAβGal is on the bottom right. Scale bar = 10 μm.
Figure 5.

PKCι depletion-induced senescence shows markers of mitotic slippage. U87MG cells were either mock transfected, transfected with control siRNA (control RNA), or siRNA targeting PKCι (iota RNA A and iota RNA E). After 48hr of siRNA, cells were washed and grown for another 3 days in regular media, followed by fixation and staining. (A) Quantification of the percent of SAβGal positive staining of U87MG cells in the 2 experiments used for counting. A minimum of 100 cells over 3 fields of view were counted in each of the 2 separate experiments. (B) Quantification of senescent (same criteria as Figure 1) U87MG cells showing aberrant or normal centrosome morphology. Minimum of 30 cells counted for each condition. (C) Quantification of senescent U87MG cells that are positive or negative for Cyclin E. Minimum of 30 cells counted for each condition. (D) Quantification of senescent U87MG cells that are positive or negative for Ki-67. Minimum of 40 cells counted for each condition. (E) CISH staining using a probe for the centromere of chromosome 7 of U87MG cells 5 days after siRNA targeting PKCι. Minimum of 100 cells counted for each condition in 3 separate experiments. Statistical significance was determined using a 2-tailed t-test. Error bars indicate the standard error of the mean. (* p < 0.05)
PKCι depletion-induced senescence shows markers of mitotic slippage
To determine if senescence caused by PKCι depletion also showed features of mitotic slippage, PKCι was depleted in U87MG cells with 2 separate duplexes targeting PKCι, as described previously.12 PKCι-depleted U87MG cells were stained for SAβGal and then for markers of mitotic slippage, as above. The mechanism of senescence induction in basal levels of senescence in control cells (typically 2-3% in untreated U87MG cells) could therefore be compared to senescence induced by PKCι depletion (between 14% and 19% of U87MG cells in this experiment, Fig. 5A). When analyzing only the senescent cells (by the criteria describe above, including SAβGal positive staining), aberrant centrosomes are observed in senescent cells at a similar high frequency in PKCι depleted and control cells (Fig. 5B). This demonstrates that the basal level of senescence in culture and PKCι depletion-induced senescence both involve centrosome aberrations. The frequency was also comparable to centrosome aberrations in U87MG cells following p21-induced senescence, shown in Fig. 2. Both control and PKCι depleted senescent cells are also positive for Cyclin E (Fig. 5C) and negative for Ki-67 (Fig. 5D) at a similar frequency. Analyzing a further 3 experiments following siRNA knockdown of PKCι in U87MG cells, an increase in ploidy was observed by CISH staining of chromosome 7 centromeres (Fig. 5E). After PKCι depletion, the frequency of cells with an increase in ploidy (Fig. 5E) was similar to the percentage of cells that were SAβGal positive in Figure 5A. Similar properties between the basal levels of senescence in the control RNA cells and the PKCι depleted senescent cells demonstrate that senescence is occurring by a similar mechanism. Representative immunofluorescence images of senescent U87MG cells following PKCι depletion by siRNA (iota RNA A) show markers of mitotic slippage (Fig. 6). A senescent U87MG cell, by morphology and SAβGal positivity, with supernumerary centrosomes (inset upper right) is shown near U87MG cells with a normal phenotype and normal centrosome number (inset lower left) (Fig. 6A). After PKCι depletion, senescent U87MG cells are also Ki-67 negative, whereas U87MG cells with a normal cell phenotype are often Ki-67 positive (Fig. 6B). Moreover, senescent U87MG cells are also positive for Cyclin E and negative for Cyclin B1, demonstrating a cell cycle arrest in the G1 phase of the cell cycle (Fig. 7A, PKCι have aberrant centrosomes, are Ki-67 negative, are polyploid and arrest at the G1/S checkpoint. Combined, these results demonstrate that PKCι depletion-induced senescent U87MG cells have undergone mitotic slippage.
Figure 6.

Markers of mitotic slippage in senescent U87MG cells after PKCι depletion. Representative immunofluorescence images of senescent U87MG cells 5 days after siRNA targeting PKCι (iota RNA A). (A) Top left, phase contrast; top right, SAβGal staining (grayscale); bottom left, DAPI; bottom right, γ-tubulin staining centrosomes. Inset is a magnification of the centrosomes. Scale bar = 10 μm. (B) Top left, phase contrast; top right, SAβGal staining (grayscale); bottom left, DAPI; bottom right, Ki-67. Scale bar = 10 μm.
Figure 7.

Markers of mitotic slippage in senescent U87MG cells after PKCι depletion. Representative immunofluorescence images of senescent U87MG cells 5 days after siRNA targeting PKCι (iota RNA A). (A) Top left, phase contrast; top right, SAβGal staining (grayscale); bottom left, DAPI; bottom right, Cyclin E. Scale bar = 10 μm. (B) Top left, phase contrast; top right, SAβGal staining (grayscale); bottom left, DAPI; bottom right, Cyclin B1. Scale bar = 10 μm.
Discussion
The suggestion that centrosome abnormalities play an important role in tumorigenesis was first described in 1915 by Theodore Boveri.39 During the more recent reappraisal of Boveri's work, centrosome aberrations have been linked to aneuploidy, genomic instability, and tumorigenesis.40 Previously, there has been some evidence linking centrosome aberrations to senescence. Two groups demonstrated that depleting centrosomal proteins induces premature senescence in non-malignant cells. The knockdown of the centrosomal protein TACC3 in immortalized breast epithelial cells or PCM-1 in human fetal lung fibroblasts induced senescence with an increase in p21.41,42 The presence of centrosome aberrations has been observed in the context of senescence when mouse embryonic fibroblasts (MEFs) reach high passage numbers. As MEF cells undergo replicative senescence, there is an increase in cells with supernumerary centrosomes.43 More recent evidence has demonstrated that supernumerary centrosomes, predominantly in a polyploid population, were observed in replicative senescence and premature senescence following treatment with hydrogen peroxide in TIG-1 normal human fibroblasts.44 However, much of the data linking centrosome aberrations to senescence has been correlative, comparing centrosomes and senescent cells in 2 different populations under similar conditions. In the current study, we are among the first to show immunofluorescent staining of centrosomes in cells that have been co-stained for SAβGal. This method has allowed us to characterize centrosome aberrations directly in senescent glioblastoma cells, which notably have previously bypassed replicative senescence.
We observed that the majority of senescent glioblastoma cells, induced under multiple conditions, have aberrant centrosomes whereas normal (non-senescent) glioblastoma cells have a typical centrosome phenotype. Senescent cells found at a basal level in 3 different glioblastoma cell lines all had a marked increase in the frequency of centrosome aberrations. Centrosome aberrations were not limited to basal levels of senescence as a similar increase in centrosome aberrations was observed in glioblastoma cells that have undergone senescence induced by p21 overexpression or PKCι depletion.
A relationship between polyploidy and senescence was first described by Saksela and Moorhead in 1963.45 By analyzing the WI-26 and WI-38 cell strains derived from fetal lung tissue they were able to show that at passages 50 ± 10, where these cell strains enter replicative senescence, there is a 3-4 fold increase in the percent of tetraploid cells. Wagner et al. have shown that HUVEC endothelial cells that have undergone replicative senescence arrest in G1 with a 4N DNA content.46 Additionally, an association between an increase in supernumerary centrosomes in polyploid late passage human diploid fibroblasts has been described. 44,47 Intriguingly, Panopoulos et al. observed that inhibiting cell cleavage in primary fibroblasts resulted in tetraploid G1 cells that underwent DNA-damage independent and p16 dependent senescence. 48 We assessed the ploidy of normal and senescent U87MG cells using CISH to label the centromere of chromosome 7. Consistent with cells having undergone DNA replication, U87MG cells with an enlarged senescent morphology had twice the chromosome 7 content as U87MG cells with a normal cellular morphology. Furthermore, senescent U87MG cells arrest at the G1/S checkpoint, as they are negative for Cyclin B1 and positive for Cyclin E. Together with the increase in aberrant centrosomes, these data show that senescent glioblastoma cells have undergone mitotic slippage. Failure of the spindle assembly checkpoint (SAC) to function properly can lead to mitotic slippage. High CDK1 activity is required to sustain the SAC and it is degradation of p21 in prometaphase that permits this high CDK1 activity.49 As p21 has been shown to be directly phosphorylated and inactivated by atypical PKC,33 it is possible that PKCι depletion results in higher activity of p21 during prometaphase and, consequently, loss of SAC function. Thus PKCι depletion, via its effects on p21 activity, would prevent the SAC from functioning properly, thereby promoting mitotic slippage and senescence. Consistent with this, we have previously shown that PKCι depletion in glioblastoma cells does not affect their entry into mitosis, but does significantly impair completion of mitosis.32 The basal senescence observed may simply reflect stochastic fluctuations of PKCι pathway activity below a threshold required for normal mitosis.
Mitotic slippage is characterized by an inability to successfully progress through mitosis, followed by mitotic exit into the G1 phase of the cell cycle. The result is a G1 cell that has the 4N DNA content and the centrosome morphology of a cell that has already progressed through the S and G2 phases of the cell cycle and attempted to divide. Previous publications have associated the induction of a G1 cell cycle arrest and senescence as a cell fate following mitotic slippage. However, to the best of our knowledge, mitotic slippage-induced senescence has not yet been directly shown experimentally. Mitotic slippage has, in one study, been described as an outcome of polyploidy in prematurely senescent cells following hydrogen peroxide treatment, rather than being a cause of polyploidy and senescence.50 Interestingly, the work of 2 groups has described that a cell cycle slippage from G2 directly to G1, without entering mitosis, results in senescence following DNA damage.51,52 This form of G2 to G1 slippage would not involve the SAC during prometaphase and the mechanistic details of this process remain to be fully elucidated in order to determine any potential overlap with mitotic slippage. Importantly, the induction of senescence following the depletion of spindle assembly checkpoint signaling components suggests that senescence is a possible cell fate following mitotic slippage.53 The depletion of 2 such proteins has been shown to induce senescence. Depletion of Mad2 using siRNA induces senescence in vitro, and a reduction of BubR1 in mice causes an early onset of senescence in vivo.54,55 50,51 Notably, haploinsufficiency of either Mad2 or BubR1 results in a defective SAC.56,57 Overall, these observations help to further strengthen the link between mitotic slippage and cellular senescence. The specific nature of the signals linking mitotic slippage to senescence are not known at this time, but are likely to involve the activation of some cell cycle checkpoint in the polyploid G1/S cell. How transient growth arrest signals are converted into the permanent growth arrest phenotype of senescence is still poorly understood.
If mitotic slippage-induced senescence is part of a more general mechanism of cellular senescence, then there are some important implications. One potential issue involves the cell cycle analysis of senescent cells. If cell cycle analysis is performed solely based on flow cytometric analysis using propidium iodide or other DNA stains, there may be an over-representation of the G2 phase of the cell cycle. Cells that have undergone mitotic slippage, resulting in a 4N DNA content, and are arrested at the G1/S checkpoint will appear as though they are arrested at the G2/M checkpoint. This is important when making conclusions on the phase of the cell cycle arrest in cellular senescence. Moreover, the implication that mitotic slippage plays a role in a more general mechanism of cellular senescence is intriguing. Many inducers of cellular senescence have been described and various signaling pathways are involved in the induction of senescence, without an overarching mechanism. This variety includes senescence induction that occurs in the presence or, more recently, absence of a DNA damage response.58,59 A large physical disruption in the cell, such as an inability to progress through the spindle assembly checkpoint followed by an exit back into interphase, could be a major source of the stress at the root of cellular senescence.
A common method of inducing premature senescence is the expression of oncogenic Ras in non-malignant cells, first described by Serrano et al. and a fundamental initial description of OIS. 4 Interestingly, expression of oncogenic Ras in normal rat thyroid cells has been shown to promote the bypass of the SAC, resulting in G1 cells with a 4N DNA content. 60 This suggests that mitotic slippage may play a role in OIS induced by oncogenic Ras expression. Furthermore, the work of Ohshima mentioned above depicts cells with 2 markers of mitotic slippage (polyploidy and aberrant centrosomes) in populations of cells that have undergone replicative senescence and premature senescence following exposure to hydrogen peroxide, another common method of inducing cellular senescence.44 Importantly, these reports combined with those mentioned above suggest that mitotic slippage could also occur following some of the common forms of senescence induction: replicative senescence following telomere attrition, oncogene-induced senescence (activated Ras), DNA damage-induced senescence (radiation, H2O2, UV, chemotherapeutics), and senescence following centrosomal protein depletion (BubR1, TACC3, PCM-1) or overexpression of cell cycle inhibitors (p16, p21). Therefore, we hypothesize that mitotic slippage may be involved in a more general mechanism of senescence induction.
In summary, we present data suggesting that mitotic slippage can induce senescence in glioblastoma cells. This appears to be an alternate mechanism for senescence that does not involve the DNA damage response. We suggest that markers of mitotic slippage, such as aberrant centrosomes, polyploidy and a G1/S arrest, be included in future studies of senescence in order to determine how frequently this alternate senescence mechanism is used.
Materials and Methods
Antibodies
Ki-67 rabbit polyclonal antibody (ab15580) used for immunofluorescence was from Abcam (http://www.abcam.com/ki67-antibody-ab15580.html). Cyclin B1 rabbit polyclonal antibody (#4138) was from Cell Signaling Technology (http://www.cellsignal.com/products/primary-antibodies/4138). Cyclin E mouse monoclonal antibody (sc-247) was from Santa Cruz Biotechnology (http://www.scbt.com/datasheet-247-cyclin-e-he12-antibody.html). γ-tubulin mouse monoclonal antibody (T6557) was from Sigma-Aldrich (http://www.sigmaaldrich.com/catalog/product/sigma/t6557?lang=enandregion=CA). PML mouse monoclonal antibody was from Santa Cruz Biotechnology (http://www.scbt.com/datasheet-966-pml-pg-m3-antibody.html). Secondary antibodies used for Western blots were purchased from Jackson Immunoresearch Laboratories. Secondary antibodies used for immunofluorescence were conjugated with Alexa Fluor goat anti-rabbit 555, goat anti-mouse 555 and chicken anti-rabbit 488 from Life Technologies - Invitrogen.
Cell culture
A172 and DBTRG cell lines were purchased from ATCC. The human U87MG glioblastoma cell line was obtained from Dr. W. Cavenee (Ludwig Institute for Cancer Research). All cell lines were passaged in Dulbecco's modified Eagle's medium (DMEM) from Thermo Scientific Hyclone with 10% fetal bovine serum and 100 units/ml penicillin, 100 μg/ml streptomycin from Life Technologies - Invitrogen. Cell lines were routinely checked for mycoplasma contamination.
Lentiviral transduction
The p21 lentiviral vector was created using p21 cDNA from the A172 cell line with the 2 primers: 5′-GGATCCAGGCACCGAGGCACTCAGAG-3′ and 5′-GTCGACGGACTGCAGGCTTCCTGTGG-3′. The cDNA was then cloned into the pLenti vector and sequenced. Cells were transduced with 100 μl lentiviral vector, 900 μl media and 10 mg/ml polybrene.
Immunofluorescent staining
Cells were plated on gelatin-coated coverslips and following the SAβGal staining procedure (except for Cyclin B1 staining), cells were fixed with ice-cold 95% methanol for 10 minutes. Note: the SAβGal procedure involves a 10 minute fixation using 4% paraformaldehyde and the Cyclin B1 staining was done after a 30 min 4% paraformaldehyde fixation. Cells were blocked in 5% serum in PBS (goat or chicken) then incubated with the primary antibody for 1 hour in 5% serum at the following concentrations: γ-tubulin 1:800, Cyclin B1 1:50, Cyclin E 1:50, and Ki-67 1:1500. The relevant secondary antibody was incubated in 5% serum at 2 μg/ml for 1 hour. Slides were analyzed using a Zeiss Axioskop 2 microscope from Carl Zeiss Inc.
Chromogenic in situ hybridization
Chromogenic in situ hybridization (CISH) staining was used to detect the copy number of the centromere of chromosome 7 as a method to compare cell ploidy. The SPOT-light chromosome 7 centromeric probe and detection kit were from Life Technologies - Invitrogen and were used according to the manufacturer's protocols.
Western blot analysis
Protein lysates were run on a 4–12% gradient bis-tris polyacrylamide gel Life Technologies - Invitrogen and transferred to a PVDF nylon membrane GE Healthcare Life Sciences. Secondary HRP conjugated antibodies were detected with SuperSignal West Pico Chemiluminescent Substrate reagents Thermo Scientific Pierce. Western blots were visualized and quantified using the Alpha Innotech Fluorchem FC2 system and Alphaview software from ProteinSimple.
RNA interference
All duplexes were purchased from Dharmacon. RNA duplexes with the following sense strand sequences were used to target PKCι: duplex A, 5′-GTGCATCAACTGCAAACTC-3′; duplex E, 5′-GCCTGGATACAATTAACCATT-3′. siGENOME Non-Targeting siRNA #3 from Dharmacon was used as a non-targeting duplex control. RNA transfections were done as described previously but with a final concentration of 10nM. 31 For senescence analysis cells were assayed 5 days after transfection with siRNA being washed off after 48 h. Initial plating of cells was 15,000 to 20,000 in a 6-well dish on gelatin-coated cover slips.
SAβGal Staining
Cells were plated in a 6-well dish on gelatin-coated coverslips. 24 hours after plating, transfection of RNA duplexes was performed as described above. Media was refreshed every 48 hours and 5 days after transfection, cells were fixed in 4% paraformaldehyde for 10 minutes and assayed for SAβGal activity as described by Debacq-Chainiaux et al.61 Slides were analyzed using a Zeiss Axioskop 2 microscope or continued on to immunofluorescence staining as described above. Total and SAβGal-positive cells were counted in a minimum of 3 separate fields and with a minimum of 100 cells overall for each condition.
Cytokine arrays
Normal cells or senescent cells were grown in serum-free media for 24 h. Conditioned media was analyzed on a RayBiotech Human Cytokine Antibody Array 5 according to the manufacturer's instructions (http://www.raybiotech.com/c-series-human-cytokine-array-5-2.html ). Expression of IL6 was confirmed with a RayBiotech Human IL-6 ELISA kit ( http://www.raybiotech.com/human-il-6-elisa-kit-for-serum-plasma-cell-culture-supernatant-and-urine.html ).
Statistical analysis
Statistical significance was determined using either Pearson's Chi-squared or 2 tailed t-tests, as indicated in Figure legends. Values were considered significant when p < 0.05.
Disclosure of Potential Conflicts of Interest
No potential conflicts of interest were disclosed.
Supplemental Material
Supplemental data for this article can be accessed on the publisher's website.
Funding
This work was supported by a grant from the Canadian Institutes of Health Research. IAJL is also supported by the J. Adrien and Eileen Leger Chair in Cancer Research at the Ottawa Hospital Research Institute.
References
- 1.Hayflick L, Moorhead PS. The serial cultivation of human diploid cell strains. Exp Cell Res 1961; 25:585-621; PMID:13905658; http://dx.doi.org/ 10.1016/0014-4827(61)90192-6 [DOI] [PubMed] [Google Scholar]
- 2.Harley CB, Futcher AB, Greider CW. Telomeres shorten during ageing of human fibroblasts. Nature 1990; 345:458-60; PMID:2342578; http://dx.doi.org/ 10.1038/345458a0 [DOI] [PubMed] [Google Scholar]
- 3.Hanahan D, Weinberg RA. Hallmarks of cancer: the next generation. Cell 2011; 144:646-74; PMID:21376230; http://dx.doi.org/ 10.1016/j.cell.2011.02.013 [DOI] [PubMed] [Google Scholar]
- 4.Serrano M, Lin AW, McCurrach ME, Beach D, Lowe SW. Oncogenic ras provokes premature cell senescence associated with accumulation of p53 and p16INK4a. Cell 1997; 88:593-02; PMID:9054499; http://dx.doi.org/ 10.1016/S0092-8674(00)81902-9 [DOI] [PubMed] [Google Scholar]
- 5.Dankort D, Filenova E, Collado M, Serrano M, Jones K, McMahon M. A new mouse model to explore the initiation, progression, and therapy of BRAFV600E-induced lung tumors. Genes Dev 2007; 21:379-84; PMID:17299132; http://dx.doi.org/ 10.1101/gad.1516407 [DOI] [PMC free article] [PubMed] [Google Scholar]
- 6.Collado M, Gil J, Efeyan A, Guerra C, Schuhmacher AJ, Barradas M, Benguria A, Zaballos A, Flores JM, Barbacid M. et al. Tumour biology: senescence in premalignant tumours. Nature 2005; 436:642; PMID:16079833; http://dx.doi.org/ 10.1038/436642a [DOI] [PubMed] [Google Scholar]
- 7.Dhomen N, Reis-Filho JS, da Rocha DS, Hayward R, Savage K, Delmas V, Larue L, Pritchard C, Marais R. Oncogenic Braf induces melanocyte senescence and melanoma in mice. Cancer Cell 2009; 15:294-303; PMID:19345328; http://dx.doi.org/ 10.1016/j.ccr.2009.02.022 [DOI] [PubMed] [Google Scholar]
- 8.Courtois-Cox S, Genther Williams SM, Reczek EE, Johnson BW, McGillicuddy LT, Johannessen CM, Hollstein PE, MacCollin M, Cichowski K. A negative feedback signaling network underlies oncogene-induced senescence. Cancer Cell 2006; 10: 459-72; PMID:17157787; http://dx.doi.org/ 10.1016/j.ccr.2006.10.003 [DOI] [PMC free article] [PubMed] [Google Scholar]
- 9.Michaloglou C, Vredeveld LC, Soengas MS, Denoyelle C, Kuilman T, van der Horst CM, Majoor DM, Shay JW, Mooi WJ, Peeper DS. BRAFE600-associated senescence-like cell cycle arrest of human naevi. Nature 2005; 436:720-4; PMID:16079850; http://dx.doi.org/ 10.1038/nature03890 [DOI] [PubMed] [Google Scholar]
- 10.Ventura A, Kirsch DG, McLaughlin ME, Tuveson DA, Grimm J, Lintault L, Newman J, Reczek EE, Weissleder R, Jacks T. Restoration of p53 function leads to tumour regression in vivo. Nature 2007; 445:661-5; PMID:17251932; http://dx.doi.org/ 10.1038/nature05541 [DOI] [PubMed] [Google Scholar]
- 11.Xue W, Zender L, Miething C, Dickins RA, Hernando E, Krizhanovsky V, Cordon-Cardo C, Lowe SW. Senescence and tumour clearance is triggered by p53 restoration in murine liver carcinomas. Nature 2007; 445:656-60; PMID:17251933; http://dx.doi.org/ 10.1038/nature05529 [DOI] [PMC free article] [PubMed] [Google Scholar]
- 12.Paget JA, Restall IJ, Daneshmand M, Mersereau JA, Simard MA, Parolin DA, Lavictoire SJ, Amin MS, Islam S, Lorimer IA. Repression of cancer cell senescence by PKCiota. Oncogene 2012; 31:3584-96; PMID:22120720; http://dx.doi.org/ 10.1038/onc.2011.524 [DOI] [PubMed] [Google Scholar]
- 13.Gewirtz DA, Holt SE, Elmore LW. Accelerated senescence: an emerging role in tumor cell response to chemotherapy and radiation. Biochem Pharmacol 2008; 76:947-57; PMID:18657518; http://dx.doi.org/ 10.1016/j.bcp.2008.06.024 [DOI] [PubMed] [Google Scholar]
- 14.Kovatcheva M, Liu DD, Dickson MA, Klein ME, O'Connor R, Wilder FO, Socci ND, Tap WD, Schwartz GK, Singer S. et al. MDM2 turnover and expression of ATRX determine the choice between quiescence and senescence in response to CDK4 inhibition. Oncotarget. 2015; 6:8226-43; PMID:25803170 [DOI] [PMC free article] [PubMed] [Google Scholar]
- 15.Chao SK, Horwitz SB, McDaid HM. Insights into 4E-BP1 and p53 mediated regulation of accelerated cell senescence. Oncotarget. 2011; 2:89-98; PMID:21399233 [DOI] [PMC free article] [PubMed] [Google Scholar]
- 16.te Poele RH, Okorokov AL, Jardine L, Cummings J, Joel SP. DNA damage is able to induce senescence in tumor cells in vitro and in vivo. Cancer Res 2002; 62:1876-83; PMID:11912168 [PubMed] [Google Scholar]
- 17.Roberson RS, Kussick SJ, Vallieres E, Chen SY, Wu DY. Escape from therapy-induced accelerated cellular senescence in p53-null lung cancer cells and in human lung cancers. Cancer Res 2005; 65:2795-803; PMID:15805280; http://dx.doi.org/ 10.1158/0008-5472.CAN-04-1270 [DOI] [PubMed] [Google Scholar]
- 18.Foley EA, Kapoor TM. Microtubule attachment and spindle assembly checkpoint signalling at the kinetochore. Nat Rev Mol Cell Biol 2013; 14:25-37; PMID:23258294; http://dx.doi.org/ 10.1038/nrm3494 [DOI] [PMC free article] [PubMed] [Google Scholar]
- 19.Brito DA, Rieder CL. Mitotic checkpoint slippage in humans occurs via cyclin B destruction in the presence of an active checkpoint. Curr Biol 2006; 16:1194-200; PMID:16782009; http://dx.doi.org/ 10.1016/j.cub.2006.04.043 [DOI] [PMC free article] [PubMed] [Google Scholar]
- 20.Lee J, Kim JA, Margolis RL, Foteda R. Substrate degradation by the anaphase promoting complex occurs during mitotic slippage. Cell Cycle 2010; 9:1792-801; PMID:20436289; http://dx.doi.org/ 10.4161/cc.9.9.11519 [DOI] [PMC free article] [PubMed] [Google Scholar]
- 21.Rieder CL, Maiato H. Stuck in division or passing through: what happens when cells cannot satisfy the spindle assembly checkpoint. Dev Cell 2004; 7:637-51; PMID:15525526; http://dx.doi.org/ 10.1016/j.devcel.2004.09.002 [DOI] [PubMed] [Google Scholar]
- 22.Schneider L, Essmann F, Kletke A, Rio P, Hanenberg H, Wetzel W, Schulze-Osthoff K, Nurnberg B, Piekorz RP. The transforming acidic coiled coil 3 protein is essential for spindle-dependent chromosome alignment and mitotic survival. J Biol Chem 2007; 282:29273-83; PMID:17675670; http://dx.doi.org/ 10.1074/jbc.M704151200 [DOI] [PubMed] [Google Scholar]
- 23.Kanu OO, Mehta A, Di C, Lin N, Bortoff K, Bigner DD, Yan H, Adamson DC. Glioblastoma multiforme: a review of therapeutic targets. Expert Opin Ther Targets 2009; 13:701-18; PMID:19409033; http://dx.doi.org/ 10.1517/14728220902942348 [DOI] [PubMed] [Google Scholar]
- 24.Stupp R, Mason WP, van den Bent MJ, Weller M, Fisher B, Taphoorn MJ, Belanger K, Brandes AA, Marosi C, Bogdahn U. et al. Radiotherapy plus concomitant and adjuvant temozolomide for glioblastoma. N. Engl. J. Med. 2005; 352:987-96; PMID:15758009; http://dx.doi.org/ 10.1056/NEJMoa043330 [DOI] [PubMed] [Google Scholar]
- 25.Comprehensive genomic characterization defines human glioblastoma genes and core pathways. Nature 2008; 455:1061-8; PMID:18772890; http://dx.doi.org/ 10.1038/nature07385 [DOI] [PMC free article] [PubMed] [Google Scholar]
- 26.Chou MM, Hou W, Johnson J, Graham LK, Lee MH, Chen CS, Newton AC, Schaffhausen BS, Toker A. Regulation of protein kinase C zeta by PI 3-kinase and PDK-1. Curr Biol 1998; 8:1069-77; PMID:9768361; http://dx.doi.org/ 10.1016/S0960-9822(98)70444-0 [DOI] [PubMed] [Google Scholar]
- 27.Le Good JA, Ziegler WH, Parekh DB, Alessi DR, Cohen P, Parker PJ. Protein kinase C isotypes controlled by phosphoinositide 3-kinase through the protein kinase PDK1. Science 1998; 281:2042-5; PMID:9748166; http://dx.doi.org/ 10.1126/science.281.5385.2042 [DOI] [PubMed] [Google Scholar]
- 28.Regala RP, Weems C, Jamieson L, Khoor A, Edell ES, Lohse CM, Fields AP. Atypical protein kinase C iota is an oncogene in human non-small cell lung cancer. Cancer Res 2005; 65:8905-11; PMID:16204062; http://dx.doi.org/ 10.1158/0008-5472.CAN-05-2372 [DOI] [PubMed] [Google Scholar]
- 29.Murray NR, Kalari KR, Fields AP. Protein kinase Ciota expression and oncogenic signaling mechanisms in cancer. J Cell Physiol 2011; 226:879-87; PMID:20945390; http://dx.doi.org/ 10.1002/jcp.22463 [DOI] [PMC free article] [PubMed] [Google Scholar]
- 30.Baldwin RM, Parolin DA, Lorimer IA. Regulation of glioblastoma cell invasion by PKC iota and RhoB. Oncogene 2008; 27:3587-95; PMID:18212741; http://dx.doi.org/ 10.1038/sj.onc.1211027 [DOI] [PubMed] [Google Scholar]
- 31.Baldwin RM, Garratt-Lalonde M, Parolin DA, Krzyzanowski PM, Andrade MA, Lorimer IA. Protection of glioblastoma cells from cisplatin cytotoxicity via protein kinase Ciota-mediated attenuation of p38 MAP kinase signaling. Oncogene 2006; 25:2909-19; PMID:16331246; http://dx.doi.org/ 10.1038/sj.onc.1209312 [DOI] [PubMed] [Google Scholar]
- 32.Baldwin RM, Barrett GM, Parolin DA, Gillies JK, Paget JA, Lavictoire SJ, Gray DA, Lorimer IA. Coordination of glioblastoma cell motility by PKCiota. Mol. Cancer 2010; 9:233. [DOI] [PMC free article] [PubMed] [Google Scholar]
- 33.Scott MT, Ingram A, Ball KL. PDK1-dependent activation of atypical PKC leads to degradation of the p21 tumour modifier protein. EMBO J 2002; 21:6771-80; PMID:12485998; http://dx.doi.org/ 10.1093/emboj/cdf684 [DOI] [PMC free article] [PubMed] [Google Scholar]
- 34.Ferbeyre G, de Stanchina E, Querido E, Baptiste N, Prives C, Lowe SW. PML is induced by oncogenic ras and promotes premature senescence. Genes Dev 2000; 14:2015-27; PMID:10950866 [PMC free article] [PubMed] [Google Scholar]
- 35.Coppe JP, Desprez PY, Krtolica A, Campisi J. The senescence-associated secretory phenotype: the dark side of tumor suppression. Annu Rev Pathol 2010; 5:99-118; PMID:20078217; http://dx.doi.org/ 10.1146/annurev-pathol-121808-102144 [DOI] [PMC free article] [PubMed] [Google Scholar]
- 36.Davoli T, Denchi EL, de Lange T. Persistent telomere damage induces bypass of mitosis and tetraploidy. Cell 2010; 141:81-93; PMID:20371347; http://dx.doi.org/ 10.1016/j.cell.2010.01.031 [DOI] [PMC free article] [PubMed] [Google Scholar]
- 37.Xu WS, Perez G, Ngo L, Gui CY, Marks PA. Induction of polyploidy by histone deacetylase inhibitor: a pathway for antitumor effects. Cancer Res 2005; 65:7832-9; PMID:16140952; http://dx.doi.org/ 10.1158/0008-5472.CAN-04-4313 [DOI] [PubMed] [Google Scholar]
- 38.Mosieniak G, Sikora E. Polyploidy: the link between senescence and cancer. Curr Pharm Des 2010; 16:734-40; PMID:20388083; http://dx.doi.org/ 10.2174/138161210790883714 [DOI] [PubMed] [Google Scholar]
- 39.Boveri T. Concerning the origin of malignant tumours by Theodor Boveri. Translated and annotated by Henry Harris. J Cell Sci 2008; 121:1-84; PMID:18089652; http://dx.doi.org/ 10.1242/jcs.025742 [DOI] [PubMed] [Google Scholar]
- 40.Nigg EA. Origins and consequences of centrosome aberrations in human cancers. Int J Cancer 2006; 119:2717-23; PMID:17016823; http://dx.doi.org/ 10.1002/ijc.22245 [DOI] [PubMed] [Google Scholar]
- 41.Srsen V, Gnadt N, Dammermann A, Merdes A. Inhibition of centrosome protein assembly leads to p53-dependent exit from the cell cycle. J Cell Biol 2006; 174:625-30; PMID:16943179; http://dx.doi.org/ 10.1083/jcb.200606051 [DOI] [PMC free article] [PubMed] [Google Scholar]
- 42.Schmidt S, Schneider L, Essmann F, Cirstea IC, Kuck F, Kletke A, Janicke RU, Wiek C, Hanenberg H, Ahmadian MR. et al. The centrosomal protein TACC3 controls paclitaxel sensitivity by modulating a premature senescence program. Oncogene 2010; 29:6184-92; PMID:20729911; http://dx.doi.org/ 10.1038/onc.2010.354 [DOI] [PubMed] [Google Scholar]
- 43.Manning JA, Kumar S. A potential role for NEDD1 and the centrosome in senescence of mouse embryonic fibroblasts. Cell Death Dis 2010; 1:e35; PMID:21364642; http://dx.doi.org/ 10.1038/cddis.2010.12 [DOI] [PMC free article] [PubMed] [Google Scholar]
- 44.Ohshima S. Centrosome aberrations associated with cellular senescence and p53 localization at supernumerary centrosomes. Oxi. Med Cell Longev 2012; 2012:217594. [DOI] [PMC free article] [PubMed] [Google Scholar]
- 45.Saksela E, Moorhead PS. Aneuploidy in the degenerative phase of serial cultivation of human cell strains. Proc Natl Acad Sci U. S A 1963; 50:390-5; http://dx.doi.org/ 10.1073/pnas.50.2.390 [DOI] [PMC free article] [PubMed] [Google Scholar]
- 46.Wagner M, Hampel B, Bernhard D, Hala M, Zwerschke W, Jansen-Durr P. Replicative senescence of human endothelial cells in vitro involves G1 arrest, polyploidization and senescence-associated apoptosis. Exp Gerontol 2001; 36:1327-47; PMID:11602208; http://dx.doi.org/ 10.1016/S0531-5565(01)00105-X [DOI] [PubMed] [Google Scholar]
- 47.Ohshima S, Seyama A. Cellular aging and centrosome aberrations. Ann N Y Acad Sci 2010; 1197:108-17; PMID:20536839; http://dx.doi.org/ 10.1111/j.1749-6632.2009.05396.x [DOI] [PubMed] [Google Scholar]
- 48.Panopoulos A, Pacios-Bras C, Choi J, Yenjerla M, Sussman MA, Fotedar R, Margolis RL. Failure of cell cleavage induces senescence in tetraploid primary cells. Mol Biol Cell 2014; 25:3105-18; PMID:25143403; http://dx.doi.org/ 10.1091/mbc.E14-03-0844 [DOI] [PMC free article] [PubMed] [Google Scholar]
- 49.Amador V, Ge S, Santamaria PG, Guardavaccaro D, Pagano M. APC/C(Cdc20) controls the ubiquitin-mediated degradation of p21 in prometaphase. Mol Cell 2007; 27:462-73; PMID:17679094; http://dx.doi.org/ 10.1016/j.molcel.2007.06.013 [DOI] [PMC free article] [PubMed] [Google Scholar]
- 50.Ohshima S. Abnormal mitosis in hypertetraploid cells causes aberrant nuclear morphology in association with H2O2-induced premature senescence. Cytometry A 2008; 73:808-15; PMID:18618767; http://dx.doi.org/ 10.1002/cyto.a.20604 [DOI] [PubMed] [Google Scholar]
- 51.Poehlmann A, Habold C, Walluscheck D, Reissig K, Bajbouj K, Ullrich O, Hartig R, Gali-Muhtasib H, Diestel A, Roessner A, Schneider-Stock R. Cutting edge: Chk1 directs senescence and mitotic catastrophe in recovery from G(2) checkpoint arrest. J Cell Mol Med 2011; 15:1528-41; PMID:20716119; http://dx.doi.org/ 10.1111/j.1582-4934.2010.01143.x [DOI] [PMC free article] [PubMed] [Google Scholar]
- 52.Ye C, Zhang X, Wan J, Chang L, Hu W, Bing Z, Zhang S, Li J, He J, Wang J, Zhou G. Radiation-induced cellular senescence results from a slippage of long-term G2 arrested cells into G1 phase. Cell Cycle 2013; 12:1424-32; PMID:23574719; http://dx.doi.org/ 10.4161/cc.24528 [DOI] [PMC free article] [PubMed] [Google Scholar]
- 53.Schmidt S, Essmann F, Cirstea IC, Kuck F, Thakur HC, Singh M, Kletke A, Janicke RU, Wiek C, Hanenberg H, Ahmadian MR, Schulze-Osthoff K, Nurnberg B, Piekorz RP. The centrosome and mitotic spindle apparatus in cancer and senescence. Cell Cycle 2010; 9:4469-73; PMID:21088502; http://dx.doi.org/ 10.4161/cc.9.22.13684 [DOI] [PubMed] [Google Scholar]
- 54.Baker DJ, Jeganathan KB, Cameron JD, Thompson M, Juneja S, Kopecka A, Kumar R, Jenkins RB, de Groen PC, Roche P, van Deursen JM. BubR1 insufficiency causes early onset of aging-associated phenotypes and infertility in mice. Nat Genet 2004; 36:744-9; PMID:15208629; http://dx.doi.org/ 10.1038/ng1382 [DOI] [PubMed] [Google Scholar]
- 55.Prencipe M, Fitzpatrick P, Gorman S, Tosetto M, Klinger R, Furlong F, Harrison M, O'Connor D, Roninson IB, O'Sullivan J, McCann A. Cellular senescence induced by aberrant MAD2 levels impacts on paclitaxel responsiveness in vitro. Br J Cancer 2009; 101:1900-8; PMID:19935801; http://dx.doi.org/ 10.1038/sj.bjc.6605419 [DOI] [PMC free article] [PubMed] [Google Scholar]
- 56.Michel LS, Liberal V, Chatterjee A, Kirchwegger R, Pasche B, Gerald W, Dobles M, Sorger PK, Murty VV, Benezra R. MAD2 haplo-insufficiency causes premature anaphase and chromosome instability in mammalian cells. Nature 2001; 409:355-9; PMID:11201745; http://dx.doi.org/ 10.1038/35053094 [DOI] [PubMed] [Google Scholar]
- 57.Dai W, Wang Q, Liu T, Swamy M, Fang Y, Xie S, Mahmood R, Yang YM, Xu M, Rao CV. Slippage of mitotic arrest and enhanced tumor development in mice with BubR1 haploinsufficiency. Cancer Res 2004; 64:440-5; PMID:14744753; http://dx.doi.org/ 10.1158/0008-5472.CAN-03-3119 [DOI] [PubMed] [Google Scholar]
- 58.Lin HK, Chen Z, Wang G, Nardella C, Lee SW, Chan CH, Yang WL, Wang J, Egia A, Nakayama KI. et al. Skp2 targeting suppresses tumorigenesis by Arf-p53-independent cellular senescence. Nature 2010; 464:374-9; PMID:20237562; http://dx.doi.org/ 10.1038/nature08815 [DOI] [PMC free article] [PubMed] [Google Scholar]
- 59.Yaglom JA, Gabai VL, Sherman MY. High levels of heat shock protein Hsp72 in cancer cells suppress default senescence pathways. Cancer Res 2007; 67:2373-81; PMID:17332370; http://dx.doi.org/ 10.1158/0008-5472.CAN-06-3796 [DOI] [PubMed] [Google Scholar]
- 60.Knauf JA, Ouyang B, Knudsen ES, Fukasawa K, Babcock G, Fagin JA. Oncogenic RAS induces accelerated transition through G2/M and promotes defects in the G2 DNA damage and mitotic spindle checkpoints. J Biol Chem 2006; 281:3800-9; PMID:16316983; http://dx.doi.org/ 10.1074/jbc.M511690200 [DOI] [PubMed] [Google Scholar]
- 61.Debacq-Chainiaux F, Erusalimsky JD, Campisi J, Toussaint O. Protocols to detect senescence-associated beta-galactosidase (SA-betagal) activity, a biomarker of senescent cells in culture and in vivo. Nat Protoc 2009; 4:1798-806; PMID:20010931; http://dx.doi.org/ 10.1038/nprot.2009.191 [DOI] [PubMed] [Google Scholar]
Associated Data
This section collects any data citations, data availability statements, or supplementary materials included in this article.