

Abstract
PARP inhibitors have been approved for treatment of tumors with mutations in or loss of BRCA1/2. The molecular mechanisms and particularly the cellular phenotypes resulting in synthetic lethality are not well understood and varying clinical responses have been observed. We have investigated the dose- and time-dependency of cell growth, cell death and cell cycle traverse of 4 malignant lymphocyte cell lines treated with the PARP inhibitor Olaparib. PARP inhibition induced a severe growth inhibition in this cell line panel and increased the levels of phosphorylated H2AX-associated DNA damage in S phase. Repair of the remaining replication related damage caused a G2 phase delay before entry into mitosis. The G2 delay, and the growth inhibition, was more pronounced in the absence of functional ATM. Further, Olaparib treated Reh and Granta-519 cells died by apoptosis, while U698 and JVM-2 cells proceeded through mitosis with aberrant chromosomes, skipped cytokinesis, and eventually died by necrosis. The TP53-deficient U698 cells went through several rounds of DNA replication and mitosis without cytokinesis, ending up as multinucleated cells with DNA contents of up to 16c before dying. In summary, we report here for the first time cell cycle-resolved DNA damage induction, and cell line-dependent differences in the mode of cell death caused by PARP inhibition.
Keywords: ATM, cell death, DNA damage, DNA replication, PARP inhibition
Introduction
Cells deficient in homologous recombination repair (HRR) are hypersensitive to PARP inhibitors.1,2 While cells may tolerate either PARP inhibition or HRR defects alone, the combination is lethal and termed synthetic lethality. PARP inhibitors are approved for monotherapy of patients with deleterious germline mutated BRCA genes. Likewise, patients with tumors with compromised function of the HRR signaling protein ATM could also benefit from PARP inhibitor treatment, including chronic lymphocytic leukemia (CLL),6-8 lung cancer,9 breast cancer,10,11 and mantle cell lymphomas (MCL).3-5 MCL is an aggressive subtype of Non-Hodgkins lymphoma with poor treatment response, and the function of ATM is lost in 50% of the patients. PARP inhibition may prove to be a treatment option for ATM-deficient MCL patients since specific toxicity by PARP inhibition in cells that lack functional ATM have been found both in vitro and in vivo.12-18
Poly(ADP-ribose) polymerase 1 (PARP1) is an abundant nuclear protein, and along with PARP2, is the only member of the PARP protein family that bind to DNA. DNA binding of PARP1/2 via its Zinc finger motif is known to be activated by DNA damage.19,20 Upon DNA binding PARP1 will catalyze the PARylation of itself 21 and other target proteins,22,23 finally resulting in the electrostatic repulsion from DNA.24 Ninety percent of all PARylation in a cell is caused by PARP1.23 In addition to potently inhibit PARylation, Olaparib (AZD-2281), a small molecular inhibitor of PARP1 (IC50= 5 nM) and PARP2 (IC50 = 1 nM), has been found to strongly inhibit the release of PARP1 from DNA after binding.25 Olaparib is thus fixing PARP1 to DNA lesions; this firm binding enhances the cytotoxic effect of the inhibitor.
Originally, it was suggested that PARP inhibition impairs repair of endogenous single-strand breaks (SSBs) which would be converted into double- strand breaks (DSB) during DNA replication. The accumulation of DSBs is lethal for cells lacking essential factors in homologous recombination repair (HRR). In later years this model has been questioned by the lack of increase in SSBs after PARP inhibition.26,27 Recent work identified PARP1/2 trapped onto DNA lesions as the major culprit behind PARP inhibitor toxicity, along with the kinetic inhibitory effect.25 Probably, PARP inhibitors (like topoisomerase 1 inhibitors) physically prevent religation of SSBs as well as hinder PARP-mediated repair. Screens for genes generating synthetic lethality in combination with PARP inhibitor have revealed a number of different candidates, mostly genes involved in different aspects of DNA repair.28-30 The MRE11-RAD50-NBS1 (MRN) damage recognition complex seems to be important, as enhanced PARP inhibitor sensitivity is conferred by both MRE11-deficiency,30-32 and NBS1-deficiency.13,30 The MRN-complex has been implicated as either a preceding or an indiscriminate factor for both non-homologous end-joining (NHEJ) and HRR.33-36
In the clinic, the response rates to Olaparib are below 50% among breast and ovarian cancer patients with confirmed BRCA1/2 inactivation.37-39 A better understanding of the function of PARP inhibition is needed at the molecular and cellular level to allow stratification of patients for PARP inhibitor treatment. Differences in cellular phenotypes like apoptosis, cell cycle delay, and levels of DNA damage in different tumors after PARP inhibition depend on genetic background. Such phenotypes may predict the clinical efficacy of PARP inhibitors.
We have developed an automated sample staining protocol that allowed the accurate assessment of cell cycle distributions, cell death and cell cycle-resolved DNA damage levels. The contribution of ATM deficiency, both ATM mutation and pharmacological inhibition, to the time- and dose-dependent effects of PARP inhibitor treatment was examined in 4 malignant lymphocyte cell lines. We resolved cell line specific phenotypic responses, and discuss potentially clinical important genetic modulators that may underlie the heterogeneous treatment response seen in PARPi trials.
Results
The PARP inhibitor Olaparib reduces cell growth and induces cell death
The effect of abolished ATM signaling during PARP inhibitor treatment on cell viability and growth was monitored over 72 h. Control cultures, as well as cells treated only with 10 µM KU-55933 (ATMi) grew exponentially during the 72 h experiment (Fig. 1). Inhibition of ATM in the absence of PARP inhibitor (PARPi) resulted in a decrease in cell numbers, also for the partially ATM-deficient Granta-519 cells. Cell numbers decreased in a dose-dependent manner after treatment with PARPi, and the growth curves were not exponential after 3 μM Olaparib at the later times (Fig. 1). If cells were treated with ATMi in addition to PARPi, growth was reduced further compared to solely inhibiting PARP. The dose-response curves for Olaparib at 72 h in the absence and presence of ATMi were parallel and close to each other for Granta-519 cells, indicating that ATM inhibition in these cells is not synergistic with PARP inhibition (Fig. S1). The latter figure also shows that the dose-response curves were not parallel for the other 3 cell lines, most pronounced in U698 and JVM-2, indicating synergism/synthetic lethality.
Figure 1.

Cell growth during PARP and/or ATM inhibitor treatment. Cells were grown in the absence or presence of 10 µM KU55933 and/or the concentrations of Olaparib as indicated. Cell numbers were measured in a Coulter counter, and the fraction of viable cells (excluding propidium iodide) by flow cytometry. Cell numbers were multiplied by the fraction of live cells to give live cell numbers. Mean values from 3 independent experiments are given (±SEM).
The low increase in cell numbers at the highest concentrations of inhibitors could indicate a complete cessation of proliferation. Entry into mitosis was assessed after 24 and 72 h treatment by measuring the fraction of mitotic cells after addition of the microtubule-inhibitor nocodazole for the last 6 hours of the treatment period. Cells entered mitosis under all treatment conditions, although at lower rates at the highest concentrations of PARPi and in the presence of ATMi (Fig. S2).
The fraction of dead cells, i.e. necrotic and late apoptotic cells, was assessed by an inability of the cells to exclude propidium iodide. ATM inhibition alone had little or no effect on cell death (Fig. 2). 3 μM PARPi alone increased the fraction of dead cells in a time-dependent fashion for Reh, JVM-2 and Granta-519 cells. During dual ATMi and PARPi treatments, cell death increased compared to inhibiting PARP alone at all concentrations of PARPi. However, the dose-response curves at 72 h showed that there was no, or only a small, effect of adding ATMi for Granta-519 (Fig. S3). In contrast, the 3 other cell lines were characterized by diverging curves with and without ATMi.
Figure 2.

The fraction of dead cells during PARP and/or ATM inhibitor treatment. Cells were grown in the absence or presence of 10 µM KU55933 and/or the concentrations of Olaparib as indicated. Dead cells were measured by their inability to exclude propidium iodide. Mean values from 3 independent experiments are given (±SEM).
Although all dying cells take up propidium iodide eventually, apoptotic cells are characterized by DNA fragmentation detectable by the TUNEL-assay (See Fig. S4 for the assay used to detect apoptosis, cell cycle distribution and DNA damage by γH2AX). The fraction of apoptotic cells was unaffected by increasing PARPi concentrations in U698 cells and only slightly increased in JVM-2 cells (Fig. 3). In contrast, the apoptotic fractions of PARPi-treated Reh and Granta-519 cells increased with PARPi concentration. About half of the apoptotic cells were tetraploid, but some also originated from G1 and S. We tried to determine whether the apoptotic cells with a DNA content of 4c were originally in G2 or in M, but the degradation of pS10H3 in apoptotic cells precluded such attempts. All cell lines, except for Granta-519 with mutant ATM, showed significantly diverging curves in the dose-response curves for apoptosis, indicating synergy between ATMi and PARPi (Fig. S5). The fractions of dead cells (Fig. 2) and apoptotic cells (Fig. 3) were similar for drug-treated Reh and Granta-519 cells, showing that almost all the apoptotic cells were late apoptotic cells permeable for propidium iodide. This was not the case for U698 and JVM-2, where most of the necrotic cells were not apoptotic (Fig. S6). Lastly, we also examined unfixed cells that were sorted on their inability to exclude Hoechst 33258 dye, i.e., necrotic or late apoptotic cells. Dead U698 and JVM-2 cells had ruptured cytoplasmic and nuclear membranes (data not shown), which are among the hallmarks of necrosis.
Figure 3.

The fraction of apoptotic cells during PARP and/or ATM inhibitor treatment. The fraction of apoptotic cells was measured by the TUNEL assay during the course of 72 h treatment with PARP and/or ATM inhibition. Mean values from 3 independent experiments are given (±SEM).
Prolongation of the G2 phase after PARP inhibition
Since PARPi treatment caused a substantial reduction in cell growth, we investigated whether this could be caused by cell cycle arrest or delay in specific phases. ATMi alone had no effects on the cell cycle distributions, except that the fraction of mitotic U698 cells increased, consistent with our previous work.42 The most pronounced change in the DNA distributions after PARPi treatment was an increased fraction of cells in G2, even more pronounced when additionally adding ATMi in Reh and U698 cells (Fig. 4). The G2 fractions increased up to 24 h (JVM-2) and 48 h (3 other cell lines), and remained high during the experiment. However, the G2 fraction of PARPi treated U698 cells declined from 48 to 72 h, particularly pronounced in the presence of ATMi. This was probably due to the extensive endocycling of U698 cells at the higher Olaparib concentrations (see next chapter). Reh, U698, and to some degree JVM-2 cells showed diverging dose response curves with and without ATM inhibitor for the fractions of cells in G2 (Fig. S7). Considering the increased cell cycle time in the presence of the inhibitors, as indicated by the growth curves (Fig. 1) and the stathmokinetic nocodazole-experiment (Fig. S2), the G2 phase had a much longer duration under these conditions than the 2-5 h observed in the controls (Fig. S8, see also accompanying article in this issue). The latter figure also shows that S phase was prolonged by PARPi treatment, both in the presence and absence of the ATMi, but not to the same degree as G2.
Figure 4.

The fraction cells in G2 phase during PARP and/or ATM inhibitor treatment. Cells were fixed and stained for DNA and pS10H3 content, and measured by flow cytometry to obtain cell cycle distributions. The fractions of cells in G1, S and G2 were determined with the FlowJo software after exclusion of mitotic cells. Mean values from 3 independent experiments are given (±SEM).
Binucleation and endocycling of apoptosis-deficient cells
Cell cycle-analysis of U698 cells treated with 3 µM PARPi revealed an increase in the fraction of cells with DNA content above 4c at 72 h, even more pronounced with addition of ATMi. This was not the case for the other cell lines (shown for U698 and JVM-2; Fig. 5A). The low number of dead cells after 72 h treatment in U698 cells was apparently in contradiction with the severe growth retardation (Fig. 1) in this cell line. Since endocycling (initiation of DNA replication in polyploid cells) do not increase cell numbers, we treated U698 cells for 144 h to see if the number of cells with high DNA content increased further after 72 h. Diploid G1 cells accounted for only 5 ± 3 % of the U698 cells after 144 h, and the mean DNA content increased from 72 h, establishing further the pronounced endocycling phenotype in this cell line (Fig. 5A).
Figure 5.
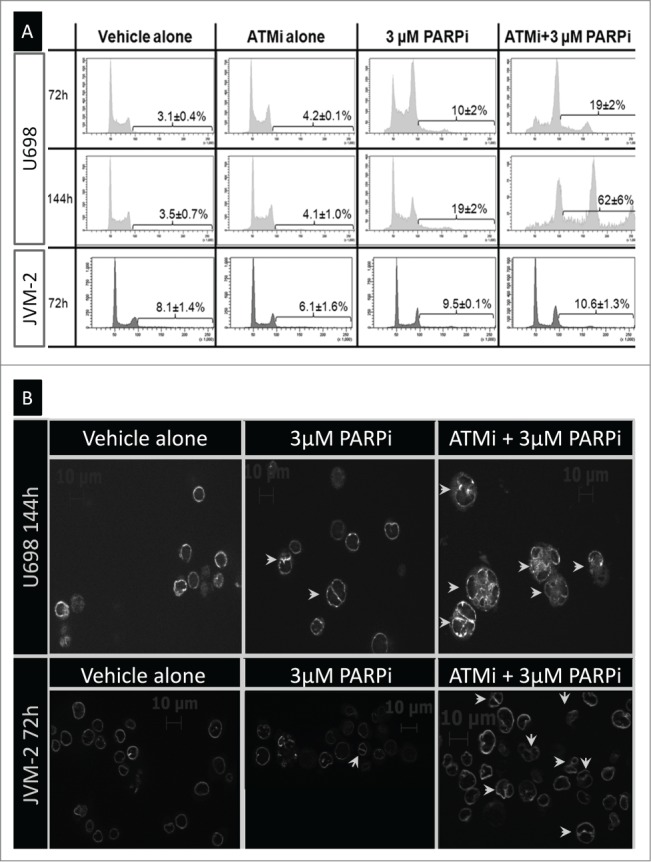
Multinucleation and endocycling in U698 cells and JVM-2 cells. (A) Cells were treated as indicated in the figure for 72 h or 144 h. The fraction of endocycling cells was measured after staining for DNA content and apoptosis (region indicated in each histogram). Apoptotic cells were excluded before analysis for the fractions of cells with a DNA content >4c. Mean values from 3 (72 h), or 2 (144 h) independent experiments are given (±SEM). (B) Cells were stained for DNA content, LMNB2 (nuclear membrane), and apoptosis. The non-apoptotic cells with 4c DNA content were sorted and examined for LMNB2 staining by microscopy.
Endocycling may occur with (acytokinetic mitosis) or without division (endomitosis or endoreplication) of the nucleus. Cells entered mitosis throughout the experiment (Fig. S2), which could indicate that DNA replication was initiated in multinuclear cells. To this end, we investigated whether PARPi- and ATMi-treated cells had more than one nucleus. For analysis by microscopy, cells were stained for the nuclear membrane protein LMNB2 (Lamin B2). A substantial fraction of drug-treated, but not control, U698 and JVM-2 cells were multinucleated (Fig. 5B). We further investigated this by sorting cells with 4c DNA content from cultures treated with 3 µM PARPi and/or ATMi for 72 h (Table 1). While the frequency of binuclear cells was independent of treatment for Reh and Granta-519 cells, it increased from 19% in control U698 and JVM-2 cells to almost 60% in cells treated with PARPi and ATMi. The majority of the “G2” U698 and JVM-2 cells measured in the previous paragraph after 72 h dual inhibitor treatment were thus binuclear G1 cells.
Table 1.
The fraction of multinucleated interphase cells with 4c DNA content and mitotic cells with aberrations
| Reh |
U698 |
JVM-2 |
Granta-519 |
|||||
|---|---|---|---|---|---|---|---|---|
| Multi-nucleated | Metaphases with chr-ab | Multi-nucleated | Metaphases with chr-ab | Multi-nucleated | Metaphases with chr-ab | Multi-nucleated | Metaphases with chr-ab | |
| Control | 6% | 0% | 19% | 3% (0.03) | 19% | 0% | 17% | 0% |
| ATMi | 7% | 0% | 25% | 7% (0.07) | 25% | 5% (0.05) | 17% | 0% |
| PARPi (3 µM) | 7% | 0% | 43% | 17% (0.26) | 43% | 0% | 16% | 6% (0.06) |
| PARPi+ATMi | 8% | 7% (0.07) | 56% | 91% (2,86) | 58% | 42% (0.47) | 15% | 0% |
Cells were treated for 72 h, cells with a DNA content of 4c were sorted, and multinucleated cells were scored as shown in Fig. 5B. The fraction of mitotic cells with tetra- and tri-radial chromosomes or telomeric fusions were scored after 48 h treatment. The mean number of the before mentioned chromosome aberrations per cell is shown in brackets. Examples of such aberrant chromosomes are shown in Fig. 7.
PARP inhibitor Olaparib causes replication-induced DNA damage
PARPi treatment has been suggested to cause DSBs during replication although we have not yet seen accurate analysis of cell cycle-resolved DNA damage. Therefore we employed γH2AX foci counting by microscopy after sorting of treated cells from the different cell cycle phases. Additionally, we employed fluorescent barcoding to assess accurately cell cycle-resolved γH2AX-levels by flow cytometry analysis. γH2AX focus numbers and EdU-tracking of γH2AX levels in control cells and cells treated with PARPi for 24 h are reported in the accompanying article in this issue.
Sorting of control and PARPi treated Reh and U698 cells based on DNA and pS10H3 content showed that the large majority of G1 cells did not contain γH2AX foci after 24 h treatment (sort gates shown in Fig. S4; see also Fig. 2 in accompanying article in this issue). γH2AX increased in mid-S phase cells in a dose-dependent manner after 24 h treatment with PARPi (Fig. 6A, background corrected intensities relative to the γH2AX-negative G1 population). ATMi alone caused only a slight or no increase in γH2AX in mid-S phase. Additional treatment with ATMi did not increase γH2AX in mid-S phase in Reh, U698 and Granta-519, compared to the respective samples treated with PARPi alone. JVM-2 mid-S phase cells had systematically higher γH2AX content with the addition of ATMi, but the differences were not significant. There was also a less pronounced, increase in γH2AX in G2 cells after 24 h treatment with increasing concentrations of PARPi, both in the presence and absence of ATMi, but not for Reh cells (Fig. 6A).
Figure 6.
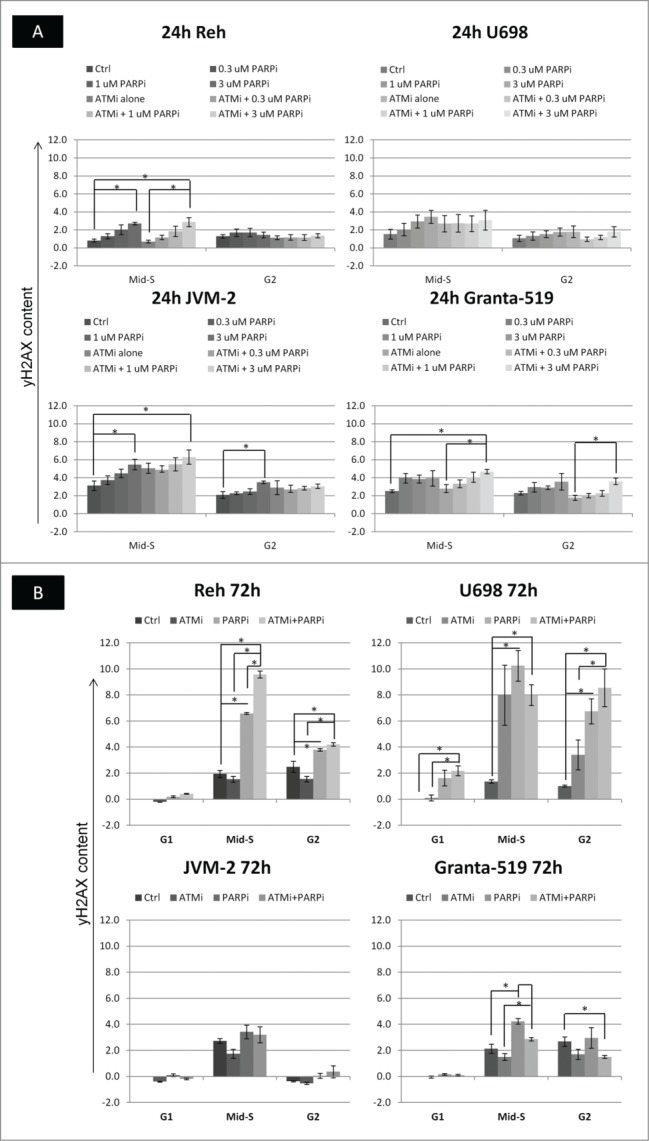
The content of γH2AX in different cell cycle phases after PARPi and/or ATMi treatment. The γH2AX intensities in different phases were determined as shown in Fig. S1. (A) The G1 cells did not contain foci, and the fluorescence of these cells was due to autofluorescence and a low level of non-specific staining at 24 h. The background fluorescence of mid-S and G2 cells were assumed to be 1.5 and 2 times the intensity of the G1 cells, respectively. These background intensities were subtracted from the fluorescence intensities of S and G2 cells to give γH2AX content, which was normalized to the fluorescence of the G1 cells. (B) After 72 h treatment, the G1 cells had enhanced staining and number of γH2AX foci in some cases. Barcoded control cells were therefore added to each sample such that normalization could be performed to untreated G1 cells in the same way as explained for A. Mean values from 3 independent experiments are given (±SEM, *p <0.05).
Microscopic examination revealed that U698 cells in G1 had several foci after 72 h treatment with 3 µM PARPi and ATMi, hence normalization against the G1 cells was not applicable at that time. To accurately quantify treatment-induced changes in γH2AX intensities at 72 h at the highest PARPi concentration, we added fluorescently barcoded control cells as internal control to each of the treated samples prior to staining (Fig. S4, top right). Additionally, necrotic/late apoptotic cells, abundantly present after 72 h, were labeled covalently before fixation, so they could be excluded during analysis. This experimental strategy revealed that only U698 cells had increased γH2AX staining in G1 (Fig. 6B). γH2AX increased from 24 to 72 h in mid-S and G2 Reh and U698 cells treated with 3 µM PARPi (+/− ATMi; Fig. 6). However, γH2AX in mid-S and G2 JVM-2 cells decreased from 24 h back to control levels or lower at 72 h, while the corresponding levels in Granta-519 remained almost unchanged (Fig. 6).
Analysis of metaphase spreads of cells after 48 h treatment revealed complex inter-chromosome rearrangements in U698 and JVM-2 cells treated with 3 µM PARPi and ATMi (Fig. 7). Treatment-induced tri- and tetra-radial chromosomes or telomeric fusions were only found in these 2 cell lines (Table 1).
Figure 7.
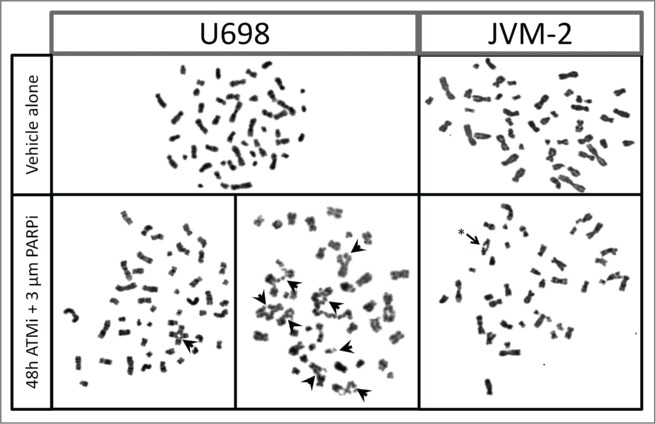
Tri- and tetra-radial chromosomes and telomere fusion in U698 and JVM-2 cells. Cells were grown in the absence, or presence of 10 µM KU-55933 and 3 µM Olaparib for 48 h. Nocodazole was added for the last 6 h of incubation to increase the yield of metaphases. Metaphase spreads were prepared by standard cytogenetic methods. Tri- and tetra-radial chromosomes are indicated by filled arrows, telomere fusion is indicated by an asterix.
Discussion
Inhibition of PARP in cells with impaired function of certain DNA repair gene products results in synthetic lethality. While the genetic determinants of synthetic lethality have been extensively studied, there have been few reports of the cellular phenotypes involved when cells are treated with PARPi. Here we have studied the effects of PARPi, with or without functional ATM, on DNA damage levels in different phases of the cell cycle, cell cycle distributions and cell death mechanisms. Novel findings of this work include cell cycle-specific induction and repair of DNA damage, cell line-dependent apoptosis, or mitosis with aberrant chromosomes followed by necrosis.
We found that PARP and ATM inhibition decreased cell growth synergistically in the 3 ATM-proficient cell lines. No such synergy was observed in Granta-519 cells, which are partially ATM-deficient. However, inhibition of ATM in Granta-519 cells affected these cells slightly. The additive, rather than synergistic, effects of ATM and PARP inhibition in Granta-519 cells suggest that ATM is not involved in sensing DNA damage in this cell line. Since treatment with ATMi alone did not cause increased cell death in the cell lines we have studied, prolonged cell cycle transit times in the absence of ATM activity must be the cause of the slowed cell growth. This is possibly due to decreased ATM-mediated phosphorylation of AKT.40,41
The present results show that the reduced growth caused by PARPi was due to reduced proliferation, although cell death also increased. Thus, a dramatic reduction in proliferation/viability after PARPi treatment when measured by MTT/MTS assays or colony forming assays might have been caused by slowed proliferation, and not necessarily cell death. Cell death mechanisms varied between the cell lines, as Reh and Granta-519 cells were found to die by apoptosis after PARP inhibition, while U698 and JVM-2 died by necrosis. This resembles ionizing radiation-induced cell death, as Reh and Granta-519 die by apoptosis, and U698 and JVM-2 die by necrosis after 4 Gy X-rays 43(and unpublished). In response to nutrient depletion and prolonged nocodazole treatment U698 cells do become apoptotic,43 demonstrating that U698 cells have an intact apoptotic machinery. Thus, the error must be in the upstream apoptosis-inducing part of the DDR signaling. Weston et al. 15 reported negative results of Annexin V-staining and proposed mitotic catastrophe as the cause of cell death in PARPi-treated Granta-519 cells. Our results of induction of apoptosis after PARP inhibition in Granta-519 cells are in agreement with the studies of Williamson et al.,16,18 who employed both Annexin V-staining and the TUNEL assay. Our LMNB2-staining did not show increased multinucleation in Granta-519 after PARPi treatment.
The most pronounced change in the cell cycle distribution after PARPi treatment was an increase in the fraction of cells in G2. Since the proliferation rate was decreased, the length of G2 was increased even more than indicated from the fraction of cells in this phase. The increase in G2 length was cell line dependent, with the most pronounced increase observed for U698 cells. Inhibition of ATM was synergistic with PARP-inhibition in Reh and U698 cells with respect to G2 accumulation, but less so in JVM-2, and not at all in the ATM-mutated Granta-519 cells. However, most interphase U698 and JVM-2 cells with a DNA content of 4c were in a binuclear post-mitotic state after 72 h PARPi/ATMi treatment, and we may thus have overestimated the fraction of G2 cells in these cell lines at the later times. The length of S phase also increased (but to a lesser degree than G2) and the prolongation of these 2 phases may be related to the induction of DNA damage, which will be discussed later.
Continuous ATM and PARP inhibition in U698 cells for 144 h revealed that more than 60% of the cells were multinucleated and endocycling. Even in the absence of cytokinesis, U698 cells entered a new S phase in a binuclear state, obtained octaploid DNA content, entered M again, skipped cytokinesis, and so on. JVM-2 cells also became binuclear, but in contrast to U698 cells, JVM-2 cells did not endocycle in response to PARP and ATM inhibition. We have previously shown that U698 cells lack a functional G1/S checkpoint in response to IR,43 which may be due to the lack of TP53 and/or RB1 function. The role of TP53 in prevention of polyploidy and endocycling has previously been reported44,45 JVM-2 cells have wildtype TP53 46 and RB1,47 and have an intact G1/S checkpoint as they arrest in G1 after ionizing radiation (unpublished). Our results thus support the notion that G1/S checkpoint activation after an aberrant mitosis may inhibit DNA replication also in binuclear post-mitotic cells with a tetraploid DNA content. Since these 2 cell lines do not become apoptotic, multinuclear cells accumulate, and in the case of U698, initiate several rounds of DNA replication. The possibility of uncoupling the order of cell cycle phases has been seen in normal, although specialized cells, like hepatocytes 44 and during meiosis.
To our knowledge we are the first to present cell cycle-resolved DNA damage induction after PARP inhibition, although replication dependent models-of-function have been suggested from the start.1,2 DNA damage, as revealed by increased γH2AX content, was induced during the traverse of control cells through S phase. This result is in agreement with other reports in the literature.48,49 The γH2AX levels in S phase cells, and to a lesser degree in G2 cells, increased further in a dose-dependent fashion from control S phase levels after PARPi treatment. The prolongation of S phase may be caused by stalling and collapsed replication forks struggling as they encounter the trapped PARP-DNA-complexes, while G2 phase prolongation may be a consequence of increased DNA damage in need of repair before entry into mitosis. γH2AX levels were not further increased by additionally inhibiting ATM. This may be a direct consequence of inhibiting ATM-mediated H2AX phosphorylation, as the γH2AX levels did not parallel the decreased cell growth, increased cell death, or the G2 fractions with the additional presence of ATMi (Figs. S1, S3, S5, S7).
γH2AX levels in PARPi treated (+/−ATMi) S/G2 phase Reh and U698 cells increased further from 24 to 72 h, indicating some accumulation of damage. This indication is further strengthened by the steep increase in cell death at the later times (Figs. 2, 3; compare with JVM-2 and Granta-519). Only U698 cells had increased γH2AX levels and foci in G1 after 72 h, possibly due to incompletely repaired DNA damage from the previous S phase. Since no increase in γH2AX levels was observed in G1 Reh cells, the cumulative DNA damage in Reh cells over time must be of a type that is not activating phosphorylation of H2AX in G1. In contrast to U698 and Reh cells, S phase γH2AX levels remained approximately constant in JVM-2 and Granta-519 from 24 to 72 h. γH2AX levels also remained constant in G2 Granta-519 cells, but decreased to zero in G2 JVM-2 cells. The reduced γH2AX levels may be explained by a higher fraction of binuclear “G1” cells among the JVM-2 cells with 4c DNA content at 72 h.
Weston et al. showed that proliferation was necessary for cytotoxicity after Olaparib treatment,15 in agreement with our results of S phase dependent induction of DNA damage. The remaining DNA damage (as measured by γH2AX) in G2 cells caused a prolongation of this phase, possibly so the DNA damage was reduced to acceptable levels before entry into mitosis. γH2AX foci in G2 cells are signaling the presence of double strand breaks,50 and the levels of such breaks are important for activation of the G2/M checkpoint. Homologous recombination repair is compromised in the absence of ATM activity.51 The DSBs in G2 may under such conditions be repaired by NHEJ, thus bringing the number of DSBs, and γH2AX levels, below a certain threshold. NHEJ is error-prone, and may lead to inter- and intra-chromosomal translocations by non-faithful recombination. Aberrant chromosomes were observed in PARPi and ATMi treated U698 and JVM-2 cells, but not in the other 2 cell lines. The simplest explanation why such chromosome aberrations were not seen in Reh and Granta-519 cells is that the cells leaving S phase with the highest numbers of DSBs are eliminated by apoptosis from G2. If the apoptosis-inducing checkpoint is deficient (U698, JVM-2), the cells proceed through mitosis, but encounter problems when about to divide. An alternative, but not exclusive, explanation is that U698 and JVM-2 cells are deficient with respect to other DNA repair mechanisms. Our unpublished mRNA expression array results have revealed that U698 cells express reduced levels of FANCF and RAG1/2, while JVM-2 cells have low levels of FANCI, RAD51C, CHK1, FEN1, SMC6 and TOPBP1. There may be an intricate interplay between the different repair mechanisms, and inactivation of certain actors may affect the choice of repair pathway. Deficiency in Fanconi anemia (FA) proteins, CHK1 and RAD51,13 and recently RAD51C52 and FEN125 has already been shown to cause sensitivity to PARPi treatment. Sensitivity to other DNA-protein crosslinking agents like 5-Aza-2′deoxycytidine53 has also been reported in FA-cells, in agreement with Murai et al.'s observation of PARP trapping.25
In summary, we have shown in this work that cellular phenotypes after inhibition of PARP are dependent on the cell line studied, likely due to the differences in genetic background. The 2 cell lines with t(11;14) driving transcription of CCND1, JVM-2 and Granta-519, died by necrosis and apoptosis, respectively, and the status of ATM and TP53 can neither explain the differential mode of death. Differences in cell cycle arrest and cell death mechanisms may lead to differences in the in vivo response of tumors when treated with PARP inhibitors, independent of the known modulation by lack of DNA repair-associated proteins like BRCA1/2 and ATM.
Materials and methods
Cell lines
Reh is derived from a pre-B cell acute lymphoid leukemia (ALL) patient,54 while U698 is derived from a patient with diffuse large cell lymphoma.55 U698 cells do not have functional TP53 and RB1.56 JVM-2 is an Epstein-Bar virus (EBV)-transformed B-lymphocytic leukemia (B-CLL) cell line57 (DSMZ, Braunschweig, Germany). There are several studies indicating that B-CLL s carrying the t(11;14) translocation may correspond to blastoid MCL variants,58 and use of the JVM-2 cell line as a model system for MCL is well established. Granta-519 is an EBV-transformed cell line from a high-grade MCL relapse patient with t(11;14) translocation.59 Granta-519 was also purchased from DSMZ. Granta-519 has been reported to be ATM deficient, with one ATM allele deleted,60 and the other allele containing the missense mutation R2832C in the ATM kinase domain.61 However, we (unpublished) and others have observed low background levels of ATM 16 and low induction of pS1981ATM in Granta-519 cells after ionizing radiation,17 so these cells may not be entirely ATM deficient. All cell lines were confirmed free of mycoplasma infection before use.
Antibodies and dyes
Primary antibodies used in the experiments were rabbit anti-pS10H3, mouse anti-pS139H2AX (Millipore) and mouse anti-LMNB2 (Merck Chemicals). Secondary antibodies used in the experiments were goat anti-rabbit R-PE (Life Technologies) and rabbit anti-mouse FITC (DAKO). Thiazole orange (TO) and propidium iodide (PI) were purchased from BD Biosciences. Pacific Blue and Pacific Orange NHS ester-reactive dyes were obtained from Life Technologies. Hoechst 33358 was purchased from Calbiochem and FxCycle Far Red and RNase A from Life Technologies. TdT-kit and Biotin-16-dUTP together with Amersham Streptavidin-Cy5 were purchased from Roche Diagnostics and GE Healthcare respectively.
Cytotoxicity studies
Cells were grown as described previously,43 except that the 4 cell lines were seeded at the following densities: JVM-2 at 1.0 × 10⁵, Granta-519 at 1.2 × 10⁵, U698 at 2.0 × 10⁵ and Reh at 2.5 × 10⁵ cells/ml. The PARP inhibitor (PARPi) Olaparib/AZD2281 62 and ATM inhibitor (ATMi) KU-55933 63 were purchased from Selleck Chemicals and dissolved in DMSO to a stock solution of 10 mM. The inhibitors were added directly to cell cultures at different PARPi concentrations with or without 10 μM ATMi. Untreated controls (receiving vehicle alone) and ATMi alone controls were also included, the final DMSO concentration in all cultures ranged from 0.10-0.13 %. Patients receiving 200 mg or 400 mg of Olaparib twice each day were reported to have blood plasma concentrations of Olaparib ranging from 1.38 to 20.0 µM.64 Thus, we employed clinically relevant concentrations of PARPi (0.3 μM, 1 μM and 3 μM). To assess the flux of cells into mitosis we employed the microtubule polymerization-inhibitor nocodazole (1ug/ml; Sigma-Aldrich) for 6 h before harvest.
Cells were harvested at 24, 48 and 72 h after start of the treatment, and sampled for immediate Coulter Counting (Z2 Coulter Counter; Beckman Coulter) and viability analysis (as described in the BD Viability kit (#349483; BD Biosciences)), and for fixation. Sample pellets were fixed in −20 °C 100 % methanol, the fixed samples were washed once in phosphate buffered saline (PBS) before further staining.
Staining strategies, flow cytometry and microscopy
Fixed cells were simultaneously stained for apoptosis, mitosis, γH2AX, and DNA content. Apoptotic cells were detected with the TUNEL assay as described earlier,43 except that streptavidin-Cy5 (1:500) was used for detection. Mitotic cells were discriminated from interphase cells by staining with anti-phospho-S10-histone H3 (pS10H3; 1:500). Samples were also stained for pS139H2AX (1:500), and appropriate fluorochrome-labeled anti-mouse/rabbit antibodies were used for detection of the primary ones. The cells were blocked in 4% (w/v) non-fat dried milk during the staining with the respective primary and secondary antibodies. The cells were finally stained for DNA content with 1.5 µg/ml Hoechst 33258. Cells to be analyzed by microscopy for multinucleation after sorting were stained for LMNB2 (1:200) instead of γH2AX.
Alternatively, Pacific Blue barcoding was used to correctly measure cell cycle-resolved DNA damage induction (γH2AX) under conditions where the G1 cells were not negative (see last chapter Materials and Methods, results in Fig. 6B). Cells were stained with Pacific Orange (20 min, 4˚C, 0.475 ng/µl in PBS) for dead cell discrimination, and thereafter fixed. Fixed control cells were stained with Pacific Blue (15 min, RT, 0.015 ng/µl) and mixed with fixed treated cells. The mixed samples were thereafter stained for γH2AX, mitosis (as above), and DNA content with the FxCycle Far Red DNA stain (following the manufacturers recommendation).
Cells were analyzed in an LSRII or sorted in a FACS Vantage SE flow cytometer (Becton Dickinson). Doublets were discriminated from the analysis by using the area and width of the DNA signal. Excitation source and emission filter used for each fluorochrome are listed in Table S1.
G1, S, G2 and mitotic cells were sorted using the regions and gating strategy shown in Fig. S4. Counting of γH2AX foci in cells sorted by cell cycle phase was performed in an Axio Z1 Imager microscope equipped with ApoTome, enabling structured illumination (Carl Zeiss). Z-stacks with a distance of 1µm covering the complete depth of the cells were obtained. AxioVision LE software (Carl Zeiss; version 4.5) was used to process the microscopy images. G2 cells were sorted from samples stained for LMNB2 for analysis of multinucleation. The optical configurations used in the microscope are listed in Table S1.
For cytogenetic analysis of chromosome aberrations after 48 h treatment, nocodazole (1 µg/ml) was added 4 h prior to harvesting the cells. The chromosomes were prepared as described earlier.65
Data treatment and statistical analysis
The gating structures used to obtain the flow cytometry results are shown in Fig. S4. Briefly, apoptotic cells were first quantified and discriminated (after exclusion of doublets, not shown). Thereafter, mitotic cells were quantified and excluded for analysis of the distribution of cells in G1, S and G2. Analysis of the cell cycle distributions was performed using version 7.2.4 of the FlowJo software (TreeStar). The mean RMS value for the 288 samples was 2.4, with a standard deviation of 0.7. For estimation of cell cycle-resolved γH2AX staining intensities, the G1, S, G2 and M regions shown in Fig. S4 were used for gating the γH2AX distributions, from which median γH2AX intensities were obtained. In the alternative approach, dead cells were excluded, and control and treated cells (in the same sample) were separated as shown in the right panel at the top in Fig. S4.
Since fluorescence microscopy revealed that the G1 cells did not contain γH2AX foci after 24 h (see “Results”), the fluorescence measured from these cells by flow cytometry was probably due to autofluorescence and non-specific staining. To avoid problems with sample-to-sample variation in the γH2AX immunofluorescence staining caused by differences in cell and/or epitope numbers (http://onlinescientificpublications.blogspot.no/2013/01/improved-surface-antigen-expression_23.html), we normalized the fluorescence intensities of S, G2 and mitotic cells to those of the G1 cells in the same sample. The G1 cells were not devoid of foci in all cases after 72 h treatment with the highest drug concentrations (see “Results”). The fluorescence was therefore normalized to the fluorescence of G1 control cells that was fluorescently barcoded and stained together with the treated cells. Specific fluorescence was calculated by subtracting 1, 1.5 and 2 times the fluorescence of control G1 cells in the sample from the G1, mid-S, and G2 intensities of the treated cells, respectively.
The data are shown as the mean value ± the standard error of the mean. Student's t-test was used to test treatment-induced differences within a 95% confidence interval. Equal variances between the groups were initially tested with the F-test.
Disclosure of Potential Conflicts of Interest
No potential conflicts of interest were disclosed.
Acknowledgments
Thanks to Randi G. Syljuåsen for helpful discussions.
Funding
This work was supported by the Norwegian Cancer Society.
Supplemental Material
Supplemental data for this article can be accessed on the publisher's website.
References
- 1.Farmer H, McCabe N, Lord CJ, Tutt AN, Johnson DA, Richardson TB, Santarosa M, Dillon KJ, Hickson I, Knights C et al.. Targeting the DNA repair defect in BRCA mutant cells as a therapeutic strategy. Nature 2005; 434:917-21; PMID:15829967; http://dx.doi.org/ 10.1038/nature03445 [DOI] [PubMed] [Google Scholar]
- 2.Bryant HE, Schultz N, Thomas HD, Parker KM, Flower D, Lopez E, Kyle S, Meuth M, Curtin NJ, Helleday T. Specific killing of BRCA2-deficient tumours with inhibitors of poly(ADP-ribose) polymerase. Nature 2005; 434:913-17; PMID:15829966; http://dx.doi.org/ 10.1038/nature03443 [DOI] [PubMed] [Google Scholar]
- 3.Hartmann EM, Campo E, Wright G, Lenz G, Salaverria I, Jares P, Xiao W, Braziel RM, Rimsza LM, Chan WC et al.. Pathway discovery in mantle cell lymphoma by integrated analysis of high-resolution gene expression and copy number profiling. Blood 2010; 116:953-61; PMID:20421449; http://dx.doi.org/ 10.1182/blood-2010-01-263806 [DOI] [PMC free article] [PubMed] [Google Scholar]
- 4.Greiner TC, Dasgupta C, Ho VV, Weisenburger DD, Smith LM, Lynch JC, Vose JM, Fu K, Armitage JO, Braziel RM et al.. Mutation and genomic deletion status of ataxia telangiectasia mutated (ATM) and p53 confer specific gene expression profiles in mantle cell lymphoma. Proc Natl Acad Sci U S A 2006; 103:2352-7; PMID:16461462; http://dx.doi.org/ 10.1073/pnas.0510441103 [DOI] [PMC free article] [PubMed] [Google Scholar]
- 5.Schaffner C, Idler I, Stilgenbauer S, Dohner H, Lichter P. Mantle cell lymphoma is characterized by inactivation of the ATM gene. Proc Natl Acad Sci U S A 2000; 97:2773-8; PMID:10706620; http://dx.doi.org/ 10.1073/pnas.050400997 [DOI] [PMC free article] [PubMed] [Google Scholar]
- 6.Stankovic T, Weber P, Stewart G, Bedenham T, Murray J, Byrd PJ, Moss PA, Taylor AM. Inactivation of ataxia telangiectasia mutated gene in B-cell chronic lymphocytic leukaemia. Lancet 1999; 353:26-9; PMID:10023947; http://dx.doi.org/ 10.1016/S0140-6736(98)10117-4 [DOI] [PubMed] [Google Scholar]
- 7.Dohner H, Stilgenbauer S, James MR, Benner A, Weilguni T, Bentz M, Fischer K, Hunstein W, Lichter P. 11q deletions identify a new subset of B-cell chronic lymphocytic leukemia characterized by extensive nodal involvement and inferior prognosis. Blood 1997; 89:2516-22; PMID:9116297 [PubMed] [Google Scholar]
- 8.Bullrich F, Rasio D, Kitada S, Starostik P, Kipps T, Keating M, Albitar M, Reed JC, Croce CM. ATM mutations in B-cell chronic lymphocytic leukemia. Cancer Res 1999; 59:24-27; PMID:9892178 [PubMed] [Google Scholar]
- 9.Ding L, Getz G, Wheeler DA, Mardis ER, McLellan MD, Cibulskis K, Sougnez C, Greulich H, Muzny DM, Morgan MB et al.. Somatic mutations affect key pathways in lung adenocarcinoma. Nature 2008; 455:1069-75; PMID:18948947; http://dx.doi.org/ 10.1038/nature07423 [DOI] [PMC free article] [PubMed] [Google Scholar]
- 10.Fang Z, Kozlov S, McKay MJ, Woods R, Birrell G, Sprung CN, Murrell DF, Wangoo K, Teng L, Kearsley JH et al.. Low levels of ATM in breast cancer patients with clinical radiosensitivity. Genome Integr 2010; 1:9; PMID:20678261; http://dx.doi.org/ 10.1186/2041-9414-1-9 [DOI] [PMC free article] [PubMed] [Google Scholar]
- 11.Tommiska J, Bartkova J, Heinonen M, Hautala L, Kilpivaara O, Eerola H, Aittomaki K, Hofstetter B, Lukas J, von SK et al.. The DNA damage signalling kinase ATM is aberrantly reduced or lost in BRCA1/BRCA2-deficient and ER/PR/ERBB2-triple-negative breast cancer. Oncogene 2008; 27:2501-6; PMID:17982490; http://dx.doi.org/ 10.1038/sj.onc.1210885 [DOI] [PubMed] [Google Scholar]
- 12.Bryant HE, Helleday T. Inhibition of poly (ADP-ribose) polymerase activates ATM which is required for subsequent homologous recombination repair. Nucleic Acids Research 34:1685-91; PMID:16556909; http://dx.doi.org/ 10.1093/nar/gkl108 [DOI] [PMC free article] [PubMed] [Google Scholar]
- 13.McCabe N, Turner NC, Lord CJ, Kluzek K, Bialkowska A, Swift S, Giavara S, O'Connor MJ, Tutt AN, Zdzienicka MZ et al.. Deficiency in the repair of DNA damage by homologous recombination and sensitivity to poly(ADP-ribose) polymerase inhibition. Cancer Res 2006; 66:8109-15; PMID:16912188; http://dx.doi.org/ 10.1158/0008-5472.CAN-06-0140 [DOI] [PubMed] [Google Scholar]
- 14.Aguilar-Quesada R, Munoz-Gamez JA, Martin-Oliva D, Peralta A, Valenzuela MT, Matinez-Romero R, Quiles-Perez R, Menissier-de MJ, de MG, Ruiz de AM et al.. Interaction between ATM and PARP-1 in response to DNA damage and sensitization of ATM deficient cells through PARP inhibition. BMC Mol Biol 2007; 8:29; PMID:17459151; http://dx.doi.org/ 10.1186/1471-2199-8-29 [DOI] [PMC free article] [PubMed] [Google Scholar]
- 15.Weston VJ, Oldreive CE, Skowronska A, Oscier DG, Pratt G, Dyer MJ, Smith G, Powell JE, Rudzki Z, Kearns P et al.. The PARP inhibitor olaparib induces significant killing of ATM-deficient lymphoid tumor cells in vitro and in vivo. Blood 2010; 116:4578-87; PMID:20739657; http://dx.doi.org/ 10.1182/blood-2010-01-265769 [DOI] [PubMed] [Google Scholar]
- 16.Williamson CT, Muzik H, Turhan AG, Zamo A, O'Connor MJ, Bebb DG, Lees-Miller SP. ATM deficiency sensitizes mantle cell lymphoma cells to poly(ADP-ribose) polymerase-1 inhibitors. Mol Cancer Ther 2010; 9:347-57; PMID:20124459; http://dx.doi.org/ 10.1158/1535-7163.MCT-09-0872 [DOI] [PMC free article] [PubMed] [Google Scholar]
- 17.Golla RM, Li M, Shen Y, Ji M, Yan Y, Fu K, Greiner TC, McKeithan TW, Chan WC. Inhibition of poly(ADP-ribose) polymerase (PARP) and ataxia telangiectasia mutated (ATM) on the chemosensitivity of mantle cell lymphoma to agents that induce DNA strand breaks. Hematol Oncol 2011; 30:175–179; PMID:22170260; http://dx.doi.org/ 10.1002/hon.1020 [DOI] [PubMed] [Google Scholar]
- 18.Williamson CT, Kubota E, Hamill JD, Klimowicz A, Ye R, Muzik H, Dean M, Tu L, Gilley D, Magliocco AM et al.. Enhanced cytotoxicity of PARP inhibition in mantle cell lymphoma harbouring mutations in both ATM and p53. EMBO Mol Med 2012; 4(6):515-27; PMID:22416035 n/a [DOI] [PMC free article] [PubMed] [Google Scholar]
- 19.Schreiber V, Dantzer F, Ame JC, de Murcia G. Poly(ADP-ribose): novel functions for an old molecule. Nat Rev Mol Cell Biol 2006; 7:517-28; PMID:16829982; http://dx.doi.org/ 10.1038/nrm1963 [DOI] [PubMed] [Google Scholar]
- 20.Yelamos J, Schreiber V, Dantzer F. Toward specific functions of poly(ADP-ribose) polymerase-2. Trends Mol Med 2008; 14:169-78; PMID:18353725; http://dx.doi.org/ 10.1016/j.molmed.2008.02.003 [DOI] [PubMed] [Google Scholar]
- 21.Adamietz P. Poly(ADP-ribose) synthase is the major endogenous nonhistone acceptor for poly(ADP-ribose) in alkylated rat hepatoma cells. Eur J Biochem 1987; 169:365-72; PMID:3121314; http://dx.doi.org/ 10.1111/j.1432-1033.1987.tb13621.x [DOI] [PubMed] [Google Scholar]
- 22.Mendoza-Alvarez H, Alvarez-Gonzalez R. Regulation of p53 sequence-specific DNA-binding by covalent poly(ADP-ribosyl)ation. J Biol Chem 2001; 276:36425-30; PMID:11477085; http://dx.doi.org/ 10.1074/jbc.M105215200 [DOI] [PubMed] [Google Scholar]
- 23.D'Amours D, Desnoyers S, D'Silva I, Poirier GG. Poly(ADP-ribosyl)ation reactions in the regulation of nuclear functions. Biochem J 1999; 342 (Pt 2):249-68; PMID:10455009; http://dx.doi.org/ 10.1042/bj3420249 [DOI] [PMC free article] [PubMed] [Google Scholar]
- 24.Ferro AM, Olivera BM. Poly(ADP-ribosylation) in vitro. Reaction parameters and enzyme mechanism. J Biol Chem 1982; 257:7808-13; PMID:6282854 [PubMed] [Google Scholar]
- 25.Murai J, Huang SY, Das BB, Renaud A, Zhang Y, Doroshow JH, Ji J, Takeda S, Pommier Y. Trapping of PARP1 and PARP2 by Clinical PARP Inhibitors. Cancer Res 2012; 72:5588-99; PMID:23118055; http://dx.doi.org/ 10.1158/0008-5472.CAN-12-2753 [DOI] [PMC free article] [PubMed] [Google Scholar]
- 26.Ström CE, Johansson F, Uhl+¬n M, Szigyarto CA-K, Erixon G, Helleday T. Poly (ADP-ribose) polymerase (PARP) is not involved in base excision repair but PARP inhibition traps a single-strand intermediate. Nucleic Acids Res 2011; 39:3166-75; PMID:21183466; http://dx.doi.org/ 10.1093/nar/gkq1241 [DOI] [PMC free article] [PubMed] [Google Scholar]
- 27.Gottipati P, Vischioni B, Schultz N, Solomons J, Bryant HE, Djureinovic T, Issaeva N, Sleeth K, Sharma RA, Helleday T. Poly(ADP-ribose) polymerase is hyperactivated in homologous recombination-defective cells. Cancer Res 2010; 70:5389-98; PMID:20551068; http://dx.doi.org/ 10.1158/0008-5472.CAN-09-4716 [DOI] [PubMed] [Google Scholar]
- 28.Lord CJ, McDonald S, Swift S, Turner NC, Ashworth A. A high-throughput RNA interference screen for DNA repair determinants of PARP inhibitor sensitivity. DNA Repair (Amst) 2008; 7:2010-9; PMID:18832051; http://dx.doi.org/ 10.1016/j.dnarep.2008.08.014 [DOI] [PubMed] [Google Scholar]
- 29.Turner NC, Lord CJ, Iorns E, Brough R, Swift S, Elliott R, Rayter S, Tutt AN, Ashworth A. A synthetic lethal siRNA screen identifying genes mediating sensitivity to a PARP inhibitor. EMBO J 2008; 27:1368-77; PMID:18388863; http://dx.doi.org/ 10.1038/emboj.2008.61 [DOI] [PMC free article] [PubMed] [Google Scholar]
- 30.Daemen A, Wolf D, Korkola J, Griffith O, Frankum J, Brough R, Jakkula L, Wang N, Natrajan R, Reis-Filho J et al.. Cross-platform pathway-based analysis identifies markers of response to the PARP inhibitor olaparib. Breast Cancer Res Treat 2012; 135:505-517; PMID:22875744; http://dx.doi.org/ 10.1007/s10549-012-2188-0 [DOI] [PMC free article] [PubMed] [Google Scholar]
- 31.Ying S, Hamdy FC, Helleday T. Mre11-dependent degradation of stalled DNA replication forks is prevented by BRCA2 and PARP1. Cancer Research 2012; 72(11):2814-21; PMID:22447567 [DOI] [PubMed] [Google Scholar]
- 32.Vilar E, Bartnik CM, Stenzel SL, Raskin L, Ahn J, Moreno V, Mukherjee B, Iniesta MD, Morgan MA, Rennert G et al.. MRE11 deficiency increases sensitivity to poly(ADP-ribose) polymerase inhibition in microsatellite unstable colorectal cancers. Cancer Res 2011; 71:2632-42; PMID:21300766; http://dx.doi.org/ 10.1158/0008-5472.CAN-10-1120 [DOI] [PMC free article] [PubMed] [Google Scholar]
- 33.Kim JS, Krasieva TB, Kurumizaka H, Chen DJ, Taylor AM, Yokomori K. Independent and sequential recruitment of NHEJ and HR factors to DNA damage sites in mammalian cells. J Cell Biol 2005; 170:341-7; PMID:16061690; http://dx.doi.org/ 10.1083/jcb.200411083 [DOI] [PMC free article] [PubMed] [Google Scholar]
- 34.Xie A, Kwok A, Scully R. Role of mammalian Mre11 in classical and alternative nonhomologous end joining. Nat Struct Mol Biol 2009; 16:814-8; PMID:19633669; http://dx.doi.org/ 10.1038/nsmb.1640 [DOI] [PMC free article] [PubMed] [Google Scholar]
- 35.Helmink BA, Bredemeyer AL, Lee BS, Huang CY, Sharma GG, Walker LM, Bednarski JJ, Lee WL, Pandita TK, Bassing CH et al.. MRN complex function in the repair of chromosomal Rag-mediated DNA double-strand breaks. J Exp Med 2009; 206:669-79; PMID:19221393; http://dx.doi.org/ 10.1084/jem.20081326 [DOI] [PMC free article] [PubMed] [Google Scholar]
- 36.Rass E, Grabarz A, Plo I, Gautier J, Bertrand P, Lopez BS. Role of Mre11 in chromosomal nonhomologous end joining in mammalian cells. Nat Struct Mol Biol 2009; 16:819-24; PMID:19633668; http://dx.doi.org/ 10.1038/nsmb.1641 [DOI] [PubMed] [Google Scholar]
- 37.Audeh MW, Carmichael J, Penson RT, Friedlander M, Powell B, Bell-McGuinn KM, Scott C, Weitzel JN, Oaknin A, Loman N et al.. Oral poly(ADP-ribose) polymerase inhibitor olaparib in patients with BRCA1 or BRCA2 mutations and recurrent ovarian cancer: a proof-of-concept trial. Lancet 2010; 376:245-51; PMID:20609468; http://dx.doi.org/ 10.1016/S0140-6736(10)60893-8 [DOI] [PubMed] [Google Scholar]
- 38.Fong PC, Yap TA, Boss DS, Carden CP, Mergui-Roelvink M, Gourley C, De GJ, Lubinski J, Shanley S, Messiou C et al.. Poly(ADP)-ribose polymerase inhibition: frequent durable responses in BRCA carrier ovarian cancer correlating with platinum-free interval. J Clin Oncol 2010; 28:2512-9; PMID:20406929; http://dx.doi.org/ 10.1200/JCO.2009.26.9589 [DOI] [PubMed] [Google Scholar]
- 39.Tutt A, Robson M, Garber JE, Domchek SM, Audeh MW, Weitzel JN, Friedlander M, Arun B, Loman N, Schmutzler RK et al.. Oral poly(ADP-ribose) polymerase inhibitor olaparib in patients with BRCA1 or BRCA2 mutations and advanced breast cancer: a proof-of-concept trial. Lancet 2010; 376:235-44; PMID:20609467; http://dx.doi.org/ 10.1016/S0140-6736(10)60892-6 [DOI] [PubMed] [Google Scholar]
- 40.Khalil A, Morgan RN, Adams BR, Golding SE, Dever SM, Rosenberg E, Povirk LF, Valerie K. ATM-dependent ERK signaling via AKT in response to DNA double-strand breaks. Cell Cycle 2011; 10:481-91; PMID:21263216; http://dx.doi.org/ 10.4161/cc.10.3.14713 [DOI] [PMC free article] [PubMed] [Google Scholar]
- 41.Viniegra JG, Martinez N, Modirassari P, Hernandez LJ, Parada CC, Sanchez-Arevalo Lobo VJ, Aceves Luquero CI, Alvarez-Vallina L, Cajal S, Rojas JM et al.. Full activation of PKB/Akt in response to insulin or ionizing radiation is mediated through ATM. J Biol Chem 2005; 280:4029-36; PMID:15546863; http://dx.doi.org/ 10.1074/jbc.M410344200 [DOI] [PubMed] [Google Scholar]
- 42.Landsverk KS, Patzke S, Rein ID, Stokke C, Lyng H, De Angelis PM, Stokke T. Three independent mechanisms for arrest in G2 after ionizing radiation. Cell Cycle 2011; 10:819-29; PMID:21325885; http://dx.doi.org/ 10.4161/cc.10.5.14968 [DOI] [PubMed] [Google Scholar]
- 43.Landsverk KS, Lyng H, Stokke T. The response of malignant B lymphocytes to ionizing radiation: cell cycle arrest, apoptosis and protection against the cytotoxic effects of the mitotic inhibitor nocodazole. Radiat Res 2004; 162:405-15; PMID:15447042; http://dx.doi.org/ 10.1667/RR3235 [DOI] [PubMed] [Google Scholar]
- 44.Celton-Morizur S, Desdouets C. Polyploidization of liver cells. Adv Exp Med Biol 2010; 676:123-35; PMID:20687473; http://dx.doi.org/ 10.1007/978-1-4419-6199-0_8 [DOI] [PubMed] [Google Scholar]
- 45.Davaadelger B, Shen H, Maki CG. Novel roles for p53 in the genesis and targeting of tetraploid cancer cells. [DOI] [PMC free article] [PubMed] [Google Scholar]
- 46.Tucker CA, Bebb G, Klasa RJ, Chhanabhai M, Lestou V, Horsman DE, Gascoyne RD, Wiestner A, Masin D, Bally M et al.. Four human t(11;14)(q13;q32)-containing cell lines having classic and variant features of Mantle Cell Lymphoma. Leukemia Research 2006; 30:449-57; PMID:16183118; http://dx.doi.org/ 10.1016/j.leukres.2005.08.016 [DOI] [PubMed] [Google Scholar]
- 47.Bosco R, Rabusin M, Voltan R, Celeghini C, Corallini F, Capitani S, Secchiero P. Anti-leukemic activity of Dasatinib in both p53-wild-type and p53-mutated B malignant cells. Investigational New Drugs 2012; 30:417-22; PMID:20953816; http://dx.doi.org/ 10.1007/s10637-010-9564-6 [DOI] [PubMed] [Google Scholar]
- 48.Huang X, Halicka HD, Traganos F, Tanaka T, Kurose A, Darzynkiewicz Z. Cytometric assessment of DNA damage in relation to cell cycle phase and apoptosis. Cell Prolif 2005; 38:223-43; PMID:16098182; http://dx.doi.org/ 10.1111/j.1365-2184.2005.00344.x [DOI] [PMC free article] [PubMed] [Google Scholar]
- 49.Lobrich M, Shibata A, Beucher A, Fisher A, Ensminger M, Goodarzi AA, Barton O, Jeggo PA. gammaH2AX foci analysis for monitoring DNA double-strand break repair: strengths, limitations and optimization. Cell Cycle 2010; 9:662-9; PMID:20139725; http://dx.doi.org/ 10.4161/cc.9.4.10764 [DOI] [PubMed] [Google Scholar]
- 50.Rothkamm K, Lobrich M. Evidence for a lack of DNA double-strand break repair in human cells exposed to very low x-ray doses. Proc Natl Acad Sci U S A 2003; 100:5057-62; PMID:12679524; http://dx.doi.org/ 10.1073/pnas.0830918100 [DOI] [PMC free article] [PubMed] [Google Scholar]
- 51.Kocher S, Rieckmann T, Rohaly G, Mansour WY, Dikomey E, Dornreiter I, Dahm-Daphi J. Radiation-induced double-strand breaks require ATM but not Artemis for homologous recombination during S-phase. Nucleic Acids Res 2012; 40:8336–8347; http://dx.doi.org/ 10.1093/nar/gks604 [DOI] [PMC free article] [PubMed] [Google Scholar]
- 52.Min A, Im SA, Yoon YK, Song SH, Nam HJ, Hur HS, Kim HP, Lee KH, Han SW, Oh DY, Kim T-Y et al.. RAD51C-deficient cancer cells are highly sensitive to the PARP inhibitor olaparib. Mol Cancer Ther 2013 Jun; 12(6):865-77; PMID:23512992 [DOI] [PubMed] [Google Scholar]
- 53.Orta ML, Calderon-Montano JM, Dominguez I, Pastor N, Burgos-Moron E, Lopez-Lazaro M, Cortes F, Mateos S, Helleday T. 5-Aza-2′-deoxycytidine causes replication lesions that require Fanconi anemia-dependent homologous recombination for repair. Nucleic Acids Res 2013; 41:5827-36; PMID:23609537; http://dx.doi.org/ 10.1093/nar/gkt270 [DOI] [PMC free article] [PubMed] [Google Scholar]
- 54.Rosenfeld C, Goutner A, Venuat AM, Choquet C, Pico JL, Dore JF, Liabeuf A, Durandy A, Desgrange C, De The G. An effective human leukaemic cell line: Reh. European Journal of Cancer (1965) 2004; 13:377-9; http://dx.doi.org/ 10.1016/0014-2964(77)90085-8 [DOI] [PubMed] [Google Scholar]
- 55.Nilsson K. ; Various observations concerning evaluation and grading. Tidskr Sjukvardspedagog 1974; 21:111; PMID:4499679 [PubMed] [Google Scholar]
- 56.Lyng H, Landsverk KS, Kristiansen E, DeAngelis PM, Ree AH, Myklebost O, Hovig E, Stokke T. Response of malignant B lymphocytes to ionizing radiation: gene expression and genotype. Int J Cancer 2005; 115:935-42; PMID:15723354; http://dx.doi.org/ 10.1002/ijc.20962 [DOI] [PubMed] [Google Scholar]
- 57.Melo JV, Foroni L, Brito-Babapulle V, Luzzatto L, Catovsky D. The establishment of cell lines from chronic B cell leukaemias: evidence of leukaemic origin by karyotypic abnormalities and Ig gene rearrangement. Clin Exp Immunol 1988; 73:23-28; PMID:3262465 [PMC free article] [PubMed] [Google Scholar]
- 58.Ruchlemer R, Parry-Jones N, Brito-Babapulle V, Attolico I, Wotherspoon AC, Matutes E, Catovsky D. B-prolymphocytic leukaemia with t(11;14) revisited: a splenomegalic form of mantle cell lymphoma evolving with leukaemia. Br J Haematol 2004; 125:330-6; PMID:15086413; http://dx.doi.org/ 10.1111/j.1365-2141.2004.04913.x [DOI] [PubMed] [Google Scholar]
- 59.Jadayel DM, Lukas J, Nacheva E, Bartkova J, Stranks G, De Schouwer PJ, Lens D, Bartek J, Dyer MJ, Kruger AR et al.. Potential role for concurrent abnormalities of the cyclin D1, p16CDKN2 and p15CDKN2B genes in certain B cell non-Hodgkin's lymphomas. Functional studies in a cell line (Granta 519). Leukemia 1997; 11:64-72; PMID:9001420; http://dx.doi.org/ 10.1038/sj.leu.2400555 [DOI] [PubMed] [Google Scholar]
- 60.Rudolph C, Steinemann D, Von NN, Gadzicki D, Ripperger T, Drexler HG, Mrasek K, Liehr T, Claussen U, Emura M et al.. Molecular cytogenetic characterization of the mantle cell lymphoma cell line GRANTA-519. Cancer Genet Cytogenet 2004; 153:144-50; PMID:15350304; http://dx.doi.org/ 10.1016/j.cancergencyto.2004.01.006 [DOI] [PubMed] [Google Scholar]
- 61.Vorechovsky I, Luo L, Dyer MJS, Catovsky D, Amlot PL, Yaxley JC, Foroni L, Hammarstrom L, Webster AD, Yuille MAR. Clustering of missense mutations in the ataxia-telanglectasia gene in a sporadic T-cell leukaemia. Nat Genet 1997; 17:96-9; PMID:9288106; http://dx.doi.org/ 10.1038/ng0997-96 [DOI] [PubMed] [Google Scholar]
- 62.Menear KA, Adcock C, Boulter R, Cockcroft Xl, Copsey L, Cranston A, Dillon KJ, Drzewiecki J, Garman S, Gomez S et al.. 4-; 3-(4-Cyclopropanecarbonylpiperazine-1-carbonyl)-4-fluorobenzyl-2H-phthalazin-1-one: A Novel Bioavailable Inhibitor of Poly(ADP-ribose) Polymerase-1. J Med Chem 2008; 51:6581-91; PMID:18800822; http://dx.doi.org/ 10.1021/jm8001263 [DOI] [PubMed] [Google Scholar]
- 63.Hickson I, Zhao Y, Richardson CJ, Green SJ, Martin NM, Orr AI, Reaper PM, Jackson SP, Curtin NJ, Smith GC. Identification and characterization of a novel and specific inhibitor of the ataxia-telangiectasia mutated kinase ATM. Cancer Res 2004; 64:9152-9; PMID:15604286; http://dx.doi.org/ 10.1158/0008-5472.CAN-04-2727 [DOI] [PubMed] [Google Scholar]
- 64.Dean E, Middleton MR, Pwint T, Swaisland H, Carmichael J, Goodege-Kunwar P, Ranson M. Phase I study to assess the safety and tolerability of olaparib in combination with bevacizumab in patients with advanced solid tumours. Br J Cancer 2012; 106(3):468-74; PMID:22223088 [DOI] [PMC free article] [PubMed] [Google Scholar]
- 65.Galteland E, Holte H, Stokke T. c-MYC, RB-1, TP53, and centromere 8 and 17 copy number in B-cell non-Hodgkin's lymphomas assessed by dual-color fluorescence in situ hybridization. Cytometry 1999; 38:53-60; PMID:10323217; http://dx.doi.org/ 10.1002/(SICI)1097-0320(19990415)38:2%3c53::AID-CYTO2%3e3.0.CO;2-0 [DOI] [PubMed] [Google Scholar]
Associated Data
This section collects any data citations, data availability statements, or supplementary materials included in this article.