Abstract
Modern magnetic resonance imaging (MRI) brain atlases are high quality 3-D volumes with specific structures labeled in the volume. Atlases are essential in providing a common space for interpretation of results across studies, for anatomical education, and providing quantitative image-based navigation. Extensive work has been devoted to atlas construction for humans, macaque, and several non-primate species (e.g., rat). One notable gap in the literature is the common squirrel monkey – for which the primary published atlases date from the 1960’s. The common squirrel monkey has been used extensively as surrogate for humans in biomedical studies, given its anatomical neuro-system similarities and practical considerations. This work describes the continued development of a multi-modal MRI atlas for the common squirrel monkey, for which a structural imaging space and gray matter parcels have been previously constructed. This study adds white matter tracts to the atlas. The new atlas includes 49 white matter (WM) tracts, defined using diffusion tensor imaging (DTI) in three animals and combines these data to define the anatomical locations of these tracks in a standardized coordinate system compatible with previous development. An anatomist reviewed the resulting tracts and the inter-animal reproducibility (i.e., the Dice index of each WM parcel across animals in common space) was assessed. The Dice indices range from 0.05 to 0.80 due to differences of local registration quality and the variation of WM tract position across individuals. However, the combined WM labels from the 3 animals represent the general locations of WM parcels, adding basic connectivity information to the atlas.
Keywords: squirrel monkey, neuroanatomy, brain atlas, white matter atlas, magnetic resonance imaging, diffusion tensor imaging, tractography
1. INTRODUCTION
Brain atlases are essentially brain anatomies with specific structures labeled in two or three dimensions. With the development of medical imaging technology, magnetic resonance imaging (MRI) brain atlases in three dimensions (3D) have become power tools for neuroscience research [1]. For example, 3D MRI atlases provide a common space for analysis or interpretation of data across studies, the display of 3D brain anatomy for education purposes, and navigation in brain surgery. Extensive work has been devoted to atlas construction for humans, macaque, and several non-primate species (e.g., rats). One notable gap in the literature is the New World (common) squirrel monkey.
The New World squirrel monkey has been used for decades in biomedical research as surrogates for humans and as models for studies of human diseases [2]. Especially in the discipline of neuroscience, the squirrel monkey is thought to be a desirable model because it shares many features of functional organization and microstructural complexity of nervous system with humans and also because it requires less effort to train and handle (e.g., the small size of the squirrel monkey is ideally suited to the narrow bore of an ultra-high filed MRI scanner [3] and requires less histological processing time [4–6]). Published stereotaxic atlases [7, 8] of the squirrel monkey provide labeled cortical structures and white matter regions on 2D photographs of histological sections. Notably, the boundaries of different structures are not labeled and these atlases only cover the middle half of brain, neglecting the prefrontal and occipital lobes. Moreover, the atlases were not readily navigable in 3D, so linkage with modern neuroimaging modalities and visualization techniques is limited.
Recently, a 3D multi-modal MRI atlas of squirrel monkey brain was proposed in [9]. That work defined a common space to best match the printed atlases, created a multi-modal (i.e., anatomical, fractional anisotropy and mean diffusivity) template and delineated several cortical regions based on histological identification. However, the dataset used in the previous study was only from one monkey. To get a more general atlas representing variations of brain anatomy across individuals, we develop a semi-automated iterative process for atlas construction and then build up the brain templates based on datasets from more than seven monkeys. More importantly, white matter (WM) atlases are still not available for the squirrel monkey. Inspired by construction of WM atlases for humans [10] and macaques [11], herein we develop a high resolution 3D WM atlas of the squirrel monkey in the existing common space defined in [9], based on diffusion tenser imaging and tractography.
2. DATA
The squirrel monkey brain MRI data used for atlas construction were acquired in several long-term projects with different ultimate goals. Briefly, all data were collected in a 9.4T, 21 cm bore Agilent scanner. During the in vivo session, the live monkey was anaesthetized and its head immobilized. During the ex vivo session, the brain, fixed with 4% paraformaldehyde, was placed in phosphate buffered saline in a cylindrical tube for scanning. The scan parameters are listed in Table 1.
Table 1.
List of parameters used in MRI scanning protocols (GEMS: gradient-echo multi-slice; GE3D: gradient echo 3D; SEMSDW: spin-echo multi-slice with diffusion weighting).
| Modality <sequence> |
Number of monkeys |
Scanning parameters | |
|---|---|---|---|
| In vivo | anatomical <GE3D> |
8 | TR=5ms, TE=2.4ms, voxel size=500×500×500µm3, data matrix=128×128×128, flip angle=20° |
| anatomical <GEMS> |
4 | TR=600ms, TE=16ms, voxel size=250×250×1000µm3, data matrix=256×256×24, flip angle=45° |
|
| 3 | TR=404ms, TE=2.4ms, voxel size=630×630×630µm3, data matrix=128×128×80, flip angle=20° |
||
| Ex vivo | DWI <SEMSDW> |
3 | TR=4.6s, TE=42ms, voxel size=300×300×300µm3, data matrix=192×128×115, b=0, 1000s/mm2, number of diffusion gradient directions=30, number of scans>=5, overall scan time=50h |
3. BRAIN TEMPLATE CONSTRUCTION
Two squirrel monkey brain templates were built in this study. One was based on eight monkeys’ in vivo anatomical images acquired with a 3D gradient-echo sequence. The other one was based on seven monkeys’ in vivo anatomical images acquired with 2D gradient-echo multi-slice sequence. The acquisition parameters were listed in Table 1. Image preprocessing included normalizing the image intensity (from the 5th to 95th percentiles), applying a de-noising mask and correcting non-uniform intensity using N4 bias field correction [12].
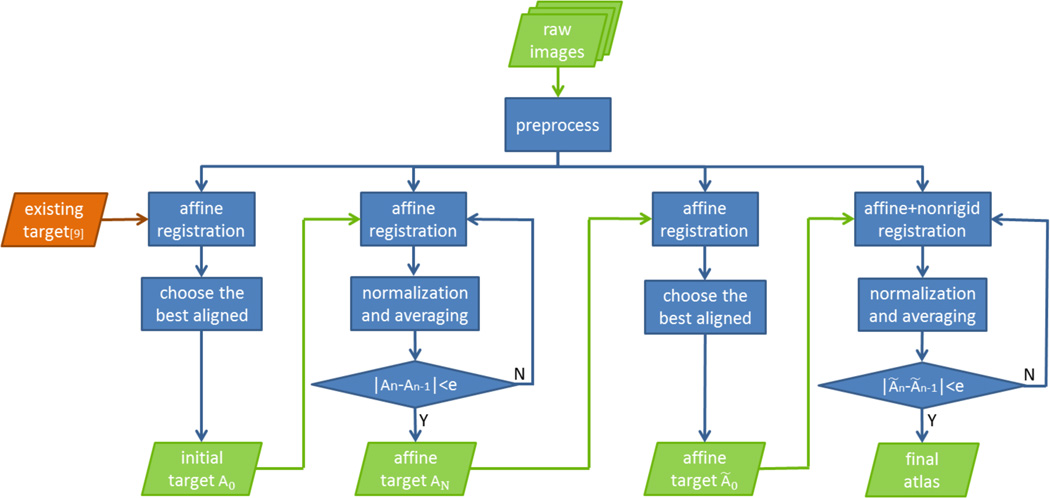
For each template, the corresponding preprocessed images were registered rigidly to an existing anatomical template created in the atlas’ common space [9] using FSL FLIRT [13] with 7 degrees of freedom (DOF) and one of the best aligned images was selected as an initial target. All images were then affine registered to this target using NIFTYReg reg_aladin [14] and an average affine target was computed. Before computing an average, histogram normalization was performed on all images and compared with the normal average of the images. Based on the results, the corresponding method was used in subsequent iterations in computing an average. This average was used as the target for the next iteration and this process was repeated until convergence, producing a final affine target. Figure 1 shows the workflow described above.
Figure 1.
Flowchart of iterative algorithm to construct anatomical atlas.
The final affine target was used as the initial target for non-rigid registration. Each image was again rigidly registered to the target with 7 DOF. One of the best aligned images was used as the initial target to start the non-rigid registration. All images were registered using ANTS registration tools [15] and then averaged after applying the histogram normalization as needed. This average was used as the target for the next iteration and this process was repeated until convergence, producing the final template of the brain.
4. WHITE MATTER ATLAS CONSTRUCTION
The white matter (WM) atlas was developed based on three monkeys’ ex vivo diffusion weighted images (DWI) listed in Table 1. The image preprocessing for each monkey included averaging raw DWI data across scans, normalizing intensity and extracting brain tissue from background water (PBS) signal using a homemade script.
4.1 White matter reconstruction
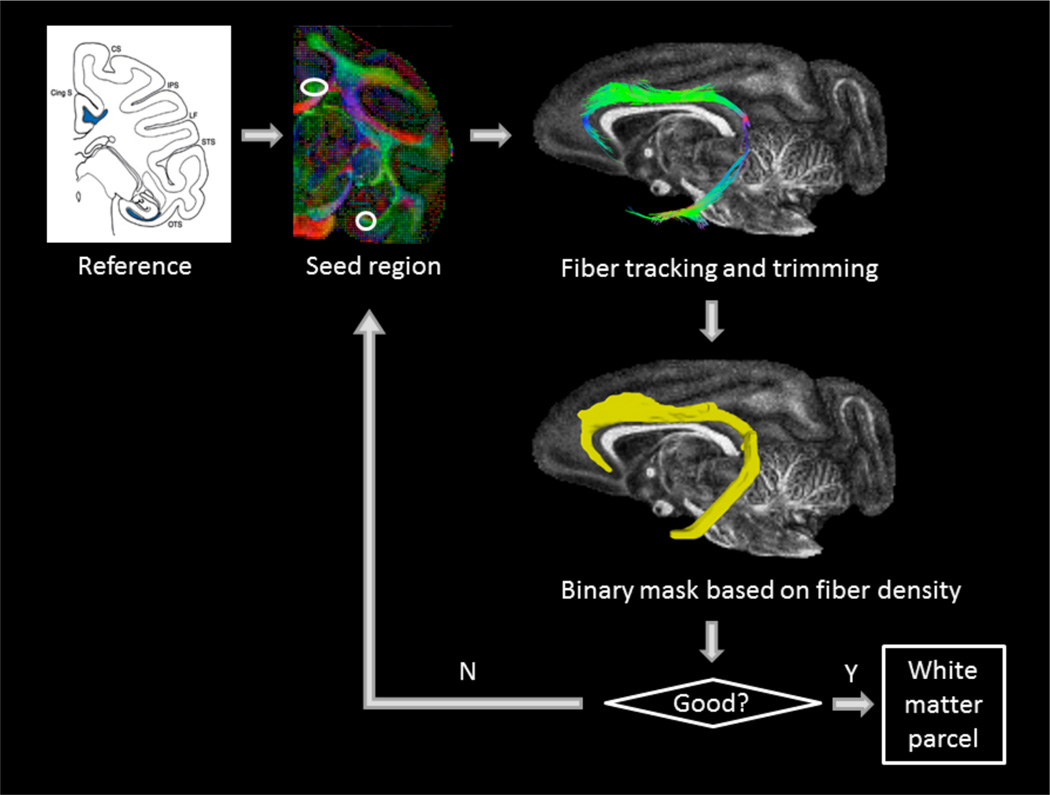
In this step, each brain was processed in its native space. Tensor estimation, seed region selection, deterministic fiber tractography, and fiber tract trimming were performed in DSIStudio (http://dsi-studio.labsolver.org) [16]. Since the WM anatomy of the squirrel monkey is similar to that of the macaque, we used WM regions revealed by histological tracer pathways of the macaque brain [17] as a reference to seed fiber tracking and to refine the tracts (i.e., select, delete and cut) by editing ROIs. The tracking parameters, primarily including termination FA threshold, termination angle threshold, step size and smoothing size, were manually tuned according to the characteristics of each WM bundle. Each WM bundle was tracked, edited and stored as a single 3D fiber density map through DSIStudio. Then the density map was thresholded by custom MATLAB scripts, yielding a binary mask. The binary mask could be used as a new seed region to repeat the above process iteratively until the quality was acceptable (see Figure 2). The criteria of “good” quality include correctness of 1) the coarse shape and orientation of the WM bundle; 2) the gray matter structures or ventricles next to the WM bundle along the entire pathway and 3) the cortical regions connected by the WM bundle.
Figure 2.
The pipeline for iterative definition of one bundle – the left cingulum in native space of one monkey. The ‘reference’ is taken from [17].
Based on WM labels in the squirrel monkey’s printed atlases [8, 18] and the WM pathways traced in the macaque’s brain [11, 17], 49 distinguishable white matter parcels were identified (including structures with left and right components) for each monkey. Their abbreviations, definitions, primary orientations, seed regions and ROIs for refining tracts are listed in Table 2.
Table 2.
List of abbreviation, definition, primary orientation, seed region (S.R.) and constrained ROI of each white matter parcel. (Note: A.: anterior; P.: posterior; L.: left; R.: right; S.: superior; I: inferior, Fasc.: fasciculus)
| Abbr. | Definition | Primary Orientation; seed region (S.R.) and other ROIs |
|---|---|---|
| SLF I | Superior Longitudinal Fasc. I | A-P; S.R. = most dorsal region with A-P fibers in frontal lobe |
| SLF II | Superior Longitudinal Fasc. II | A-P; S.R. = lateral region with A-P fibers in frontal lobe |
| SLF III | Superior Longitudinal Fasc. III | A-P; S.R. = most ventral region with A-P fibers in frontal lobe |
| MLF | Middle Longitudinal Fasc. | A-P; S.R. = ventral region with A-P fibers in superior temporal lobe |
| ILF | Inferior Longitudinal Fasc. | A-P; S.R. = ventral region with A-P fibers in inferior temporal lobe |
| IFOF | Inferior Fronto-Occipital Fasc. | A-P; S.R. = entire white matter region of one coronal slice in occipital lobe; terminating region = prefrontal area |
| UF | Uncinate Fasc. | A-P; S.R. = ventral region with A-P fibers in inferior temporal lobe |
| Cing | Cingulum | A-P; S.R. = region between cingulate and corpus callosum with A-P fibers |
| F | Fornix | A-P; S.R. = region underneath corpus callosum with A-P fibers |
| ICa | Internal Capsule -anterior limb |
S-I/A-P; S.R. = anterior limb of internal capsule with A-P fibers |
| ICg | Internal Capsule-genu | S-I; S.R. = genu limb of internal capsule with S-I fibers |
| ICr | Internal Capsule -retrolenticular limb |
A-P; S.R. = retrolenticular limb internal capsule with A-P fibers |
| CRa | Coronal Radiata-anterior | A-P; S.R. = ICa; terminating region = prefrontal lobe; |
| CRs | Coronal Radiata-superior | S-I; S.R. = ICg; terminating region = frontal lobe |
| CRdp | Coronal Radiata -dorsal posterior |
S-I; S.R. = ICg; terminating region = parietal lobe |
| CRp | Coronal Radiata-posterior | A-P; S.R. = ICr; terminating region = occipital lobe |
| CCg | Corpus callosum-genu | L-R; S.R. = the middle sagittal slice of corpus callosum with L-R fibers; terminating ROI = prefrontal lobe |
| CCb | Corpus callosum-body | L-R; S.R. = the middle sagittal slice of corpus callosum with L-R fibers; terminating ROI = frontal and parietal lobe |
| CCs | Corpus callosum-splenium | L-R; S.R. = the middle sagittal slice of corpus callosum with L-R fibers; terminating ROI = occipital lobe |
| FMn | Forceps Minor | A-P; S.R. = CCa; terminating lobe = prefrontal lobe |
| FCCb | Fiber extension of CCb | S-I and L-R; S.R. = CCb; terminating ROI = frontal and parietal lobe |
| FMj | Forceps Major | A-P; S.R. = CCs; terminating ROI = occipital lobe |
| AC | Anterior Commissure | L-R; S.R. = middle sagittal slice of AC with L-R fibers running |
| PC | Posterior Commissure | L-R; S.R. = middle sagittal slice of PC with L-R fibers running |
| IIT | Optic tract | A-P; S.R. = optic chiasm with L-R fibers in frontal lobe |
| EC | External and Extreme Capsule | A-P; S.R. = region lateral to lentiform nucleus with A-P fibers |
4.2 Registration and normalization
The anatomical brain template created in section 3 was used as a target to perform registration of the WM parcels. Each monkey’s non-diffusion weighted volume was registered to the target through affine with 12 DOF followed by non-rigid registration [5, 19] and the deformation field was generated. Then, the binary mask of each WM parcel was transformed into the common space by applying the deformation field. The mask of each specific common white matter parcel was calculated by voting the majority of transformed binary masks across the three monkeys.
4.3 Validation
The created WM parcels for the first monkey in its native space were reviewed by a neuroanatomist with expertise in squirrel monkey brain anatomy. To quantitatively measure the agreement of each WM parcel across the 3 monkeys, the ratio of WM parcels’ overlap of 3 monkeys to the WM parcels’ union of the 3 monkeys was calculated and denoted by Dice index.
5. RESULTS
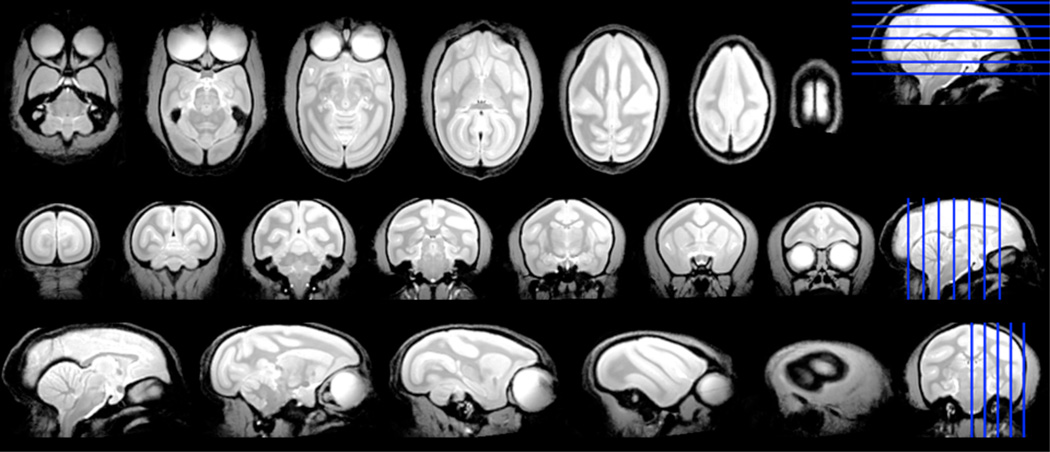
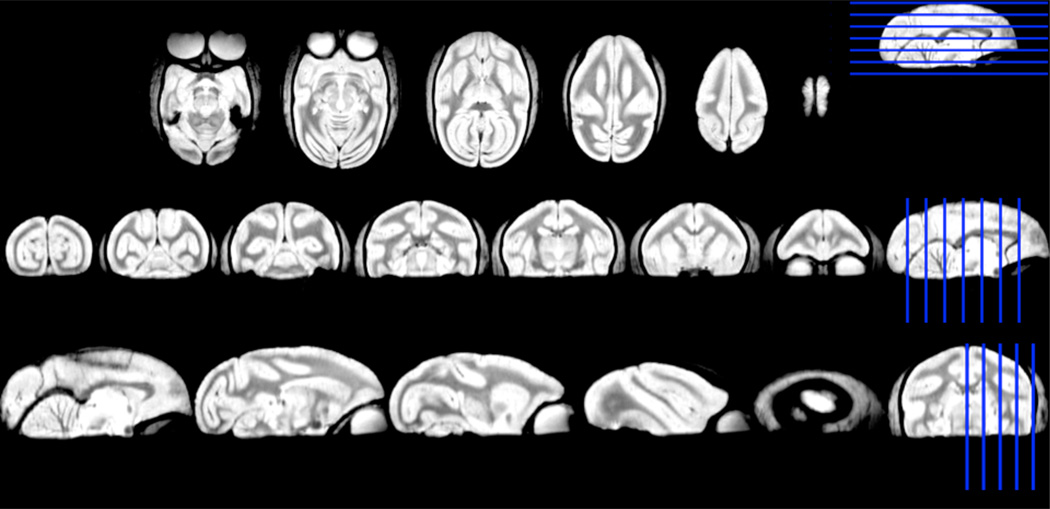
The two high resolution anatomical brain templates are shown in Figure 3 and 4. The common WM parcels are illustrated in Figure 5–10. The dice indices for all the WM parcels are in between 5%–81%.
Figure 3.
Axial, coronal and sagittal sections of anatomical monkey brain atlas with 300×300×300µm3 resolution. The images were acquired by gradient echo 3D sequence. The blue lines indicate the locations of the sections on the left side.
Figure 4.
Axial, coronal and sagittal sections of anatomical monkey brain atlas with 300×300×300µm3 resolution. The images were acquired by gradient echo multi-slice sequence. The blue lines indicate the locations of the sections on the left side.
Figure 5.
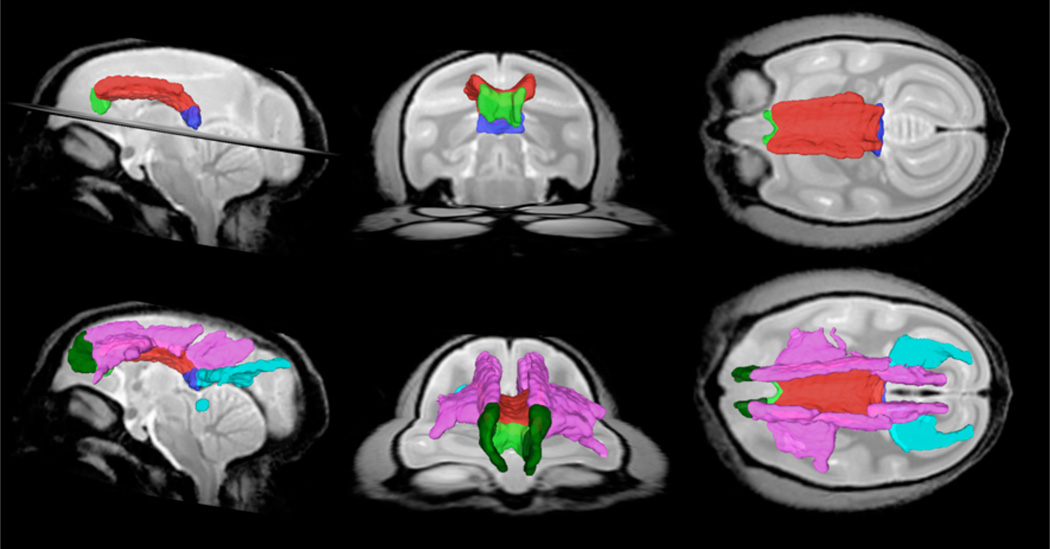
Sagittal, coronal and axial view of white matter parcels CCg (green), CCb (red), CCs (blue), FCCb (pink), FMn (dark green) and FMj (light blue) in the MRI common space.
Figure 10.
Sagittal, coronal and axial view of white matter parcels IFOF (yellow) in the MRI common space.
6. CONCLUSIONS AND DISCUSSIONS
In this study, we developed a more general anatomical brain template based on several monkeys and, more importantly, constructed a 3D white matter atlas of the squirrel monkey compatible with the previously defined common MRI space [1] matching the printed atlas. These atlases could be used for locating WM tracts and further for quantitative analysis related to the 3D position of WM tracts in both teaching and research.
One of the sources for lower Dice indices could be local registration errors. Notably, the registration from ex vivo individual to in vivo brain template is challenging because the brain had significant distortion when put into the cylinder. Another potential source is the variation of the shape as well as the location of the same WM tract across individuals (e.g., uncinate fibers). Thus, further work will include improving the registration procedure and adding data from more monkeys to sample more variations across individuals.
Figure 6.
Sagittal, coronal and axial view of white matter parcels Cing (light blue), F (purple), AC (red) and PC (yellow) in the MRI common space.
Figure 7.
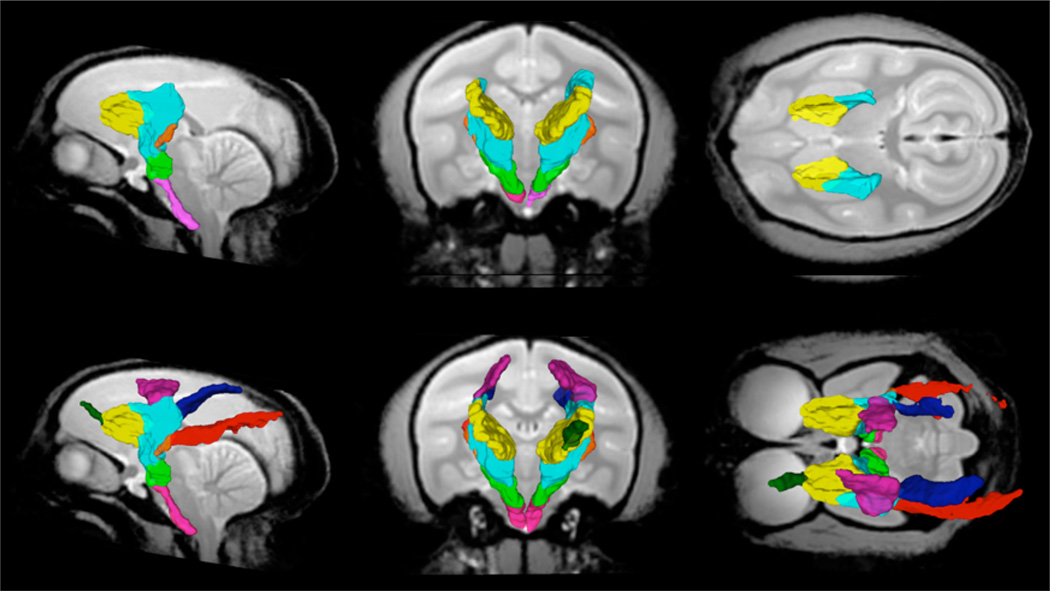
Sagittal, coronal and axial view of white matter parcels ICa (yellow), ICg (light blue), ICp (orange), CP (green). CST (pink), CRa (dark green), CRs (purple), CRdp (dark blue) and CRp (red) in the MRI common space.
Figure 8.
Sagittal, coronal and axial view of white matter parcels SLFI (yellow), SLFII (light blue), SLFIII (red), MLF (blue) and ILF (purple) in the MRI common space.
Figure 9.
Sagittal, coronal and axial view of white matter parcels EC (yellow), UF (red) and IIT (blue) in the MRI common space.
Acknowledgments
This work was supported by R01NS058639, R01NS069909 and R01NS078680. This work was conducted in part using the resources of the Advanced Computing Center for Research and Education at Vanderbilt University, and XNAT[20, 21]. The project was also supported by the National Center for Research Resources, Grant UL1 RR024975-01, and is now at the National Center for Advancing Translational Sciences, Grant 2 UL1 TR000445-06. The content is solely the responsibility of the authors and does not necessarily represent the official views of the NIH.
REFERENCE
- 1.Toga AW, Thompson PM, Mori S, et al. Towards multimodal atlases of the human brain. Nat Rev Neurosci. 2006;7(12):952–966. doi: 10.1038/nrn2012. [DOI] [PMC free article] [PubMed] [Google Scholar]
- 2.Abee CR. The Squirrel Monkey in Biomedical Research. ILAR Journal. 1989;31(1):11–20. [Google Scholar]
- 3.Chen LM, Mishra A, Yang PF, et al. Injury alters intrinsic functional connectivity within the primate spinal cord. Proceedings of the National Academy of Sciences. 2015;112(19):5991–5996. doi: 10.1073/pnas.1424106112. [DOI] [PMC free article] [PubMed] [Google Scholar]
- 4.Gao Y, Choe AS, Stepniewska I, et al. Validation of DTI Tractography-Based Measures of Primary Motor Area Connectivity in the Squirrel Monkey Brain. PloS one. 2013;8(10):e75065. doi: 10.1371/journal.pone.0075065. [DOI] [PMC free article] [PubMed] [Google Scholar]
- 5.Choe A, Gao Y, Li X, et al. Accuracy of image registration between MRI and light microscopy in the ex vivo brain. Magnetic Resonance Imaging. 2011;29(5):683–692. doi: 10.1016/j.mri.2011.02.022. [DOI] [PMC free article] [PubMed] [Google Scholar]
- 6.Schilling K, Janev V, Gao Y, et al. Comparison of 3D orientation distribution functions measured with confocal microscopy and diffusion MRI. Neuroimage. 2016 doi: 10.1016/j.neuroimage.2016.01.022. in press. [DOI] [PMC free article] [PubMed] [Google Scholar]
- 7.Emmers R, Akert K. Stereotaxic Atlas of the Brain of the Squirrel Monkey. University of Wisconsin Press; 1963. [Google Scholar]
- 8.Gergen JA, MacLean PD. A Stereotaxic Atlas of the Squirrel Monkey's Brain (Saimiri sciureus) U.S. Department of Health, Education, and Welfare; 1962. [Google Scholar]
- 9.Gao Y, Khare SP, Panda S, et al. A brain MRI atlas of the common squirrel monkey, Saimiri sciureus. Proceedings of SPIE--the International Society for Optical Engineering. 2014;9038:90380C–90380C. doi: 10.1117/12.2043589. [DOI] [PMC free article] [PubMed] [Google Scholar]
- 10.Wakana S, Jiang H, Nagae-Poetscher LM, et al. Fiber Tract–based Atlas of Human White Matter Anatomy. Radiology. 2004;230(1):77–87. doi: 10.1148/radiol.2301021640. [DOI] [PubMed] [Google Scholar]
- 11.Zakszewski E, Adluru N, Tromp DPM, et al. A Diffusion-Tensor-Based White Matter Atlas for Rhesus Macaques. PLoS ONE. 2014;9(9):e107398. doi: 10.1371/journal.pone.0107398. [DOI] [PMC free article] [PubMed] [Google Scholar]
- 12.Tustison NG, J N4ITK: Nick’s N3 ITK implementation for MRI bias field correction. Insight Journal. 2009 [Google Scholar]
- 13.Jenkinson M, Bannister P, Brady M, et al. Improved optimization for the robust and accurate linear registration and motion correction of brain images. NeuroImage. 2002;17(2):825–841. doi: 10.1016/s1053-8119(02)91132-8. [DOI] [PubMed] [Google Scholar]
- 14.Ourselin S, Roche A, Subsol G, et al. Reconstructing a 3D structure from serial histological sections. Image and Vision Computing. 2001;19(1–2):25–31. [Google Scholar]
- 15.Avants BB, Epstein CL, Grossman M, et al. Symmetric diffeomorphic image registration with crosscorrelation: Evaluating automated labeling of elderly and neurodegenerative brain. Medical Image Analysis. 2008;12(1):26–41. doi: 10.1016/j.media.2007.06.004. [DOI] [PMC free article] [PubMed] [Google Scholar]
- 16.Yeh F-C, Verstynen TD, Wang Y, et al. Deterministic Diffusion Fiber Tracking Improved by Quantitative Anisotropy. PLoS ONE. 2013;8(11):e80713. doi: 10.1371/journal.pone.0080713. [DOI] [PMC free article] [PubMed] [Google Scholar]
- 17.Schmahmann J, Pandya D. Fiber Pathways of the Brain. Oxford University Press; 2009. [Google Scholar]
- 18.Carpenter MB. A stereotaxic atlas of the brain of the squirrel monkey. Archives of Neurology. 1963;9(1):104–104. [Google Scholar]
- 19.Rohde GK, Aldroubi A, Dawant BM. The adaptive bases algorithm for intensity-based nonrigid image registration. IEEE Transactions on Medical Imaging. 2003;22(11):1470–1479. doi: 10.1109/TMI.2003.819299. [DOI] [PubMed] [Google Scholar]
- 20.Gao Y, Burns SS, Lauzon CB, et al. Integration of XNAT/PACS, DICOM, and research software for automated multi-modal image analysis. doi: 10.1117/12.2007621. 8674, 867405-867405-7. [DOI] [PMC free article] [PubMed] [Google Scholar]
- 21.Harrigan RL, Yvernault BC, Boyd BD, et al. Vanderbilt University Institute of Imaging Science Center for Computational Imaging XNAT: A multimodal data archive and processing environment. NeuroImage. 2016;124(Part B):1097–1101. doi: 10.1016/j.neuroimage.2015.05.021. [DOI] [PMC free article] [PubMed] [Google Scholar]


