Abstract
Objective
The existing methods for identifying multiple rare variants underlying complex diseases in family samples are underpowered. Therefore, we aim to develop a new set-based method for an association study of dichotomous traits in family samples.
Methods
We introduce a framework for testing the association of genetic variants with diseases in family samples based on a generalized linear mixed model. Our proposed method is based on a kernel machine regression and can be viewed as an extension of the sequence kernel association test (SKAT and famSKAT) for application to familial data with dichotomous traits (F-SKAT).
Results
Our simulation studies show that the original SKAT has inflated Type I error rate when applied directly to familial data. By contrast, our proposed F-SKAT has the correct Type I error rate. Furthermore, in all of the considered scenarios, F-SKAT, which uses all family data, has higher power than both SKAT, which uses only unrelated individuals from the family data, and another method (abbreviated as IL) which uses all the family data.
Conclusion
We propose a set-based association test that can be used to analyze familial data with dichotomous phenotypes, while handling genetic variants with the same or opposite directions of effects as well as any types of family relationships.
Keywords: Dichotomous traits, Family samples, Generalized linear mixed model, Linear kernel function, Sequence data
Introduction
With recent advances in high-throughput sequencing technology, significant progress has been made in identifying the association between genetic variants and complex diseases [1,2]. Such progress requires appropriate study designs and statistical methods. Genome-wide association studies (GWASs) have been widely used both for identifying common single-nucleotide polymorphisms (SNPs) associated with human diseases and for further understanding the genetic basis of complex diseases [3–7]. In a typical GWAS, hundreds or thousands of individuals are recruited and a large number of genetic markers are genotyped for all of the subjects. The association between the trait and each of the genetic markers is usually tested one by one through single-marker association tests. As a useful complement to the single marker test, gene-based (or, more generally, set-based) tests are becoming more attractive [8–10]. If there are multiple causative variants which have small individual effects, single marker analysis may not identify those weak signals. On the other hand, set-based tests have higher power because they combine the effects of all SNPs in the set and thus may be able to detect small effects. In addition, set-based tests may have higher power in the presence of genetic heterogeneity. And finally, set-based approaches greatly reduce the burden of multiple testing in GWASs.
Many set-based approaches have been developed in recent years [8,9,11–22]. One popular test is the sequence kernel association test (SKAT) [9,21,22], a flexible, computationally efficient, and regression-based approach. In SKAT, covariates can be easily incorporated into the model. In addition, predefined weights can be assigned to each SNP in the SNP set. This increases the power when prior information shows that certain types of markers may be associated with a trait. For example, a weight as a function of a minor allele frequency (MAF) that follows a beta density is proposed in Wu et al. [21], which assumes that rare genetic variants have larger effects on common diseases. Furthermore, the test statistic derived in SKAT follows a mixture of chi-square distributions. Thus, p-values can be computed analytically without permutation, leading to significant improvement in computation.
Family-based designs have been widely used to study the association between diseases and genetic variants [23–26]. In GWASs with unrelated samples, a general linear model is usually used to investigate the association between quantitative phenotypes and genetic markers. However, a general linear model results in an inflated Type I error rate when the familial correlation is not appropriately handled. Thus, instead of a general linear model, a linear mixed model including a random effect is usually employed to deal with correlation between familial samples. The covariance of random effects of all individuals can be expressed by a variance of polygenic effect and kinship matrix (a matrix of kinship coefficients, which are measures of degrees of genetic correlations between individuals). Linear mixed models have been commonly used in single-marker GWASs for family data [27,28]. Recently, SKAT has been extended to be applicable for quantitative traits in family samples [29–31]. Furthermore, the extension to dichotomous traits in family samples is described in Ionita-Laza et al. [32] in which the algorithm follows a generalized linear model and incorporates laws of Mendelian transmission to calculate the genotype expectation conditional on parental genotypes. This method, however, ignores parental phenotypes and therefore may lose power because it does not fully use the data. In addition, this method cannot handle non-parental relationships such as those between offspring, grandparents-grandchildren, or uncles-nephews.
In this study, we aim to propose a method that can handle non-continuous traits in family samples. Our proposed method uses kernel machine regression and can be viewed as a generalization of famSKAT [29]. Our new model, denoted as F-SKAT, is based on a generalized linear mixed model framework that is more general and can be applied to a larger range of studies with different types of traits. We demonstrate in our simulation studies that the original SKAT has inflated Type I error rate when applied to all family samples without consideration of their relationship. By contrast, our proposed F-SKAT has correct Type I error rate. Moreover, because it uses all family samples, F-SKAT is consistently more powerful than SKAT with the use of only unrelated individuals (founders) in the family data because SKAT can only use a subset of the samples for analysis in order to retain the correct Type I error rate. This is also consistent with the simulation results for quantitative traits in Chen et al. [29]. The same observation was also made in other studies [33].
Methods
The SKAT in a Generalized Linear Mixed Model Framework
The model setup is presented in a manner very similar to that of Chen et al. [29], although for binary traits instead. We assume that the n × 1 vector of the trait y follows a generalized linear mixed model. Now the trait is no longer assumed to follow a normal distribution. The link function h(·) is used to map a linear combination of predictors for observation i, ηi, to the conditional mean of observation i, shown as
where X is an n × p covariate matrix, β is a p × 1 vector standing for fixed effects parameters (an intercept and p − 1 covariates), G is an n × q genotype matrix for q genetic variants of interest, γ is a q × 1 vector for the random effects of variants, Z is an n × k matrix for k random effects, and u is a k × 1 vector for the random effect coefficients, which is added to the original SKAT model [9,21]. The random effects γ is assumed to be normally distributed with mean 0 and variance for variant i so the null hypothesis being tested is H0: γ= 0 that is equivalent to test H0: τ = 0, which can be tested with a variance component score test [21] in the mixed model. Also assumed is that u is normally distributed and uncorrelated with γ, as in:
where W is a predefined q × q diagonal weight matrix for each variant and may use as in SKAT [21], and K is a k × k covariance matrix.
Following the same rationale as in the derivation of the SKAT and famSKAT score statistics [29,34–36] (refer to Supplementary Material for details), we have the following test statistic for our new model
where y* is the final working trait vector, is the vector of estimated fixed effects of covariates under H0, and is the estimated variance-covariance matrix under H0. The statistic Q is a quadratic form of and follows a mixture of chi-square distributions [37] under H0. The p-values can be calculated by numerical algorithms such as Davies’ method [38]. This generalized linear model framework is very general with many models as special cases depending on the data type of the phenotype. For example, this framework can be simplified for continuous and dichotomous traits in a population-based study (see Supplementary Material), which is the same as the models described in Wu et al. [21]. In addition, count traits can also be handled. Furthermore, longitudinal and familial structures can be added in the model by manipulating the random effect term.
The SKAT for Dichotomous Traits in Family Samples
Specifically, the above approach can be used for handling dichotomous traits in family samples such that h(·) is replaced with logit(·) and Zu is replaced with δ that is an n ×1 vector for the random effects of familial correlation. The dichotomous trait y follows a generalized linear mixed model,
where Xβ and Gγ are the same as in the above section. Again, the random effects vector γ is assumed to follow a normal distribution with mean 0 and covariance matrix τW, so the null hypothesis is to test H0: τ= 0, where W is the predefined weight matrix and may use . In addition, δ follows a normal distribution with mean 0 and covariance matrix , where Φ is twice the n × n kinship matrix obtained from family information only.
Simulation Study
We simulated samples based on a collection of 10,000 haplotypes over a 200-kb region generated by the calibrated coalescent model [39] with mimicked linkage disequilibrium (LD) structure of European ancestry. Almost all of the simulated variants are rare variants; 1,200 haplotypes were randomly selected as parents’ haplotypes. The offspring haplotypes were generated by randomly transmitting one of the two haplotypes of the father and the mother. We generated 300 families with a father, mother, and at least one offspring in each family for a scenario of families with flexible numbers of offspring (sibship size ranges from 1 to 5) (Figure 1A). For simplicity, we also considered the scenario of trio families by selecting a father, mother, and one offspring from the 300 families (Figure 1B). In addition, in order to simulate a complex pedigree, we randomly selected 400 haplotypes as grandparents’ haplotypes and 400 haplotypes as independent parents’ haplotypes. For the three-generation family scenario, we generated 100 families with two grandparents, two independent parents, two dependent parents who are the offspring of the two grandparents, and four children (Figure 1C). Furthermore, 30 randomly selected SNPs with at least one copy of a minor allele appearing in the corresponding data set were used in the analysis. The genotype can be easily converted from the haplotype data and we simulated 100 such genotype data sets in the analysis for each of the three scenarios.
Figure 1.
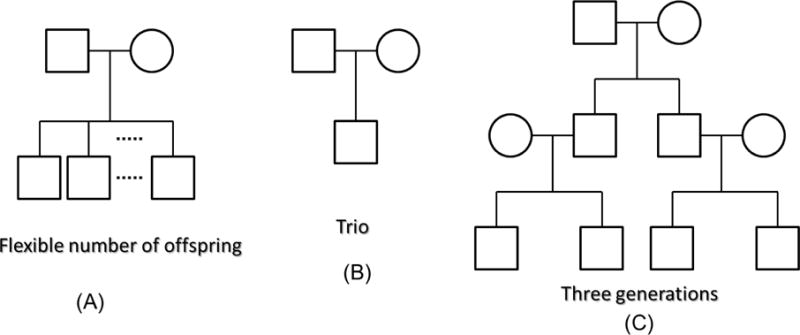
Three scenarios of pedigree structures in simulation studies.
Type I Error Rate
In analyzing the scenarios of families with flexible numbers of offspring and families with three generations, we compared F-SKAT to three other approaches: (1) the approach that applies SKAT on unrelated individuals (founders) in the family data (abbreviated as unrSKAT), (2) the original SKAT, and (3) the method by Ionita-Laza et al. (abbreviated as IL) [32]. For each of the 100 genotype data sets, we simulated 1,000 sets of phenotypes. The dichotomous phenotypes for each family were generated via the following model:
where α0 was determined to set the prevalence to 10% in our simulation. In other words, and is from a multivariate normal distribution with means 0 and covariance where Φ is twice the kinship matrix. For instance, a family with a father, mother, and two children has
and . The scenario of families with three generations has a more complicated kinship matrix (Figure 1S). The phenotypes for all of the families were generated in the same way and the 1,000 simulated phenotypes for each of the 100 genotype data sets were used to evaluate the Type I error rate. For the scenario of trio families, both parents and one child were selected from each of the families with flexible numbers of offspring. For these families, the covariance matrix is the same for all the families, where
Power Evaluation
We used the same genotype data sets as described above. We compared F-SKAT with unrSKAT and IL for the scenarios of families with flexible numbers of offspring and families with three generations. For each of the 100 genotype data sets, we simulated 1,000 sets of phenotypes. The dichotomous phenotypes for each family were simulated via the following model:
where is a continuous variable generated from a standard normal distribution, is a dichotomous variable from a Bernoulli distribution with a probability of 0.5, are the genotypes of causal SNPs, and are log odds ratios of the causal SNPs. We considered that 40% and 80% of all variants are disease susceptibility variants and that and δi were determined the same as in the Type I error rate section. Furthermore, were set to in order to assign large weights to rare variants, where c= 0.4 is chosen such that when MAF = 0.0001, β= 1.6 (i.e., OR = 4.9) [21]. Because SKAT can handle the presence of both risk and protective variants, we also considered that 25% of the causal variants are protective, which means (i.e., 30% disease variants and 10% protective variants; and 60% disease variants and 20% protective variants). The phenotypes for all of the families were generated the same way and these 1,000 phenotypes for each of the 100 genotype data sets were used to evaluate the power. For the scenario of trio families, the simulated phenotypes of father, mother, and one offspring were selected from each of the families with flexible numbers of offspring.
Results
Simulation of the Type I Error Rate
Tables 1, 2 and 3 depict the empirical Type I error rate of F-SKAT, unrSKAT, SKAT, and IL at α level of 0.05, 0.01, 0.005, and 0.001 for trio families, families with flexible numbers of offspring, and families with three generations, respectively. The results indicate that the Type I error is inflated when SKAT is applied directly to all the samples including correlated individuals. In contrast, F-SKAT, unrSKAT, and IL retain the correct Type I error, but IL shows a trend of increased Type I error rate as the significance level decreases. From the QQ plots in Figures 2 and 3, we can see similar patterns. This indicates that F-SKAT and unrSKAT can control Type I error well for different significance levels; however, IL maintains the correct Type I error rate when the significance level is not stringent (say, α > 0.005) but otherwise has an inflated the Type I error rate. The QQ plots in Figure 4 indicate that F-SKAT preserves the desired Type I error rate, and unrSKAT and IL maintain the correct Type I error rate at non-stringent significance levels. The inflation of the Type I error rate in SKAT becomes more severe as the number of correlated individuals in one family increases.
Table 1.
Type I error rate of F-SKAT, unrSKAT, SKAT, and IL for parent-offspring trio families
| α=0.05 | α=0.01 | α=0.005 | α=0.001 | |
|---|---|---|---|---|
| F-SKAT | 0.05188 | 0.01109 | 0.00577 | 0.00131 |
| unrSKAT | 0.04887 | 0.01009 | 0.00535 | 0.00138 |
| SKAT | 0.08802 | 0.02254 | 0.01239 | 0.0035 |
| IL | 0.05528 | 0.01380 | 0.00789 | 0.00195 |
Table 2.
Type I error rate of F-SKAT, unrSKAT, SKAT, and IL for families with flexible numbers of offspring
| α=0.05 | α=0.01 | α=0.005 | α=0.001 | |
|---|---|---|---|---|
| F-SKAT | 0.05421 | 0.01151 | 0.00589 | 0.00134 |
| unrSKAT | 0.04887 | 0.01009 | 0.00535 | 0.00138 |
| SKAT | 0.12263 | 0.03530 | 0.02047 | 0.00598 |
| IL | 0.05242 | 0.01350 | 0.00766 | 0.00235 |
Table 3.
Type I error rate of F-SKAT, unrSKAT, SKAT, and IL for families with three generations
| α=0.05 | α=0.01 | α=0.005 | α=0.001 | |
|---|---|---|---|---|
| F-SKAT | 0.05356 | 0.01201 | 0.00625 | 0.00158 |
| unrSKAT | 0.04779 | 0.00989 | 0.00527 | 0.00142 |
| SKAT | 0.17455 | 0.05511 | 0.03308 | 0.01022 |
| IL | 0.05159 | 0.01269 | 0.00727 | 0.00189 |
Figure 2.
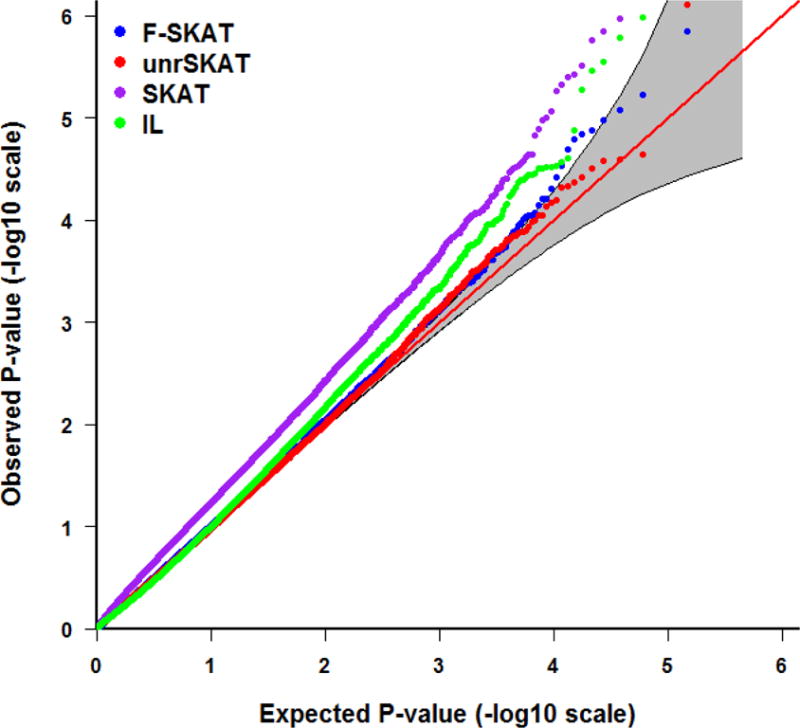
QQ plot of the p-values for F-SKAT, unrSKAT, SKAT, and IL for parent-offspring trio families from the null simulation, with 95% pointwise confidence band (gray area) that is computed under the assumption of the p-values being drawn independently from a uniform [0, 1] distribution.
Figure 3.
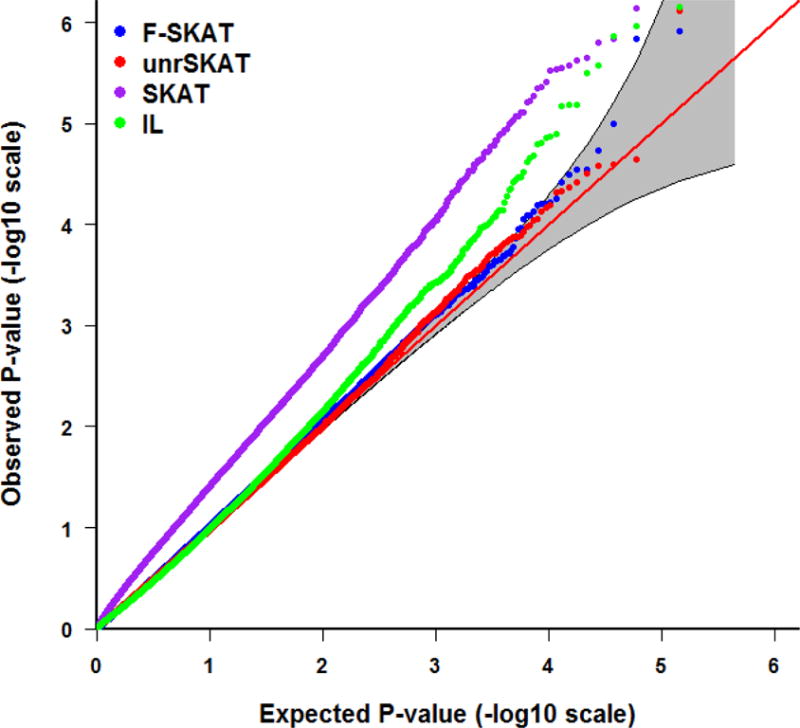
QQ plot of the p-values for F-SKAT, unrSKAT, SKAT, and IL for families with flexible numbers of offspring from the null simulation, with 95% pointwise confidence band (gray area) that is computed under the assumption of the p-values being drawn independently from a uniform [0, 1] distribution.
Figure 4.
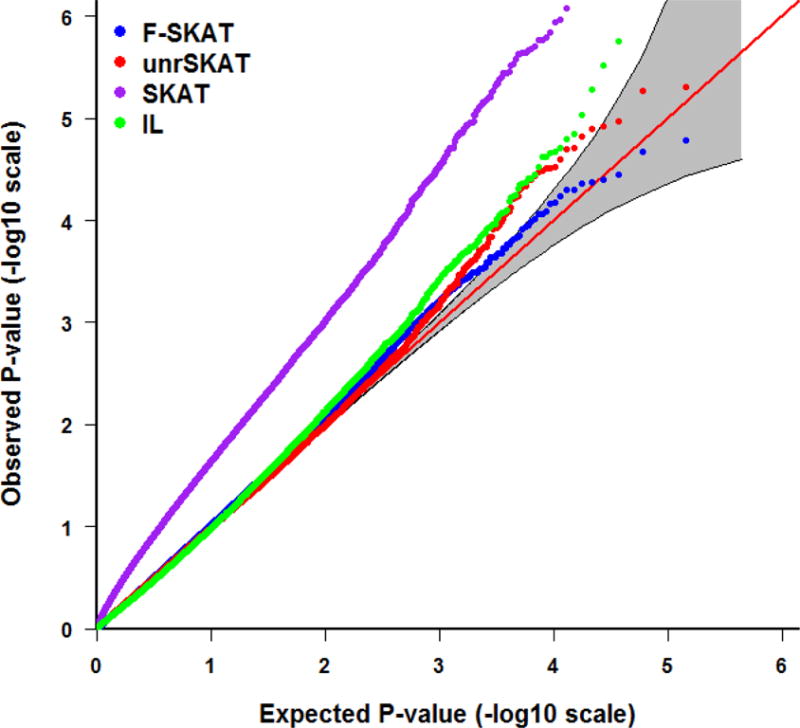
QQ plot of the p-values for F-SKAT, unrSKAT, SKAT, and IL for families with three generations from the null simulation, with 95% pointwise confidence band (gray area) that is computed under the assumption of the p-values being drawn independently from a uniform [0, 1] distribution.
Statistical Power Comparison
Because the original SKAT has an incorrect Type I error rate for family data, we only investigated the power of F-SKAT, unrSKAT, and IL (i.e. exclude original SKAT from power comparison). The simulation results for trio families, families with flexible numbers of offspring, and families with three generations are shown in Figures 5, 6 and 7, respectively. For trio families, in all of the scenarios we considered, the power of F-SKAT is consistently but only slightly higher than that of unrSKAT. The slight gain in power may be caused by the difference in Type I error rate (Figure 2S). The power of IL is not high in our simulation study. For families with flexible numbers of offspring and with three generations, the pattern is similar to that of the trio families. In all scenarios, the power of F-SKAT is consistently higher than that of unrSKAT and IL. Furthermore, F-SKAT achieves the highest power in families with three generations, and the power of F-SKAT is higher in families with flexible numbers of offspring than in trio families, which indicates that the power gain of F-SKAT increases as the size of families increases. This is expected because F-SKAT makes full use of the data, while in contrast, unrSKAT uses only unrelated samples and discards other family members.
Figure 5.
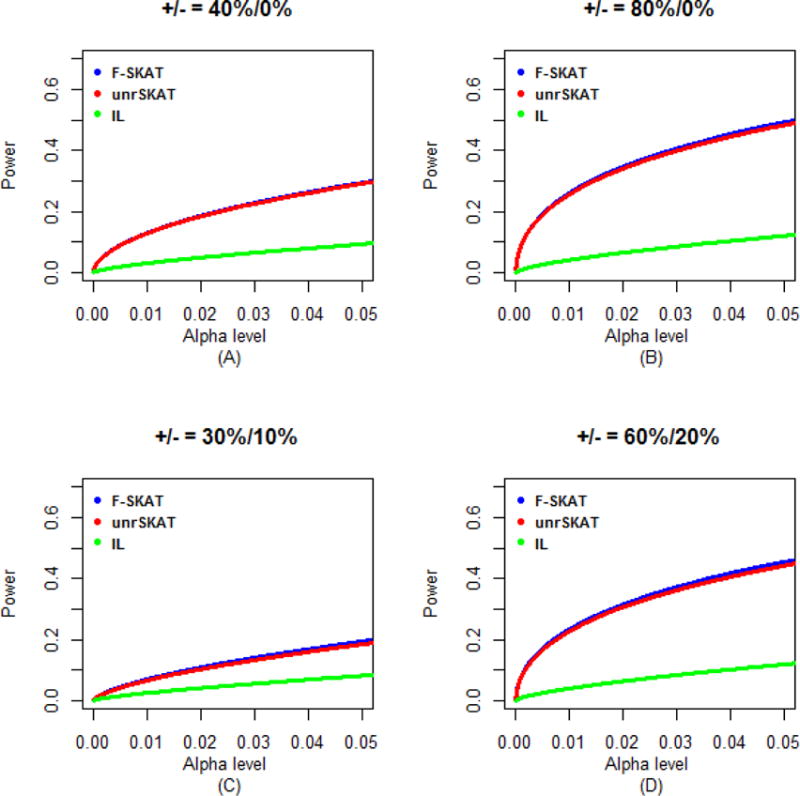
Power comparisons of F-SKAT, unrSKAT, and IL for data with parent-offspring trio families (α level is from 0 to 0.05). (A) 40% disease variants scenario; (B) 80% disease variants scenario; (C) 30% disease variants and 10% protective variants scenario; (D) 60% disease variants and 20% protective variants scenario.
Figure 6.
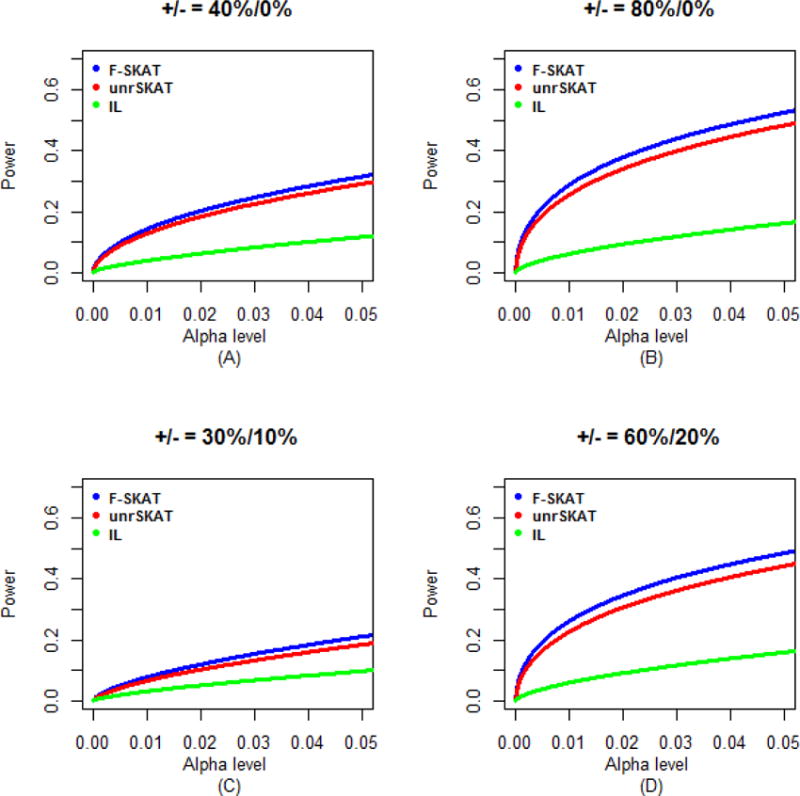
Power comparisons of F-SKAT, unrSKAT, and IL for data of families with flexible numbers of offspring (α level is from 0 to 0.05). (A) 40% disease variants scenario; (B) 80% disease variants scenario; (C) 30% disease variants and 10% protective variants scenario; (D) 60% disease variants and 20% protective variants scenario.
Figure 7.
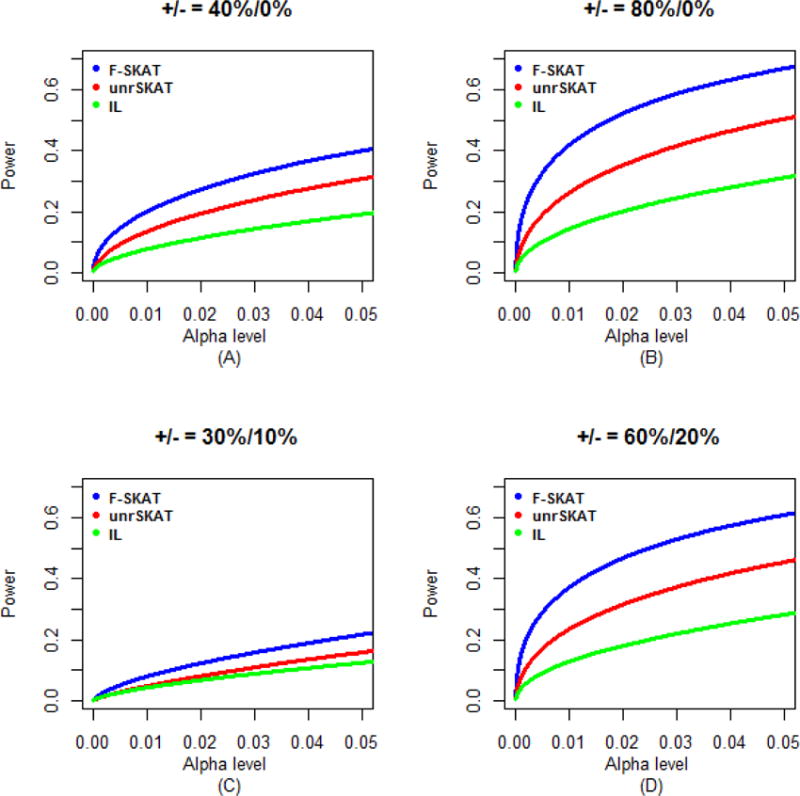
Power comparisons of F-SKAT, unrSKAT, and IL for data of families with three generations (α level is from 0 to 0.05). (A) 40% disease variants scenario; (B) 80% disease variants scenario; (C) 30% disease variants and 10% protective variants scenario; (D) 60% disease variants and 20% protective variants scenario.
Discussion
In this work, we have proposed a new method, F-SKAT, under a generalized linear mixed-model framework that can be used to analyze familial data with various types of phenotypes, such as continuous and discrete, and covariates. The new method is based on kernel machine regression and can be viewed as an extension of SKAT [9,21] as well as famSKAT [29]. As a set-based analysis, F-SKAT shares the advantages of set-based methods, such as improved power by testing a set of genetic variants jointly and by reducing the multiple testing penalty. Our simulation studies show that the proposed method has consistently higher power than existing approaches in the scenarios we have considered. The new method includes various existing methods, such as SKAT and famSKAT, as special cases. This shows that the proposed method is theoretically more advantageous than the existing methods and allows us to conveniently analyze data using different approaches.
In the simulation studies, we show that using SKAT on data with related samples results in an inflated Type I error rate, which consistent with the results for quantitative traits in Chen et al. [29]. One strategy is to analyze only unrelated subjects from the data using SKAT. In this way, the Type I error rate can be controlled, but power is sacrificed because only part of the data is analyzed. In contrast, F-SKAT uses all the data, retains the correct Type I error rate, and achieves higher power in all of the scenarios we considered. Our simulation also shows that the larger the family size, the more power F-SKAT gains, which is also consistent with the findings for quantitative traits in Chen et al. [29]. Based on our simulation study, F-SKAT makes a good choice for analysis of familial data with various traits, although we only considered dichotomous traits in this study. For quantitative traits, an extensive simulation study was published by Chen et al. [29].
The computation time of F-SKAT depends on both sample size (including family size and structure) and the number of genetic variants to be analyzed. F-SKAT involves fitting a generalized linear mixed model that must be done iteratively. This consumes much of the computation time. Even though this step is computationally intensive, the total computation time, in fact, may not be a serious issue when analyzing data from GWASs. Like SKAT, F-SKAT is basically a score test and thus under null hypothesis the estimates of covariate coefficients and covariance matrix are independent with genetic variants. The generalized linear mixed model under the null hypothesis only needs to be fitted once for the whole genome and is then reused in the analysis of other genes. Therefore, the total computation time is greatly reduced. To estimate the computation of the proposed methods, we conducted a simple simulation in R on a single computing node with 3 GHz CPU and 4 GB memory analyzing a 200-kb region on 1,500 individuals (500 trios). It took F-STAT 5.988 seconds for the analysis. Based on this simulation, we can estimate that it may take F-STAT approximately 25 hours to analyze the whole genome (~3 Gb) on the same samples. Using a computer cluster with multiple nodes, we anticipate that most of the genome-wide data analysis should be finished within hours using the proposed methods. Thus, complicated generalized linear mixed models can be implemented for GWASs without suffering from a huge amount of computation time. However, if the number of markers in a gene is large, inverting the large matrix is still computationally intensive. One way to handle this would be to partition the markers into smaller groups, such as groups of non-synonymous or synonymous coding variants. Another way would be to use fast algorithms, such as those implemented in the software EMMA/EMMAX [40,41], to make our algorithm faster and more efficient. The approach of clustering samples implemented in TASSEL [41] applies naturally to family data. Recently, several new fast algorithms have been proposed for mixed model [42–45]. Some of the new ideas may be used in our algorithm. The F-SKAT algorithm has been implemented in R (http://www.r-project.org/) and the source code is available is available online (http://www.soph.uab.edu/ssg/software).
In our work, the kinship coefficients in the kinship matrices are obtained from familial relationships. If genome-wide genotype data are available, it is more advantageous to use genetic markers to estimate the kinship coefficients among individuals [40,46–50]. The use of kinship coefficients enables our method to be applicable to data with any relationship (such as grandparents-grandchildren and uncles-nephews) and even with cryptic relatedness. We have shown that our new method is feasible for genome-wide studies, although the computation is still intensive. Fast algorithms, such as those developed for linear mixed models [31,40,41,43–45], are attractive and would be very helpful. Although we have only studied the performance of a linear kernel in this work, it is straightforward to use a non-linear kernel within the flexible kernel machine-regression framework when a non-linear association between a disease and genetic variants is assumed.
Supplementary Material
Acknowledgments
This work was supported in part by grant EPS1158862 from the National Science Foundation (Q.Y., H.K.T.); grants GM081488, R01HL092173, P60AR064172 (N.L.), 5R01GM069430-08 (N.Y.), 5R01DA025095 (X.L.), and GM073766 (G.G.) from the National Institutes of Health; grants 102-2628-B-002-039-MY3 and 102-2314-B-002-001-MY2 from the Ministry of Science and Technology of Taiwan, and NTU-CESRP-101R7622-8, NTU-CESRP-102R7622-8, and NTU-CDP-102R7769 from National Taiwan University (W-Y.L.). The content is solely the responsibility of the authors and does not necessarily represent the official views of the sponsors.
Footnotes
The authors also declare that they have no conflict of interest.
References
- 1.Mardis ER. The impact of next-generation sequencing technology on genetics. Trends in genetics: TIG. 2008;24:133–141. doi: 10.1016/j.tig.2007.12.007. [DOI] [PubMed] [Google Scholar]
- 2.Metzker ML. Sequencing technologies – the next generation. Nature reviews Genetics. 2010;11:31–46. doi: 10.1038/nrg2626. [DOI] [PubMed] [Google Scholar]
- 3.Wellcome Trust Case Control C. Genome-wide association study of 14,000 cases of seven common diseases and 3,000 shared controls. Nature. 2007;447:661–678. doi: 10.1038/nature05911. [DOI] [PMC free article] [PubMed] [Google Scholar]
- 4.Hunter DJ, Kraft P, Jacobs KB, Cox DG, Yeager M, Hankinson SE, Wacholder S, Wang Z, Welch R, Hutchinson A, Wang J, Yu K, Chatterjee N, Orr N, Willett WC, Colditz GA, Ziegler RG, Berg CD, Buys SS, McCarty CA, Feigelson HS, Calle EE, Thun MJ, Hayes RB, Tucker M, Gerhard DS, Fraumeni JF, Jr, Hoover RN, Thomas G, Chanock SJ. A genome-wide association study identifies alleles in fgfr2 associated with risk of sporadic postmenopausal breast cancer. Nature genetics. 2007;39:870–874. doi: 10.1038/ng2075. [DOI] [PMC free article] [PubMed] [Google Scholar]
- 5.Yeager M, Orr N, Hayes RB, Jacobs KB, Kraft P, Wacholder S, Minichiello MJ, Fearnhead P, Yu K, Chatterjee N, Wang Z, Welch R, Staats BJ, Calle EE, Feigelson HS, Thun MJ, Rodriguez C, Albanes D, Virtamo J, Weinstein S, Schumacher FR, Giovannucci E, Willett WC, Cancel-Tassin G, Cussenot O, Valeri A, Andriole GL, Gelmann EP, Tucker M, Gerhard DS, Fraumeni JF, Jr, Hoover R, Hunter DJ, Chanock SJ, Thomas G. Genome-wide association study of prostate cancer identifies a second risk locus at 8q24. Nature genetics. 2007;39:645–649. doi: 10.1038/ng2022. [DOI] [PubMed] [Google Scholar]
- 6.Hindorff LA, Sethupathy P, Junkins HA, Ramos EM, Mehta JP, Collins FS, Manolio TA. Potential etiologic and functional implications of genome-wide association loci for human diseases and traits. Proceedings of the National Academy of Sciences of the United States of America. 2009;106:9362–9367. doi: 10.1073/pnas.0903103106. [DOI] [PMC free article] [PubMed] [Google Scholar]
- 7.Manolio TA, Brooks LD, Collins FS. A hapmap harvest of insights into the genetics of common disease. The Journal of clinical investigation. 2008;118:1590–1605. doi: 10.1172/JCI34772. [DOI] [PMC free article] [PubMed] [Google Scholar]
- 8.Liu JZ, McRae AF, Nyholt DR, Medland SE, Wray NR, Brown KM, Investigators A, Hayward NK, Montgomery GW, Visscher PM, Martin NG, Macgregor S. A versatile gene-based test for genome-wide association studies. American journal of human genetics. 2010;87:139–145. doi: 10.1016/j.ajhg.2010.06.009. [DOI] [PMC free article] [PubMed] [Google Scholar]
- 9.Wu MC, Kraft P, Epstein MP, Taylor DM, Chanock SJ, Hunter DJ, Lin X. Powerful snp-set analysis for case-control genome-wide association studies. American journal of human genetics. 2010;86:929–942. doi: 10.1016/j.ajhg.2010.05.002. [DOI] [PMC free article] [PubMed] [Google Scholar]
- 10.Neale BM, Sham PC. The future of association studies: Gene-based analysis and replication. American journal of human genetics. 2004;75:353–362. doi: 10.1086/423901. [DOI] [PMC free article] [PubMed] [Google Scholar]
- 11.Han F, Pan W. A data-adaptive sum test for disease association with multiple common or rare variants. Human heredity. 2010;70:42–54. doi: 10.1159/000288704. [DOI] [PMC free article] [PubMed] [Google Scholar]
- 12.Hoffmann TJ, Marini NJ, Witte JS. Comprehensive approach to analyzing rare genetic variants. PloS one. 2010;5:e13584. doi: 10.1371/journal.pone.0013584. [DOI] [PMC free article] [PubMed] [Google Scholar]
- 13.Li B, Leal SM. Methods for detecting associations with rare variants for common diseases: Application to analysis of sequence data. American journal of human genetics. 2008;83:311–321. doi: 10.1016/j.ajhg.2008.06.024. [DOI] [PMC free article] [PubMed] [Google Scholar]
- 14.Lin WY, Lou XY, Gao G, Liu N. Rare variant association testing by adaptive combination of p-values. PloS one. 2014;9:e85728. doi: 10.1371/journal.pone.0085728. [DOI] [PMC free article] [PubMed] [Google Scholar]
- 15.Lin WY, Yi N, Lou XY, Zhi D, Zhang K, Gao G, Tiwari HK, Liu N. Haplotype kernel association test as a powerful method to identify chromosomal regions harboring uncommon causal variants. Genetic epidemiology. 2013;37:560–570. doi: 10.1002/gepi.21740. [DOI] [PMC free article] [PubMed] [Google Scholar]
- 16.Lin WY, Yi N, Zhi D, Zhang K, Gao G, Tiwari HK, Liu N. Haplotype-based methods for detecting uncommon causal variants with common snps. Genetic epidemiology. 2012;36:572–582. doi: 10.1002/gepi.21650. [DOI] [PMC free article] [PubMed] [Google Scholar]
- 17.Madsen BE, Browning SR. A groupwise association test for rare mutations using a weighted sum statistic. PLoS genetics. 2009;5:e1000384. doi: 10.1371/journal.pgen.1000384. [DOI] [PMC free article] [PubMed] [Google Scholar]
- 18.Morgenthaler S, Thilly WG. A strategy to discover genes that carry multi-allelic or mono-allelic risk for common diseases: A cohort allelic sums test (cast) Mutation research. 2007;615:28–56. doi: 10.1016/j.mrfmmm.2006.09.003. [DOI] [PubMed] [Google Scholar]
- 19.Zawistowski M, Gopalakrishnan S, Ding J, Li Y, Grimm S, Zollner S. Extending rare-variant testing strategies: Analysis of noncoding sequence and imputed genotypes. American journal of human genetics. 2010;87:604–617. doi: 10.1016/j.ajhg.2010.10.012. [DOI] [PMC free article] [PubMed] [Google Scholar]
- 20.Yi N, Liu N, Zhi D, Li J. Hierarchical generalized linear models for multiple groups of rare and common variants: Jointly estimating group and individual-variant effects. PLoS genetics. 2011;7:e1002382. doi: 10.1371/journal.pgen.1002382. [DOI] [PMC free article] [PubMed] [Google Scholar]
- 21.Wu MC, Lee S, Cai T, Li Y, Boehnke M, Lin X. Rare-variant association testing for sequencing data with the sequence kernel association test. American journal of human genetics. 2011;89:82–93. doi: 10.1016/j.ajhg.2011.05.029. [DOI] [PMC free article] [PubMed] [Google Scholar]
- 22.Yan Q, Tiwari HK, Yi N, Lin WY, Gao G, Lou XY, Cui X, Liu N. Kernel-machine testing coupled with a rank-truncation method for genetic pathway analysis. Genetic epidemiology. 2014;38:447–456. doi: 10.1002/gepi.21813. [DOI] [PMC free article] [PubMed] [Google Scholar]
- 23.Falk CT, Rubinstein P. Haplotype relative risks: An easy reliable way to construct a proper control sample for risk calculations. Annals of human genetics. 1987;51:227–233. doi: 10.1111/j.1469-1809.1987.tb00875.x. [DOI] [PubMed] [Google Scholar]
- 24.Ott J. Statistical properties of the haplotype relative risk. Genetic epidemiology. 1989;6:127–130. doi: 10.1002/gepi.1370060124. [DOI] [PubMed] [Google Scholar]
- 25.Spielman RS, McGinnis RE, Ewens WJ. Transmission test for linkage disequilibrium: The insulin gene region and insulin-dependent diabetes mellitus (iddm) American journal of human genetics. 1993;52:506–516. [PMC free article] [PubMed] [Google Scholar]
- 26.Terwilliger JD, Ott J. A haplotype-based ‘haplotype relative risk’ approach to detecting allelic associations. Human heredity. 1992;42:337–346. doi: 10.1159/000154096. [DOI] [PubMed] [Google Scholar]
- 27.Almasy L, Blangero J. Multipoint quantitative-trait linkage analysis in general pedigrees. American journal of human genetics. 1998;62:1198–1211. doi: 10.1086/301844. [DOI] [PMC free article] [PubMed] [Google Scholar]
- 28.Rabinowitz D, Laird N. A unified approach to adjusting association tests for population admixture with arbitrary pedigree structure and arbitrary missing marker information. Human heredity. 2000;50:211–223. doi: 10.1159/000022918. [DOI] [PubMed] [Google Scholar]
- 29.Chen H, Meigs JB, Dupuis J. Sequence kernel association test for quantitative traits in family samples. Genetic epidemiology. 2013;37:196–204. doi: 10.1002/gepi.21703. [DOI] [PMC free article] [PubMed] [Google Scholar]
- 30.Schifano ED, Epstein MP, Bielak LF, Jhun MA, Kardia SL, Peyser PA, Lin X. Snp set association analysis for familial data. Genetic epidemiology. 2012;36:797–810. doi: 10.1002/gepi.21676. [DOI] [PMC free article] [PubMed] [Google Scholar]
- 31.Oualkacha K, Dastani Z, Li R, Cingolani PE, Spector TD, Hammond CJ, Richards JB, Ciampi A, Greenwood CM. Adjusted sequence kernel association test for rare variants controlling for cryptic and family relatedness. Genetic epidemiology. 2013;37:366–376. doi: 10.1002/gepi.21725. [DOI] [PubMed] [Google Scholar]
- 32.Ionita-Laza I, Lee S, Makarov V, Buxbaum JD, Lin X. Family-based association tests for sequence data, and comparisons with population-based association tests. European journal of human genetics: EJHG. 2013;21:1158–1162. doi: 10.1038/ejhg.2012.308. [DOI] [PMC free article] [PubMed] [Google Scholar]
- 33.Cordell HJ. Summary of results and discussions from the gene-based tests group at genetic analysis workshop 18. Genetic epidemiology. 2014;38(Suppl 1):S44–48. doi: 10.1002/gepi.21824. [DOI] [PMC free article] [PubMed] [Google Scholar]
- 34.Kwee LC, Liu D, Lin X, Ghosh D, Epstein MP. A powerful and flexible multilocus association test for quantitative traits. American journal of human genetics. 2008;82:386–397. doi: 10.1016/j.ajhg.2007.10.010. [DOI] [PMC free article] [PubMed] [Google Scholar]
- 35.Liu D, Lin X, Ghosh D. Semiparametric regression of multidimensional genetic pathway data: Least-squares kernel machines and linear mixed models. Biometrics. 2007;63:1079–1088. doi: 10.1111/j.1541-0420.2007.00799.x. [DOI] [PMC free article] [PubMed] [Google Scholar]
- 36.Zhang D, Lin X. Hypothesis testing in semiparametric additive mixed models. Biostatistics. 2003;4:57–74. doi: 10.1093/biostatistics/4.1.57. [DOI] [PubMed] [Google Scholar]
- 37.Yuan KH, Bentler PM. Two simple approximations to the distributions of quadratic forms. The British journal of mathematical and statistical psychology. 2010;63:273–291. doi: 10.1348/000711009X449771. [DOI] [PMC free article] [PubMed] [Google Scholar]
- 38.Davies R. The distribution of a linear combination of chi-square random variables. J R Stat Soc Ser C Appl Stat. 1980;29:323–333. [Google Scholar]
- 39.Schaffner SF, Foo C, Gabriel S, Reich D, Daly MJ, Altshuler D. Calibrating a coalescent simulation of human genome sequence variation. Genome research. 2005;15:1576–1583. doi: 10.1101/gr.3709305. [DOI] [PMC free article] [PubMed] [Google Scholar]
- 40.Kang HM, Sul JH, Service SK, Zaitlen NA, Kong SY, Freimer NB, Sabatti C, Eskin E. Variance component model to account for sample structure in genome-wide association studies. Nature genetics. 2010;42:348–354. doi: 10.1038/ng.548. [DOI] [PMC free article] [PubMed] [Google Scholar]
- 41.Zhang Z, Ersoz E, Lai CQ, Todhunter RJ, Tiwari HK, Gore MA, Bradbury PJ, Yu J, Arnett DK, Ordovas JM, Buckler ES. Mixed linear model approach adapted for genome-wide association studies. Nature genetics. 2010;42:355–360. doi: 10.1038/ng.546. [DOI] [PMC free article] [PubMed] [Google Scholar]
- 42.Zhou X, Stephens M. Efficient multivariate linear mixed model algorithms for genome-wide association studies. Nature methods. 2014;11:407–409. doi: 10.1038/nmeth.2848. [DOI] [PMC free article] [PubMed] [Google Scholar]
- 43.Lippert C, Listgarten J, Liu Y, Kadie CM, Davidson RI, Heckerman D. Fast linear mixed models for genome-wide association studies. Nature methods. 2011;8:833–835. doi: 10.1038/nmeth.1681. [DOI] [PubMed] [Google Scholar]
- 44.Svishcheva GR, Axenovich TI, Belonogova NM, van Duijn CM, Aulchenko YS. Rapid variance components-based method for whole-genome association analysis. Nature genetics. 2012;44:1166–1170. doi: 10.1038/ng.2410. [DOI] [PubMed] [Google Scholar]
- 45.Zhou X, Stephens M. Genome-wide efficient mixed-model analysis for association studies. Nature genetics. 2012;44:821–824. doi: 10.1038/ng.2310. [DOI] [PMC free article] [PubMed] [Google Scholar]
- 46.Balding DJ, Nichols RA. A method for quantifying differentiation between populations at multi-allelic loci and its implications for investigating identity and paternity. Genetica. 1995;96:3–12. doi: 10.1007/BF01441146. [DOI] [PubMed] [Google Scholar]
- 47.Lynch M, Ritland K. Estimation of pairwise relatedness with molecular markers. Genetics. 1999;152:1753–1766. doi: 10.1093/genetics/152.4.1753. [DOI] [PMC free article] [PubMed] [Google Scholar]
- 48.Ritland K. Multilocus estimation of pairwise relatedness with dominant markers. Molecular ecology. 2005;14:3157–3165. doi: 10.1111/j.1365-294X.2005.02667.x. [DOI] [PubMed] [Google Scholar]
- 49.Yu J, Pressoir G, Briggs WH, Vroh Bi I, Yamasaki M, Doebley JF, McMullen MD, Gaut BS, Nielsen DM, Holland JB, Kresovich S, Buckler ES. A unified mixed-model method for association mapping that accounts for multiple levels of relatedness. Nature genetics. 2006;38:203–208. doi: 10.1038/ng1702. [DOI] [PubMed] [Google Scholar]
- 50.Liu N, Zhao H, Patki A, Limdi NA, Allison DB. Controlling population structure in human genetic association studies with samples of unrelated individuals. Statistics and its interface. 2011;4:317–326. doi: 10.4310/sii.2011.v4.n3.a6. [DOI] [PMC free article] [PubMed] [Google Scholar]
Associated Data
This section collects any data citations, data availability statements, or supplementary materials included in this article.


