Abstract
Carbon monoxide (CO) poisoning is a leading cause of mine fire fatalities in underground mines. To reduce the hazard of CO poisoning in underground mines, it is important to accurately predict the spread of CO in underground mine entries when a fire occurs. This paper presents a study on modeling CO spread in underground mine fires using both the Fire Dynamics Simulator (FDS) and the MFIRE programs. The FDS model simulating part of the mine ventilation network was calibrated using CO concentration data from full-scale mine fire tests. The model was then used to investigate the effect of airflow leakage on CO concentration reduction in the mine entries. The inflow of fresh air at the leakage location was found to cause significant CO reduction. MFIRE simulation was conducted to predict the CO spread in the entire mine ventilation network using both a constant heat release rate and a dynamic fire source created from FDS. The results from both FDS and MFIRE simulations are compared and the implications of the improved MFIRE capability are discussed.
Keywords: Mine fires, Carbon monoxide, Computational fluid dynamics, Ventilation
1. Introduction
When a fire occurs in an underground mine, it poses severe hazard to underground workers. The smoke and toxic gases from the fire endanger not only workers in the vicinity of the fire but also workers far away from the fire because of the ventilation airflow. In January 2006, two miners were fatally injured in an underground mine fire at the Aracoma Alma Mine in West Virginia, where they became separated from their crew while trying to escape from the fire. Their deaths were caused by the poisonous gas carbon monoxide (CO) generated during the burning of the conveyor belt. The ventilation airflow pushed the CO to the miners’ location at the time. This example demonstrates that to provide a safe escape route for underground miners in a mine fire incident, the ability to predict the movement of smoke and fire contaminants such as CO through the mine ventilation network is needed.
Much research has been conducted to study smoke and toxic gases transfer in a fire under a forced airflow in a ventilated tunnel. Those research results can also be applicable to a single mine entry of a mine ventilation network. Li et al. [1] conducted experimental model-scale tests and theoretical analyses to investigate the critical velocity and the back-layering length in tunnel fires. The authors found that the back-layering length can be related to the ratio of longitudinal ventilation velocity to critical velocity. Wang [2] studied the characteristics of the back-layering and the flame length of a tunnel fire using an Eddy Dissipation Concept-based combustion model. Brahim et al. [3] conducted computational fluid dynamics (CFD) simulations to examine the effect of the ventilation system on the smoke temperature distribution and stratification in tunnel fires. Sojoudi et al. [4] used the Fire Dynamics Simulator (FDS) to investigate the effect of ventilation velocity on the longitudinal profiles of temperature and CO concentration in a road tunnel fire. Hu et al. [5] modeled fire-induced smoke spread and CO transport in a long channel using FDS. Hu et al. [6] studied the longitudinal decay profiles of CO concentration and smoke temperature under different longitudinal ventilation velocities in tunnel fires.
Smoke control and CO spread in underground mine fires are more complicated than in tunnel fires because smoke and CO from a mine fire usually spread to multiple mine entries by way of the ventilation airflow. Tests were conducted by NIOSH to study the control of smoke in underground mine fires. Edwards et al. [7] conducted an experimental and modeling study on the effect of ventilation on smoke rollback in a mine entry. Friel et al. [8] investigated fire-generated smoke rollback through a crosscut from return to intake. Their experiments involved multiple mine entries in a ventilation network. However, limited research has been done to study the CO concentration changes in entries downstream of a mine fire. This information is imperative for developing optimum strategies for the installation of CO sensors for the early detection of mine fires. CO sensors are commonly used as part of atmospheric monitoring systems (AMS) in underground mines to detect conveyor belt fires, and can also be used to detect fires from diesel fuel storage areas, battery charging stations, and underground maintenance areas [9].
Unlike a tunnel fire, fire-generated smoke spreads to other mine entries through ventilation airflow or airflow leakage through temporary stoppings from one entry to another. The purpose of this study is to calibrate a CFD model using CO concentration data from fullscale mine fire tests and use the CFD model to investigate the effect of airflow leakage across temporary stoppings on the CO concentration reduction in the mine entries downstream of the fire source. MFIRE simulation is conducted to predict the CO spread in the entire ventilation network using a dynamic fire source generated from the CFD model.
2. Full-scale AMS tests
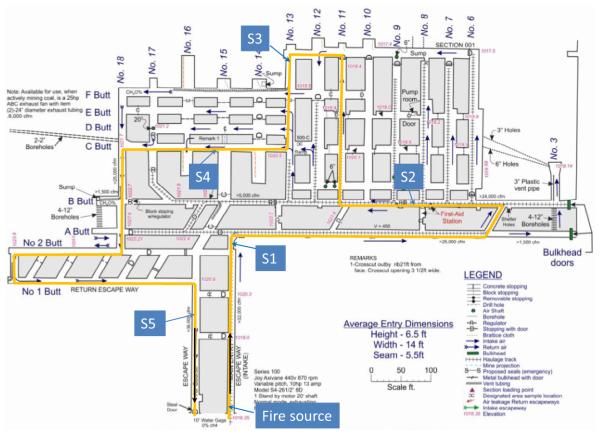
Full-scale fire experiments were conducted in the NIOSH Safety Research Coal Mine (SRCM) to evaluate different sensors for mine fire detection using an AMS [10]. In the tests, combustion products from different fires were transported by the ventilation airflow through the mine entries to five sensor stations along the airflow travel route. To investigate the smoke arrival time, only one airflow travel route was employed, using brattices as the temporary stoppings to isolate the airways. At each sensor station, CO and smoke sensors were installed near the roof to monitor the arrival of smoke and combustion products. Fig. 1 is a mine map of the SRCM showing the airflow travel route marked as orange and the locations of the sensor stations designated as S1, S2, S3, S4, and S5. The fire source was located along the main intake entry 75 m upstream of S1.
Fig. 1.
Schematic of the Safety Research Coal Mine (SRCM).
The CO sensors used in the tests are diffusion-type electrochemical sensors. Each CO sensor was calibrated before the test. Diesel fuel was used as one of the fire sources and the test data from the diesel fuel fire was used to calibrate the CFD model in this study. In the diesel fuel fire test, 5.7 liters of No. 2 diesel fuel were burned in a 0.6-m by 0.6-m pan for about 22 minutes. The airflow velocity measured at the inlet of the main intake entry before the test was 0.71 m/s.
Fig. 2 shows the measured CO concentrations at the first three sensor stations in the diesel fuel fire test. The peak CO value at S1 was 39 ppm, while the CO peak value decreased to 34 and 17 ppm, respectively, at S2 and S3. The distance from S1 to S2 is 165 m, and the distance from S2 to S3 is 150 m. It took a longer time for smoke to reach S3 from S2 than from S1 to S2. The measured airflow velocities at S1 and S3 show that the airflow rate at S3 was approximately one-sixth of that at S1, indicating that most of airflow leaked out the airflow travel route between S1 and S3.
Fig. 2.
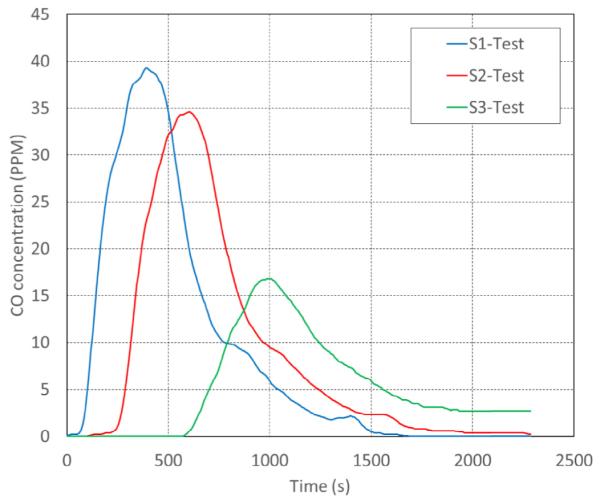
Measured CO concentrations at three sensor stations in the diesel fuel fire test.
3. CFD simulation
To provide insight into the effect of airflow leakage on CO concentration changes, a CFD simulation was conducted to study the mine fire and smoke spread in the mine entries using the FDS. FDS is a three-dimensional, large-eddy simulation CFD program developed by National Institute of Standards and Technology (NIST) for studying the transport of smoke and hot gases during a fire in an enclosure. It is the most widely used large-eddy simulation CFD model in the fire science field and has demonstrated good agreement with experimental data in numerous validation studies.
FDS solves the basic conservation equations for mass, momentum and energy for a Newtonian fluid.
Conservation of Mass:
Conservation of Momentum:
Conservation of energy:
Conservation of species
Here ρ is the density, u is the velocity vector, p is the pressure, g is the acceleration of gravity, h is the enthalpy, is the heat release rate per unit volume, is the conductive and radiative heat fluxes, Yi is the mass fraction of species i, Di is the diffusion coefficient of specice i, ε is the dissipation rate, and τ is the stress tensor defined as:
All spatial derivatives are approximated by second order central differences and the flow variables are updated in time using an explicit second order predictor-corrector scheme.
Because of the limitation of the available computer power, it is impractical to simulate the entire mine ventilation network in the SRCM, with the total length of the travel route in the SRCM test being more than 600 m. Therefore, the first 400 m of the travel route that covers the first three sensor stations was simulated.
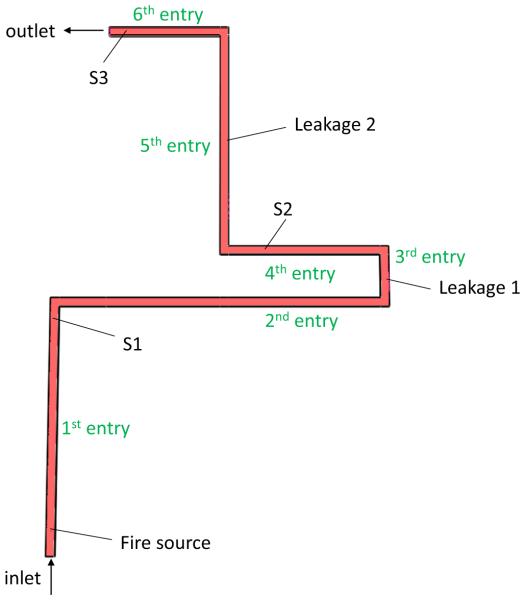
Fig. 3 shows the simulated travel route consisting of six entries. The width of each entry is 3 m and the height is 2 m. The fire source is located in the first entry, 8 m from the inlet of the entry. It is well known that grid size can affect the FDS simulation results. Therefore, it is important to determine an appropriate grid size to achieve the desired reliability. As suggested by McGrattan et al. [11], the grid size near the fire source should be no larger than 0.1D* to ensure reliable simulation results. D* represents the characteristic length scale for a fire source and is written as
Fig. 3.
Simulated mine entries and sensor locations for CFD simulation.
where Q is heat release rate (HRR) of fire, ρ is air density, Cp is the air specific heat, T0 is ambient temperature, and g is gravity acceleration. The heat release rate of the diesel fuel fire used in the AMS tests was about 500 kW. The corresponding value for D* is 0.72 m. Therefore, a grid size of 0.05 m was selected for the first entry where the fire source is located, while the 0.2-m grid size was used for other entries.
The grid independence was also examined by conducting CFD simulations with the grid size of 0.1 m, 0.07 m, 0.05 m, and 0.04 m, respectively. Fig. 4 shows the simulated gas temperatures at S1 under different grid sizes. It is evident that the grid size of 0.05 m can ensure a grid-independent result.
Fig. 4.
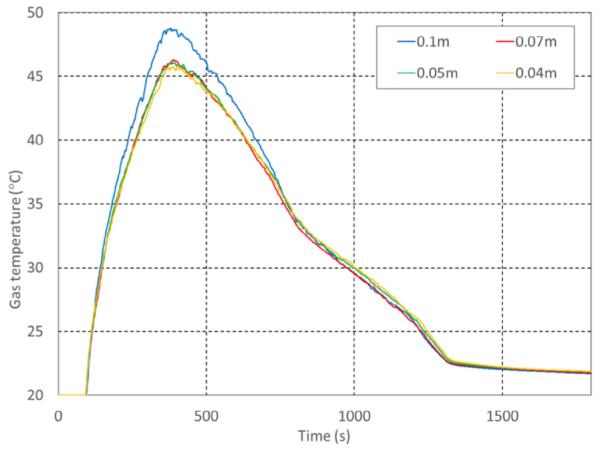
Simulated gas temperatures at S1 with different grid sizes.
CFD simulations were first conducted with an inlet airflow velocity of 0.7 m/s as the boundary condition, the same as measured in the AMS test, and there was no airflow leakage between the inlet and the outlet. Fig. 5 shows the CO concentrations at the three sensor stations from the simulation. The maximum CO concentrations at S2 and S3 were 37 and 36 ppm, respectively, slightly lower than the maximum value of 38 ppm measured at S1. Compared to the AMS test results shown in Fig. 2, the maximum CO concentration values at S2 and S3 were higher in the simulations, since there was no airflow leakage in the entries.
Fig. 5.
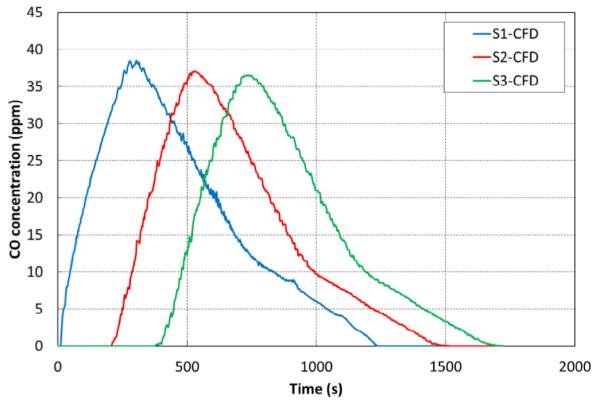
CFD-simulated CO concentrations at three sensor stations without airflow leakage.
To study the effect of airflow leakage on the CO concentration, airflow leakages were added to the 3rd and 5th entries, designated as leakage 1 and leakage 2, by creating additional outlets (leakage pathways) in those two entries. The height of the leakage pathway was 2 m. The width of the leakage pathway was adjusted to have the airflow rate at the sensor station from the CFD simulation match the measured value in the test. Fig. 6 shows the comparison of simulated CO concentrations and the measured CO values at three sensor stations. The simulation results are in good agreement with the test results except that the CO arrived at S3 in the simulation about 2 min later than in the test. This may be caused by possible multiple airflow leakages between S1 and S3 in the test while only two leakage areas were used in the simulation. It is not practical to determine the exact airflow leakage locations and leakage areas in the test because of the many mine entries involved. Nevertheless, these results indicate that CFD model is able to model the CO spread in the entries close to the fire source with appropriate consideration of airflow leakages.
Fig. 6.
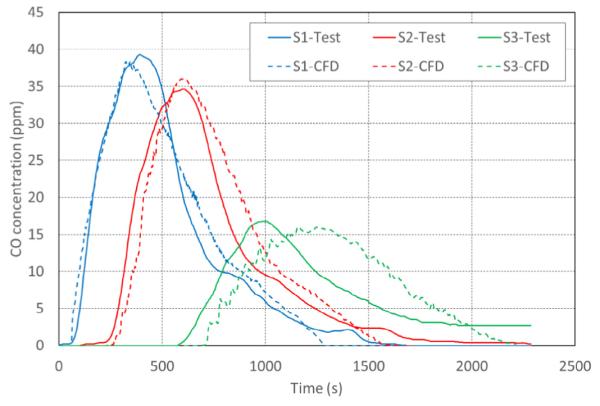
Comparisons of measured and CFD-simulated CO concentrations at three sensor stations.
4. Effect of airflow leakage on CO concentration
In the CFD simulation with airflow leakage, the calculated airflow rate at S1 was 4.3 m3/s. The airflow rate dropped to 3.1 m3/s at S2, and further dropped to 0.7 m3/s at S3. It is interesting to note that even though the airflow rate of 1.2 m3/s leaked out of the travel route from S1 to S2, the maximum CO concentration only decreased from 38 ppm at S1 to 36 ppm at S2. However, the maximum CO concentration decreased from 36 ppm at S2 to 16 ppm at S3, while the leakage airflow rate was 2.4 m3/s between S2 and S3. These results indicate that the leakages at those two locations had different effects on the CO concentration reduction. To investigate the reason that caused this difference, the airflow velocities at two leakage locations were examined. The boundary conditions for the two airflow leakages are the pressure boundary conditions with outside pressure equal to an ambient pressure.
Fig. 7 shows the leakage airflow velocity at the first leakage location between S1 and S2 for two points, one upper point 1.8 m from the floor, and one lower point 0.4 m from the floor. Fig. 8 shows the leakage airflow velocity at the second leakage location for the same two points between S2 and S3. At the first leakage location, the velocities at the two points were positive, indicating that the airflow leaked out at both upper and lower parts of the leakage location. The leakage velocity was much higher at the upper point than at the lower point. However, at the second leakage location, the airflow leakage was out of the entry at the upper point, while the velocity at the lower point was negative after about four minutes, indicating that fresh air leaked into the entry at the lower point of the leakage location. The inflow of fresh air into the entry caused the CO concentration to be reduced significantly. The lower air velocity at the second leakage location, less than 0.5 m/s, is likely the reason why this inflow of fresh air into the entry only occurred at the second leakage location but not at the first leakage location.
Fig. 7.
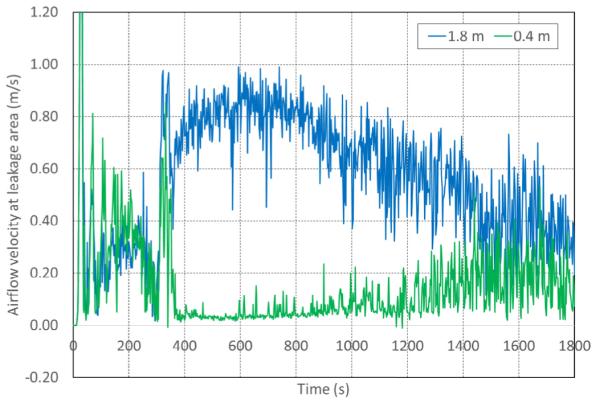
Leakage airflow velocities at two points at the first leakage area: 1.8 m and 0.4 m from the floor.
Fig. 8.
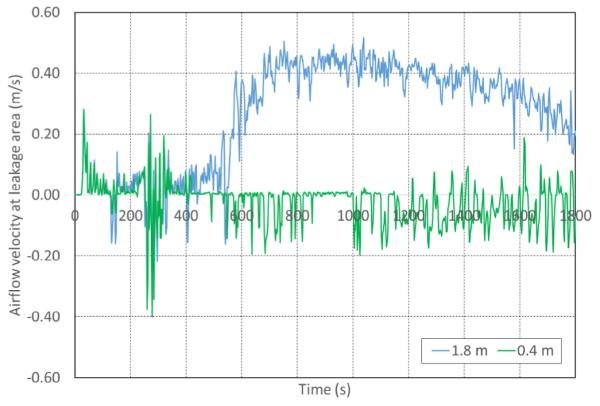
Leakage airflow velocities at two points at the second leakage area: 1.8 m and 0.4 m from the floor.
The airflow leakage not only reduced the maximum CO concentration value but also affected the CO concentration profiles at different heights in the entry. Fig. 9 shows the CO concentration profile at S1. After traveling 75 m from the fire source, the CO concentrations were stratified. The maximum CO value occurred at the roof. As the distance below the roof increased, the CO concentration decreased. The CO concentration profile at 0.4 m from the floor fluctuated significantly and was not plotted on the figure. Fig. 10 shows the CO concentration profile at the middle of the first leakage location. It is apparent that CO concentration became uniformly distributed over the cross-sectional area from the roof to the floor, with all of the maximum CO values between 37 and 40 ppm. The CO concentration profile was uniform at S2, as shown in Fig. 11, with the maximum CO value slightly reduced compared to that at S1. The CO concentration profile at the second leakage location is shown in Fig. 12. Because of the inflow of fresh air at the lower part of the leakage location, the CO concentration was diluted and the uniformity could not be maintained, with the maximum CO of 32 ppm near the roof and the maximum value of 8 ppm 0.4 m above the floor. The CO concentration also fluctuated significantly. At S3, the CO concentration profile fluctuated less, as shown in Fig. 13. For the purpose of comparison with the CO concentration profiles at S1 and S2, the simulation was stopped at 1800 s, even though the CO concentrations were still decreasing.
Fig. 9.
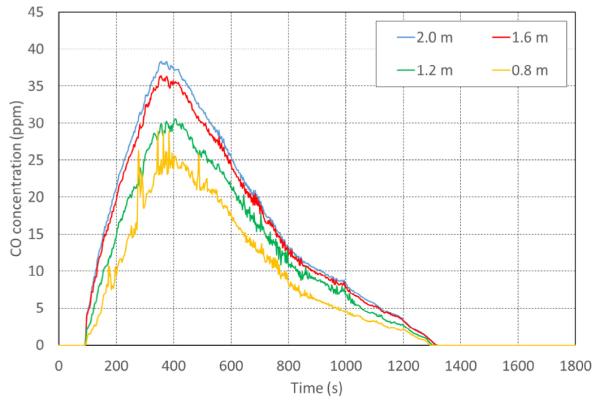
CFD-simulated CO concentration profiles at S1 for different heights from the floor.
Fig. 10.
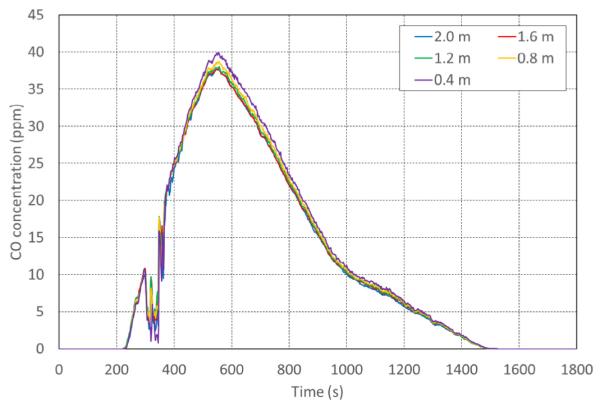
CFD-simulated CO concentration profiles at leakage 1 for different heights from the floor.
Fig. 11.
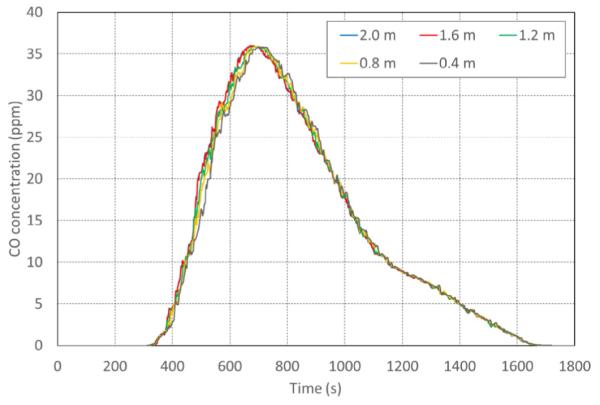
CFD simulated CO concentration profiles at S2 for different heights from the floor.
Fig. 12.
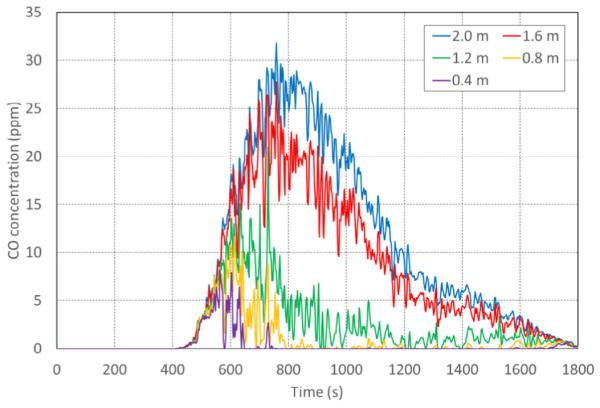
CFD-simulated CO concentration profiles at leakage 2 for different heights from the floor.
Fig. 13.
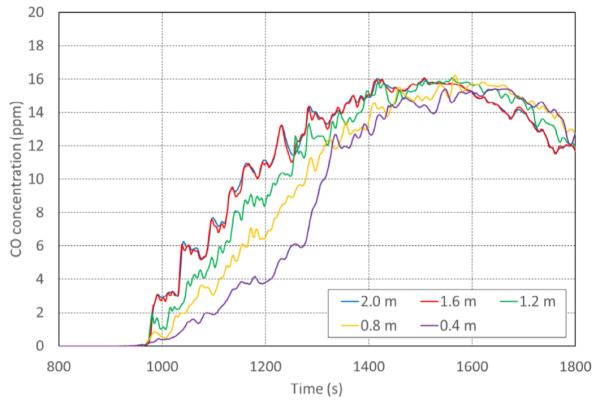
CFD-simulated CO concentration profiles at S3 for different heights from the floor.
It is worth noting that the airflow leakage also influenced the CO travel time. The CO travel time is defined as the time that it takes for the CO concentration to first reach 10 ppm at a certain location. Fig. 14 shows the relationship between the CO travel time and the distance from the fire source. Before reaching the first leakage location, the CO traveled with a nearly constant velocity of 0.74 m/s. This is in good agreement with the findings from Hu et al. [5] that CO travel time in tunnel fires increased linearly with the distance from the fire. However, the CO traveled at a reduced and nearly constant velocity of 0.35 m/s after passing the first leakage location. After passing the second leakage location, the CO travel time varied. As the distance from the fire source increased further, the CO travel velocity decreased, as indicated by the slope of the plot.
Fig. 14.
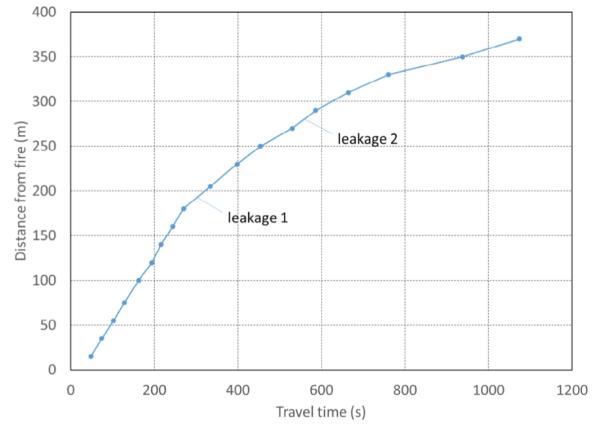
CFD-simulated CO travel time versus distance from the fire source.
5. MFIRE simulation
Although the CFD model can simulate a mine fire and smoke spread in great detail, the model is not able to simulate the smoke spread in a mine ventilation network consisting of hundreds of mine entries typical of modern U.S. mines because of the huge number of mesh cells that are needed to obtain reliable results. To simulate the smoke spread in a large mine ventilation network, a onedimensional ventilation network-based mine fire simulation program, MFIRE, is needed. MFIRE is a major mine fire simulation program widely used in the mining industry, originally developed by Michigan Technological University in cooperation with the Bureau of Mines. In 2010, MFIRE was redesigned and restructured with an object-oriented language and released as MFIRE 3.0 [12]. MFIRE 3.0 has been integrated into several major mine ventilation network simulation programs such as VnetPC, ICAMPS, VentSim, and VUMA. A new mine fire simulation feature was also added to MFIRE to predict smoke rollback in a mine fire [13].
MFIRE is a computer simulation program that performs normal ventilation network planning calculations, and dynamic transient state simulation of ventilation networks under a variety of conditions including the influence of natural ventilation, fans, and fires. A mine ventilation network consists of hundreds even thousands of junctions and interconnecting lines called branches or airways which denote major or significant airflow routes. The basic governing equations in a network problem are based on these theories: (1) the mass conservation law, (2) the constitutive equations, and (3) the law of energy conservation. A large set of governing equations are solved iteratively by the Hardy Cross method. An underground mine fire may develop and spread under the influence of the mine ventilation system, and therefore disturb or disrupt the air movements in the network. MFIRE is a computer simulator taking into account the mutual influences of fire intensities and ventilation conditions.
MFIRE simulations were conducted to study the smoke spread in the mine entries as described in the full-scale AMS tests. Before the simulation, a thorough mine ventilation survey was conducted to obtain the frictional pressure drop and the corresponding airflow rate for each of the main entries of the ventilation network, and the fan performance curve at the SRCM. The resistances and k-factors determined for each entry were used in the ventilation network modeling. To simulate a mine fire using MFIRE, a constant heat release rate for the fire needs to be specified in the input data file. Based on the amount of diesel fuel burned and the duration of the burning, the estimated heat release rate of the diesel fuel fire was about 500 kW. Using this fixed heat release rate, the calculated CO concentration at each sensor station was nearly a constant: 39 ppm, 36 ppm, and 15 ppm, respectively. The CO concentration value at each station occurred immediately when the CO reached the station and stayed as a constant before a sharp decline. This was not in a good agreement with the test results shown in Fig. 2.
To better simulate the CO concentration profiles, a more accurate description of the fire source in MFIRE is needed. In this study, the dynamic HRR data for the diesel fuel fire produced from the CFD simulation were used as the input for the MFIRE simulation, as shown in Fig. 15. Modifications were made to the MFIRE code to directly input the dynamic HRR data into MFIRE. With the dynamic HRR data, the simulated CO concentration results were in much better agreement with the test results compared to those results from the fixed HRR data. The comparisons between the test results and the simulations using both the fixed HRR and the dynamic HRR are shown in Figs. 16–18. With the fixed HRR, the simulated CO concentration increased to the high value quickly and stayed at the maximum value before a sharp decline. With the dynamic HRR, the simulated CO concentration increased to the maximum value, then decreased slowly following the same pattern as the test result. As the distance from the fire source increased, the simulation accuracy seemed to decrease. At S3, the simulated CO concentration reached a maximum value of 12 ppm – a little lower than the maximum value of 17 ppm from the test. This discrepancy is likely caused by the difficulty in determining the resistance value for each entry accurately.
Fig. 15.
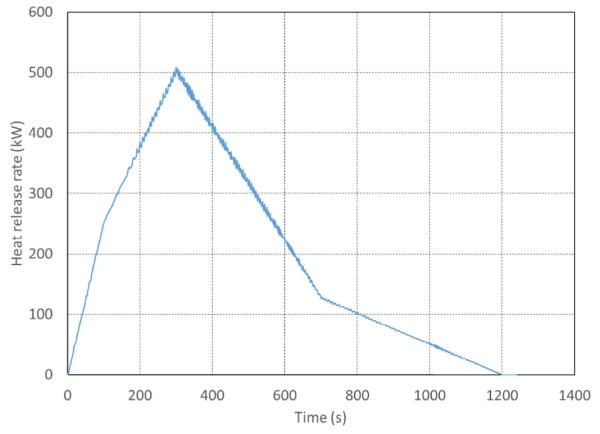
Dynamic HRR data generated using FDS.
Fig. 16.
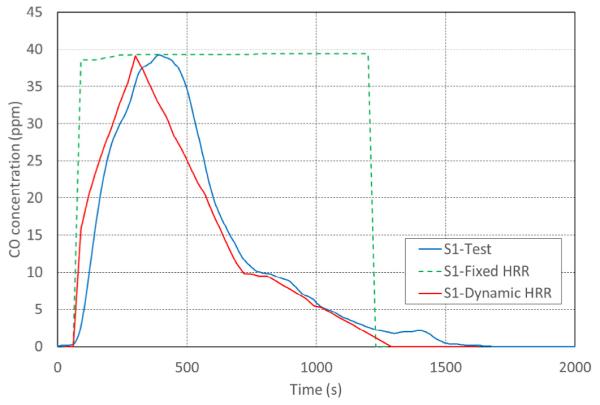
Comparison of CO concentrations at S1 between the MFIRE simulation and the test.
Fig. 17.
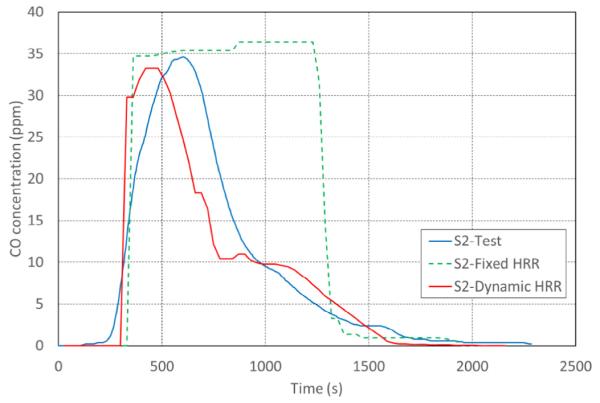
Comparison of CO concentrations at S2 between the MFIRE simulation and the test.
Fig. 18.
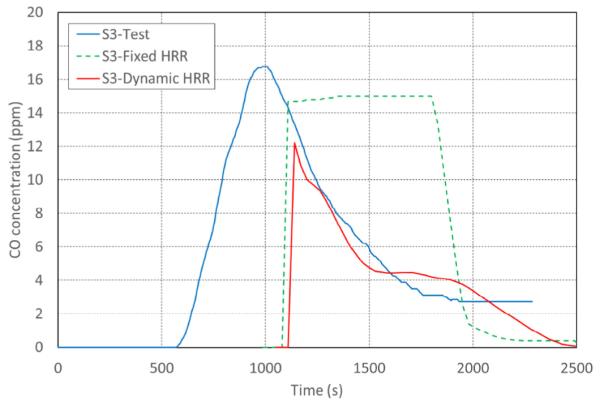
Comparison of CO concentrations at S3 between the MFIRE simulation and the test.
Compared to a CFD program such as FDS, MFIRE can simulate a mine fire event in a ventilation network consisting of many mine entries and the simulation takes a much shorter time. In the MFIRE simulation for the SRCM, the mine ventilation network included 165 mine entries and the simulation took less than one minute for the fire event of 30 minutes. Therefore, MFIRE can be a useful tool for mine fire escape, and mine rescue and emergency training. As MFIRE is a one-dimensional network simulation program, it is important to have an accurate resistance value for each mine entry to ensure a correct calculation of airflow rates in every entry.
6. Conclusions
Numerical simulations of CO spread in underground mine fires were conducted using the CFD program FDS and the network simulation program MFIRE. Because of the constraint of the computer power, FDS could only simulate a limited number of mine entries of the SRCM ventilation network. However, CFD simulations generated more detailed information, such as airflow velocity, pressure, gas concentration, and temperature at each mesh cell of the simulated domain, and provided insight into complicated thermal gas flow and heat transfer problems. MFIRE was used to simulate a mine ventilation network of many entries and provide information such as gas concentration and temperature along the length of each mine entry.
In this study, the CFD model was calibrated using full-scale AMS testing results and then used to examine the CO concentration reduction from the airflow leakages. Simulation results indicate that when the airflow velocity was low (below 0.5 m/s in this study), fresh air leaked into the mine entry at the lower part of the leakage location while smoke leaked out at the upper part of the leakage location. The inflow of fresh air at the lower part of the leakage location caused significant CO concentration reduction in the mine entry. The inflow of fresh air also caused the CO concentration profile to be less uniform. The CO traveled at a nearly constant velocity before the leakage. The CO travel speed was reduced after the leakage and was no longer constant after the inflow of the fresh air at the second leakage location.
MFIRE was then used to simulate the CO spread in the entire ventilation network of the SRCM. The simulation using the fixed HRR resulted in a constant CO concentration before a sharp decline. A dynamic HRR data set produced from the CFD simulation was used as input in the MFIRE simulation with the modification of MFIRE code. Simulation results demonstrated that the utilization of a dynamic HRR data set for the MFIRE greatly improved the accuracy of the simulation results. This improved method will make MFIRE a more effective program to predict smoke and toxic gas spread in the mine ventilation network in a fire incident, and an important tool for mine escape and mine emergency training.
Acknowledgements
The authors wish to thank James Rowland, Rick Thomas, and John Soles of the Office of Mine Safety and Health Research for conducting the full-scale AMS test. The findings and conclusions in this report are those of the authors and do not necessarily represent the views of the National Institute for Occupational Safety and Health.
References
- [1].Li YZ, Lei B, Ingason H. Study of critical velocity and backlayering length in longitudinally ventilated tunnel fires. Fire Saf. J. 2010;45:361–370. [Google Scholar]
- [2].Wang HY. Numerical and theoretical evaluations of the propagation of smoke and fire in a full-scale tunnel. Fire Saf. J. 2012;49:10–21. [Google Scholar]
- [3].Brahim K, Mourad B, Afif EC, Ali B. Control of smoke flow in a tunnel. J. Appl. Fluid Mech. 2013;6:49–60. [Google Scholar]
- [4].Sojoudi A, Afshin H, Farhanieh B, Saha SC. Large eddy simulation of smoke flow in a real road tunnel fire using FDS; Proceedings of the 4th International Conference on Computational Methods; Gold Coast, Australia. Nov, 2012. pp. 25–28. [Google Scholar]
- [5].Hu LH, Fong NK, Yang LZ, Chow WK, Li YZ, Huo R. Modeling fire-induced smoke spread and carbon monoxide transportation in a long channel: Fire Dynamics Simulator comparison with measured data. J. Hazard. Mater. 2007;140:293–298. doi: 10.1016/j.jhazmat.2006.08.075. [DOI] [PubMed] [Google Scholar]
- [6].Hu LH, Tang F, Yang D, Liu S, Huo R. Longitudinal distribution of CO concentration and difference with temperature field in a tunnel fire smoke flow. Int. J. Heat Mass Transf. 2010;53:2844–2855. [Google Scholar]
- [7].Edwards JC, Franks RA, Friel GF, Yuan L. Experimental and modeling investigation of the effect of ventilation on smoke rollback in a mine entry. Mining Eng. 2006;58:53–58. [Google Scholar]
- [8].Friel GF, Yuan L, Edwards JC, Franks RA. Fire-generated smoke rollback through crosscut from return to intake – experimental and CFD study; Proceedings of the 11th U.S./North American Mine Ventilation Symposium; University Park, PA June. 2006. [Google Scholar]
- [9].Smith AC, Litton CD. The use of atmospheric monitoring systems for fire detection in underground coal mines; Proceedings of the 15th US/North America Mine Ventilation Symposium; Blacksburg, VA, June. 2015. pp. 20–25. [Google Scholar]
- [10].Litton CD, Perera IE. Evaluation of sensors for mine fire detection using an atmospheric monitoring system. Mining Eng. 2015;67:68–75. [Google Scholar]
- [11].McGrattan KB, McDermott R, Hostikka S, Floyd JE. Fire Dynamics Simulator (version 5.5): User’s Guide, National Institute of Standards and Technology, 2010. NIST Special Publication 1019-5; [Google Scholar]
- [12].Smith AC, Glowacki AF, Yuan L, Zhou L, Cole GP. MFIRE3.0—NIOSH brings MFIRE into 21st century; Proceedings of the 14th US/North American Mine Ventilation Symposium; Salt Lake City, Utah. Jun, 2012. pp. 17–20. [Google Scholar]
- [13].Zhou L, Smith AC. Improvement of a mine fire simulation program – incorporation of smoke rollback into MFIRE 3.0. J. Fire Sci. 2011;30:29–39. [Google Scholar]


