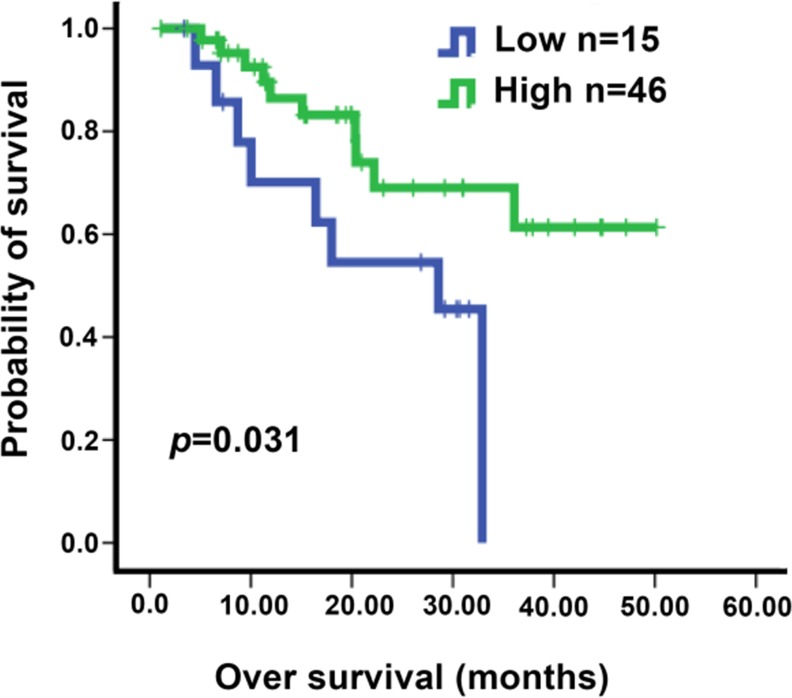
Figure 5. Kaplan-Meier analysis of overall survival according to EGFR IHC score in NSCLC patients.
Patients were all treated with gefitinib. The H scores of 100 was chosen as the cutoff point for separating tumors with high or low EGFR expression. The P value for the difference between the two curves was determined by the log-rank test (P = 0.031).

