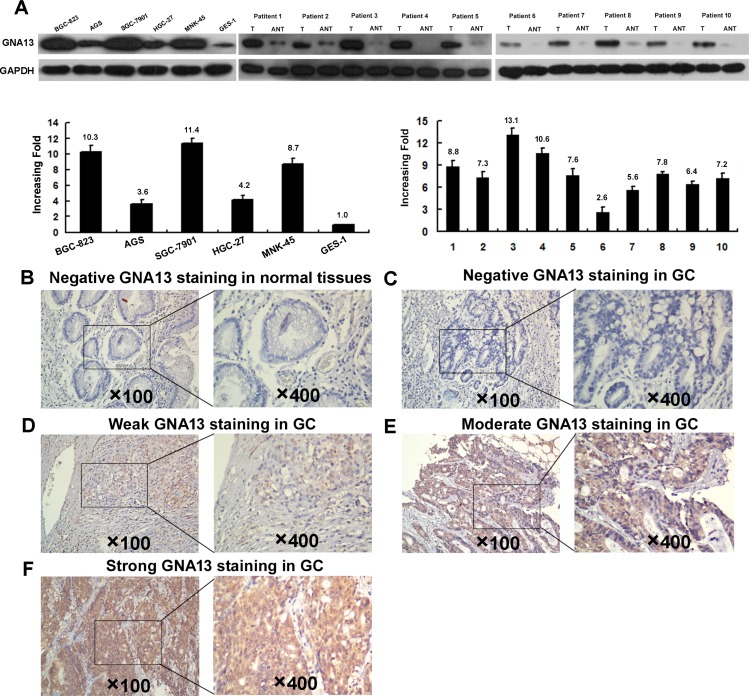
Figure 1. Western blotting, qPCR and IHC assay of the expression pattern of GNA13 in GC tissues and cell lines.
(A) Left panel: Western blotting (upper) and qPCR (lower) assay of GNA13 expression in GSE1 and 5 GC cell lines; Right panle: Western blotting (upper) and qPCR (lower) analysis of GNA13 protein expression in 10 pairs of matched GC tissues (T) and adjacent noncancerous tissues (ANT). GAPDH was used as a loading control. Representative image of negative GNA13 IHC staining (Scoring intensity = 0) (B) in normal gastric tissues. Representative images of weak (Scoring intensity = 1) (C), moderate (Scoring intensity = 2) (D) and strong (Scoring intensity = 3) (E) GNA13 IHC staining in GC tissues is shown.

