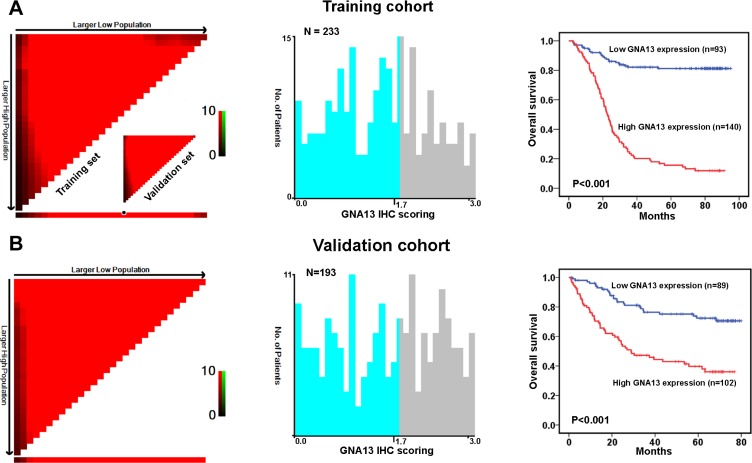
Figure 2. X-tile plots of the prognostic marker of GNA13 in the GC cohorts.
X-tile analysis was carried out on patient data from the training cohort, equally subdivided into training and validation subsets. X-tile plots of training sets are displayed in the left panels, with matched validation sets in the smaller inset. The plot showed the χ2 log-rank values created when the cohort was divided into two populations. The cut point was demonstrated on a histogram of the entire cohort (middle panels) and a Kaplan–Meier plot (right panels). P values were defined by using the cut point derived from a training subset to parse a separate validation subset. (A) GNA13 expression was divided at the optimal cut point, as defined by the most significant on the plot (with positive staining of GNA13; P < 0.001). (B) The optimal cut point for GNA13 expression determined by X-tile plot of the testing cohort was applied to the validation cohort and reached high statistical significance (P < 0.001).

