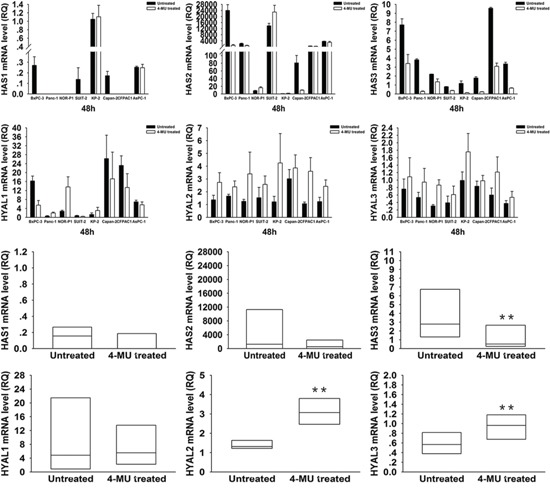
Figure 3. Changes in HAS1, 2, 3 and HYAL1, 2, 3 mRNA expressions in PDAC cells after treatment with 4-MU.

HAS3 mRNA expression was significantly decreased after treatment (P = 0.008, wilcoxon signed ranks test), while HYAL2 and HYAL3 were significantly increased after treatment (P = 0.008, wilcoxon signed ranks test). Each bar represents the mean ± SD of three replications.
