

Abstract
Fibroblast growth factor receptor 1 (FGFR1) has been suggested to be the candidate gene for 8p11–12 amplification in breast cancer and its therapeutic/prognostic value is explored. Most previous studies focused on FGFR1 gene amplification, which may not necessarily lead to protein expression. Therefore, analysis of protein level may have more clinical relevance. We evaluated FGFR1 expression in a large cohort of breast cancer by immunohistochemistry, correlated with the tumor clinic-pathologic features, biomarkers expression, and patient's survival. FGFR1 expression was associated mainly with luminal cancers, particularly luminal B subtype (23.5%; p < 0.001), and it also showed adverse prognostic impact on luminal A cancers. FGFR1 expression was associated with higher pN (p = 0.023), pT (p = 0.003) stages, lymphovascular invasion (p = 0.010), p-cadherin (p = 0.028), synaptophysin (p = 0.009) and SOX2 expression (p = 0.034) in luminal A cancers. FGFR1 expressing luminal A cancers showed a similar outcome as luminal B cancers. Multivariate Cox regression analysis demonstrated FGFR1 positive luminal A cancers to be an independently poor prognosticator for disease free survival in luminal cancers (hazard ratio = 3.341, p = 0.008). Thus FGFR1 could be useful in identifying the aggressive cases amongst heterogeneous luminal A cancers. Given the relevance of FGFR pathway in treatment resistance in luminal cancers, FGFR1 could be an important tumor biomarker and adverse prognostic factor potentially exploitable in the clinical management of luminal cancers.
Keywords: fibroblast growth factor receptor 1, breast cancer, luminal subtype, immunohistochemistry
INTRODUCTION
Breast carcinogenesis may involve genetic alterations including activation or amplification of oncogenes [1]. Amplification at 8p11–12 is frequent, being reported in approximately 10–15% of breast cancers [2, 3]. Fibroblast growth factor receptor 1 (FGFR1) which encodes for a tyrosine kinase receptor in the FGFR family (FGFR1–4), is suggested to be the candidate gene [2, 4].
FGFR1 plays critical functions in the normal mammary physiologic development and tissue homeostasis. It is expressed in the mammary epithelium during ductal morphogenesis. Prenatal deletion of FGFR1 resulted in delayed mammary gland development and a transient reduction in cellular proliferation [5]. In breast cancers, FGFR1 is mainly localized in the cytoplasm and cell membrane. Aberrant FGFR regulation or expression induced mammary tumor cell proliferation, anti-apoptosis, drug resistance, epithelial-to-mesenchymal transition (EMT) and invasion [6, 7]. Recent investigations have highlighted the potential clinical values of FGFR1 as a therapeutic target and prognostic biomarker in breast cancers. FGFR1 amplification might be important in the invasive transition processes [8]. More FGFR1 amplification was observed in invasive breast cancer than the non-invasive ductal carcinoma in situ [9]. In addition, FGFR1 amplification was associated with distant metastasis, early relapse and poor survival [3, 9–11], and contributed to poor prognosis in luminal breast cancers by driving anchorage independent proliferation and endocrine therapy resistance [10]. In triple negative breast cancers (TNBC), the role of FGFR1 is less clear. While one study showed no effect of FGFR1 amplification on patient survival [12], another study showed FGFR1 protein expression correlated with decreased OS [13]. Whether this discrepancy was related to analysis at gene or protein levels was uncertain. It was important to note that FGFR1 gene amplification did not necessarily lead to a high protein expression, as low protein expression level in FGFR1 amplified tumors had also been observed [10].
While most previous studies focused on the FGFR1 amplification in clinical breast cancers as a group, FGFR1 protein expression in different molecular breast cancer subtypes and its association with other important biomarkers and prognosis are far from clear. In this study, the expression of FGFR1 in a large cohort of breast cancer was evaluated and correlated with various clinic-pathological features, biomarker expression and outcome, as well as with different breast cancer molecular groupings.
RESULTS
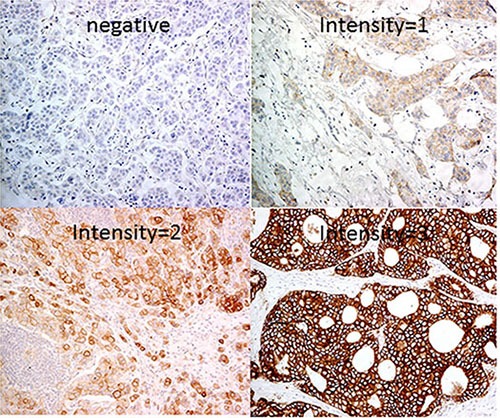
A total of 1,093 primary invasive breast cancers were included in this cohort. Details of the clinic-pathological features are summarized in Table 1. Overall, 941 cases (86.1%) were negative for FGFR1 and 152 cases (13.9%) were positive. Representative FGFR1 staining is shown in Figure 1.
Table 1. Correlations of FGFR1 expression with clinic-pathological features.
| FGFR1 Negative (%) | FGFR1 Positive (%) | Total | p Value | |
|---|---|---|---|---|
| Grade | 0.136 | |||
| 1 | 144 (90) | 16 (10) | 160 | |
| 2 | 375 (86.0) | 61 (14.0) | 436 | |
| 3 | 422 (84.9) | 75 (15.1) | 497 | |
| FF | 0.073 | |||
| Absence | 700 (87.3) | 101 (12.6) | 801 | |
| Presence | 220 (83.0) | 45 (17.0) | 265 | |
| Total | 920 (86.3) | 146 (13.7) | 1066 | |
| LVI | 0.066 | |||
| Absence | 651 (87.6) | 92 (12.4) | 743 | |
| Presence | 244 (83.3) | 49 (16.7) | 293 | |
| Total | 895 (86.4) | 141 (13.6) | 1036 | |
| pN | 0.042 | |||
| 0 | 481 (88.3) | 64 (11.7) | 545 | |
| 1 | 265 (83.9) | 51 (16.1) | 316 | |
| 2 | 113 (87.6) | 16 (12.4) | 129 | |
| 3 | 68 (79.1) | 18 (20.9) | 86 | |
| Total | 927 (86.2) | 149 (13.8) | 1076 | |
| pT | 0.037 | |||
| 1 | 389 (88.2) | 52 (11.8) | 441 | |
| 2 | 470 (84.5) | 86 (15.5) | 556 | |
| 3 | 48 (82.8) | 10 (17.2) | 58 | |
| 4 | 13 (76.5) | 4 (23.5) | 17 | |
| Total | 920 (85.8) | 152 (14.2) | 1072 | |
| Molecular | < 0.001 | |||
| Lum A | 403 (89.6) | 47 (10.4) | 450 | |
| Lum B | 287 (76.5) | 88 (23.5) | 375 | |
| HER2-OE | 106 (95.5) | 5 (4.5) | 111 | |
| BLBC | 60 (88.2) | 8 (11.8) | 68 | |
| 5NP | 77 (93.9) | 5 (6.1) | 82 | |
| Age | 0.062 | |||
| Mean | 55 (100.5) | 52.3 (95.6) | 54.7 | |
| SD | 12.9 (100.8) | 12 (93.8) | 12.8 | |
| Range | 22–97 | 28–91 | ||
| Tumor size | 0.017 | |||
| Mean | 2.63 | 2.9 | 2.67 | |
| SD | 1.491 | 1.5 | 1.5 | |
| Range | 0.2–13.9 | 0.3–9.5 |
BOLD: statistically significant
Figure 1. Representative immunohistochemical stainings of FGFR1 (200x).
Correlation with tumor clinic-pathological characteristics, molecular subtypes and biomarkers
FGFR1 expression was found to be associated with high pN (p = 0.042), pT (p = 0.037) stages and large tumor size (p = 0.017), but not with tumor grade, LVI, FF and patients’ age (Table 1).
Among the 1086 invasive cancers with complete data for IHC based molecular classification, 450 (41.4%) were Lum A, 375 (34.5%) were Lum B, 111 (10.2%) were HER2-OE and 150 (13.9%) were TNBC (including 68 cases (6.3%) of BLBC and 82 cases (7.6%) unclassified). The expression rate of FGFR1 was 10.4% in Lum A, 23.5% in Lum B, 4.5% in HER2-OE, and 17.9% in TNBC (11.8% in BLBC and 6.1% in unclassified) cancers. Significant difference in FGFR1 expression was found among different molecular subtypes (p < 0.001), with the highest expression rate seen in Lum B cancers (Table 1).
For biomarkers, FGFR1 expression correlated with overall high ER, Ki67, P63, SOX2 and markers of neuroendocrine differentiation (CG and SYN) (p ≤ 0.001 for all, except p = 0.038 for SOX2). There was no significant correlation with other biomarkers, including PR, EGFR, HER2, c-kit, CK5/6, CK14 and P-cadherin (Table 2).
Table 2. Correlations of FGFR1 expression with biomarkers.
| FGFR1 Negative (%) | FGFR1 Positive (%) | Total | p Value | |
|---|---|---|---|---|
| ER | < 0.001 | |||
| Neg | 299 (92.3) | 25 (7.7) | 324 | |
| Pos | 641 (83.4) | 128 (16.6) | 769 | |
| Total | 940 (86.0) | 153 (14.0) | 1093 | |
| PR | 0.969 | |||
| < 20% | 411 (86.0) | 67 (14.0) | 478 | |
| ≥ 20% | 524 (85.9) | 86 (14.1) | 610 | |
| Total | 935 (86.0) | 153 (14.0) | 1088 | |
| HER2 | 0.674 | |||
| Neg | 760 (85.6) | 128 (14.4) | 888 | |
| Pos | 189 (86.7) | 29 (13.3) | 218 | |
| Total | 949 (85.8) | 157 (14.2) | 1106 | |
| Ki67 | < 0.001 | |||
| < 20% | 699 (88.7) | 89 (11.3) | 788 | |
| ≥ 20% | 234 (78.5) | 64 (21.5) | 298 | |
| Total | 933 (85.9) | 153 (14.1) | 1086 | |
| P63 | 0.001 | |||
| Neg | 904 (86.5) | 141 (13.5) | 1045 | |
| Pos | 31 (72.1) | 12 (27.9) | 43 | |
| Total | 935 (85.9) | 153 (14.1) | 1088 | |
| CK5/6 | 0.814 | |||
| Neg | 837 (86.0) | 136 (14.0) | 973 | |
| Pos | 98 (85.2) | 17 (14.8) | 115 | |
| Total | 935 (85.9) | 153 (14.0) | 1088 | |
| CK14 | 0.118 | |||
| Neg | 881 (86.5) | 138 (13.5) | 1019 | |
| Pos | 55 (79.7) | 14 (20.3) | 69 | |
| Total | 936 (86.0) | 152 (14.0) | 1088 | |
| P-cadherin | 0.733 | |||
| Neg | 713 (86.0) | 116 (14.0) | 829 | |
| Pos | 218 (85.2) | 38 (14.8) | 256 | |
| Total | 931 (85.8) | 154 (14.2) | 1085 | |
| CG | 0.001 | |||
| Neg | 902 (86.8) | 137 (13.2) | 1039 | |
| Pos | 30 (66.7) | 15 (33.3) | 45 | |
| Total | 932 (86.0) | 152 (14.0) | 1084 | |
| SYN | < 0.001 | |||
| Neg | 854 (87.0) | 127 (13.0) | 981 | |
| Pos | 81 (75.7) | 26 (24.3) | 107 | |
| Total | 935 (86.0) | 153 (14.0) | 1088 | |
| Sox2 | 0.038 | |||
| Neg | 343 (84.9) | 61 (15.1) | 404 | |
| Pos | 81 (76.4) | 25 (23.6) | 106 | |
| Total | 424 (83.1) | 86 (16.9) | 510 |
*statistically significant
FGFR1 expression in luminal subtypes
Given the significant correlation of FGFR1 the luminal subtypes, the relationship of FGFR1 with clinical features was investigated for luminal subtypes separately. FGFR1 was expressed in 134 out of 824 cases (16.3%) and 18 out of 261 cases (6.9%) of luminal and non-luminal cancers respectively.
In Lum cancers, FGFR1 expression was associated with high tumor grade (p = 0.005), pN (p = 0.004) and pT stages (p = 0.001), large tumor size (p = 0.001), and the presence of LVI (p = 0.031) (Table 3). For biomarkers, FGFR1 expression was positively associated with high Ki67 (p < 0.001), p-cadherin (p = 0.011), CG (p = 0.007), SYN (p = 0.001) and SOX2 (p = 0.013) but negatively with PR (p = 0.003). In addition, it was predominantly expressed in luminal B over luminal A subtype (p < 0.001) (Supplementary Table S2).
Table 3. Association of FGFR1 expression of clinic-pathological features and biomarker expression according to different luminal subtypes.
| Luminal A FGFR1 (%) | Luminal B FGFR1 (%) | |||||||
|---|---|---|---|---|---|---|---|---|
| Negative | Positive | Total | p-value | Negative | Positive | Total | p-value | |
| Clinic-pathological features | ||||||||
| Grade | 0.124 | 0.784 | ||||||
| 1 | 110 (92.4) | 9 (7.6) | 119 | 25 (78.1) | 7 (21.9) | 32 | ||
| 2 | 213 (89.5) | 25 (10.5) | 238 | 114 (77.0) | 34 (23.0) | 148 | ||
| 3 | 79 (85.9) | 13 (14.1) | 92 | 147 (76.2) | 46 (23.8) | 193 | ||
| Total | 402 (89.5) | 47 (10.5) | 449 | 286 (76.7) | 87 (23.3) | 373 | ||
| FF | 0.177 | 0.376 | ||||||
| Absence | 229 (90.9) | 30 (9.1) | 329 | 209 (78.0) | 59 (22.0) | 268 | ||
| Presence | 95 (86.4) | 15 (13.9) | 110 | 69 (73.4) | 25 (26.6) | 94 | ||
| Total | 394 (89.7) | 45 (10.3) | 439 | 278 (76.8) | 84 (23.2) | 362 | ||
| LVI | 0.010 | 0.972 | ||||||
| Absence | 309 (92.0) | 27 (8.0) | 336 | 172 (76.4) | 53 (23.6) | 225 | ||
| Presence | 78 (83.0) | 16 (17.0) | 94 | 95 (76.6) | 29 (23.4) | 124 | ||
| Total | 387 (90.0) | 43 (10.0) | 430 | 267 (76.5) | 82 (23.5) | 349 | ||
| pN | 0.023 | 0.279 | ||||||
| 0 | 225 (93.4) | 16 (6.6) | 241 | 138 (78.0) | 39 (22.0) | 177 | ||
| 1 | 117 (84.2) | 22 (15.8) | 139 | 76 (77.6) | 22 (22.4) | 98 | ||
| 2 | 38 (92.7) | 3 (7.3) | 41 | 42 (77.8) | 12 (22.2) | 54 | ||
| 3 | 14 (77.8) | 4 (22.2) | 19 | 27 (67.5) | 13 (32.5) | 40 | ||
| Total | 394 (89.7) | 45 (10.3) | 439 | 283 (76.7) | 86 (23.3) | 369 | ||
| pT | 0.003 | 0.330 | ||||||
| 1 | 207 (93.2) | 15 (6.8) | 222 | 102 (77.9) | 29 (22.1) | 131 | ||
| 2 | 174 (86.1) | 28 (13.9) | 202 | 156 (75.7) | 50 (24.3) | 206 | ||
| 3 | 10 (76.9) | 3 (23.1) | 13 | 17 (77.3) | 5 (22.7) | 22 | ||
| 4 | 3 (75.0) | 1 (25.0) | 4 | 3 (50.0) | 3 (50.0) | 6 | ||
| Total | 394 (89.3) | 47 (10.7) | 441 | 278 (76.2) | 87 (23.8) | 365 | ||
| Age | 0.282 | 0.720 | ||||||
| Mean | 56.7 | 54.5 | 56.4 | 52.3 | 52.0 | 52.2 | ||
| SD | 13.1 | 13.6 | 13.1 | 12.2 | 11.2 | 12.0 | ||
| Range | 30–97 | 28–91 | 22–85 | 31–89 | ||||
| Tumor size | 0.005 | 0.311 | ||||||
| Mean | 2.31 | 2.91 | 2.37 | 2.81 | 2.94 | 2.84 | ||
| SD | 1.16 | 1.54 | 1.22 | 1.78 | 1.61 | 1.73 | ||
| Range | 0.2–9.0 | 0.3–7.2 | 0.3–13.9 | 0.5–9.5 | ||||
| Biomarker | ||||||||
| ER | 0.490 | 0.137 | ||||||
| Neg | 17 (94.4) | 1 (5.6) | 18 | 36 (85.7) | 6 (14.3) | 42 | ||
| Pos | 386 (89.4) | 46 (10.6) | 432 | 251 (75.4) | 82 (24.6) | 333 | ||
| Total | 403 (89.6) | 47 (10.4) | 450 | 287 (76.5) | 88 (23.5) | 375 | ||
| P63 | 0.488 | 0.346 | ||||||
| Neg | 396 (89.6) | 46 (10.4) | 442 | 271 (77.0) | 81 (23.0) | 352 | ||
| Pos | 5 (83.3) | 1 (16.7) | 6 | 15 (68.2) | 7 (31.8) | 22 | ||
| Total | 401 (89.5) | 47 (10.5) | 448 | 286 (76.5) | 88 (23.5) | 374 | ||
| CK5/6 | 0.664 | 0.829 | ||||||
| Neg | 389 (89.6) | 45 (10.4) | 434 | 267 (76.3) | 83 (23.7) | 350 | ||
| Pos | 13 (86.7) | 2 (13.3) | 15 | 18 (78.3) | 5 (21.7) | 23 | ||
| Total | 402 (89.5) | 47 (10.5) | 449 | 285 (76.4) | 88 (23.6) | 373 | ||
| CK14 | 0.406 | 0.654 | ||||||
| Neg | 387 (89.8) | 44 (10.2) | 431 | 272 (76.4) | 84 (23.6) | 356 | ||
| Pos | 14 (82.4) | 3 (17.6) | 17 | 13 (81.3) | 3 (18.8) | 16 | ||
| Total | 401 (89.5) | 47 (10.5) | 448 | 285 (76.6) | 87 (23.4) | 372 | ||
| P-cadherin | 0.028 | 0.641 | ||||||
| Neg | 378 (90.4) | 40 (9.6) | 418 | 223 (76.9) | 67 (23.1) | 290 | ||
| Pos | 20 (76.9) | 6 (23.1) | 26 | 58 (74.7) | 20 (25.6) | 78 | ||
| Total | 398 (89.6) | 46 (10.4) | 444 | 281 (76.4) | 87 (23.6) | 368 | ||
| CG | 0.515 | 0.003 | ||||||
| Neg | 377 (90.0) | 42 (10.0) | 419 | 272 (77.9) | 77 (22.1) | 349 | ||
| Pos | 24 (85.7) | 4 (14.3) | 28 | 11 (50.0) | 11 (50.0) | 22 | ||
| Total | 401 (89.7) | 46 (10.3) | 447 | 283 (76.3) | 88 (23.7) | 371 | ||
| SYN | 0.009 | 0.030 | ||||||
| Neg | 347 (91.1) | 34 (8.9) | 383 | 250 (78.4) | 69 (21.6) | 319 | ||
| Pos | 54 (80.6) | 13 (19.4) | 67 | 35 (64.8) | 19 (35.2) | 54 | ||
| Total | 403 (89.6) | 47 (10.4) | 450 | 285 (76.4) | 88 (23.6) | 373 | ||
| Sox2 | 0.034 | 0.313 | ||||||
| Neg | 159 (88.8) | 20 (11.2) | 179 | 119 (75.8) | 38 (24.2) | 157 | ||
| Pos | 20 (74.1) | 7 (25.9) | 27 | 35 (68.6) | 16 (31.4) | 51 | ||
| Total | 179 (86.9) | 27 (13.1) | 206 | 154 (74.0) | 54 (26.0) | 208 | ||
Bold: statistically significant
Further analysis basing on the different Lum subtypes revealed that FGFR1 correlated with the high pN (p = 0.023), pT stages (p = 0.003), large tumor size (p = 0.005), the presence of LVI (p = 0.010), p-cadherin (p = 0.028), SYN (p = 0.009) and SOX2 (p = 0.034) expression in Lum A subtype only. There was no significant correlations with any clinicopathological features and most biomarkers (except for CG (p = 0.003) and SYN (p = 0.030)) in Lum B subtype (Table 3).
Relationship of FGFR1 expression with patient outcome in different molecular breast cancer subtypes
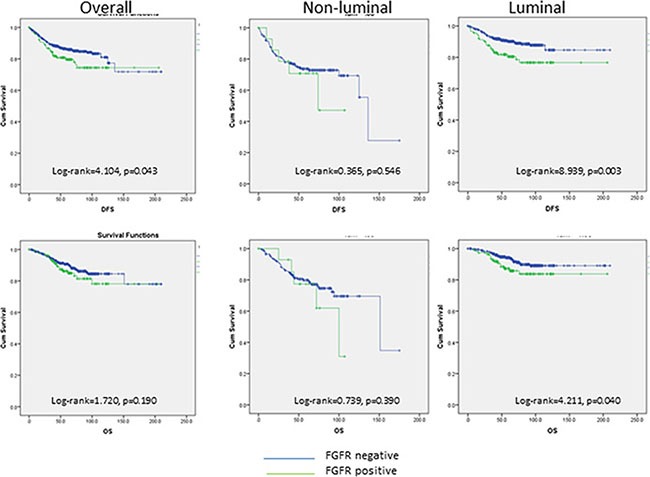
Follow-up data were available in 944 cases with a mean follow-up duration of 65.8 months (1–210 months). Overall, FGFR1 expression was associated with poor DFS (log- rank = 4.104, p = 0.043) but not OS (log- rank = 1.720, p = 0.190) (Figure 2). The associations with poor outcome were mainly observed in Lum cancers (DFS: log-rank = 8.939, p = 0.003; OS: log-rank = 4.211, p = 0.040) but not in non-Lum cancers (DFS: log-rank = 0.365, p = 0.546; OS: log-rank = 0.739, p = 0.390) (Figure 2).
Figure 2. Kaplan-Meier analysis of DFS and OS in overall, non-liminal and luminal cancers.
In fact, when subtypes of Lum cancers were analyzed, the poor DFS (log-rank = 10.951, p = 0.001) in FGFR1-expressing cancers was only observed in Lum A cancers, but not in Lum B cancers with or without FGFR1 expression (log-rank = 0.268, p = 0.605). The worse DFS in FGFR1 expressing Lum A cancers was comparable to that of luminal B cancers (compared to FGFR1-expressing luminal B: log-rank = 0.324, p = 0.569; FGFR1 negative luminal B: log-rank = 0.056, p = 0.812) (Figure 3). Multivariate cox regression analysis on DFS also showed that FGFR1 expression in different luminal subtypes together with grade, pT and pN stages were independent prognostic factor in Lum cancers (Lum A FGFR1 neg as reference: Lum A FGFR1 pos: HR = 3.341, p = 0.008; Lum B FGFR1 neg: HR = 2.789, p = 0.001; Lum B FGFR1 pos: HR = 2.500, p = 0.013) (Table 4).
Figure 3. Kaplan-Meier analysis of DFS according to luminal subtypes and FGFR1 expression.
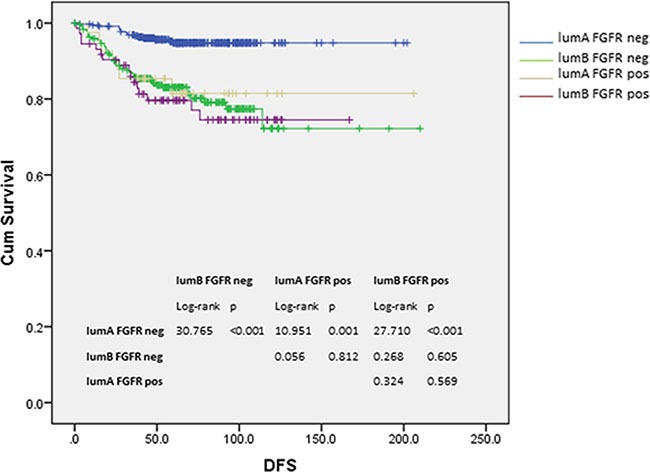
Table 4. Multivariate cox regression analysis for DFS in luminal cancers.
| p-value | HR | 95.0% CI | ||
|---|---|---|---|---|
| Lower | Upper | |||
| Initial step | ||||
| Grade | 0.009 | 1.711 | 1.142 | 2.563 |
| age | 0.885 | 1.001 | 0.982 | 1.021 |
| LVI | 0.185 | 1.424 | 0.844 | 2.405 |
| ER | 0.232 | 0.659 | 0.332 | 1.306 |
| PR | 0.128 | 0.624 | 0.340 | 1.145 |
| pT | < 0.001 | 2.140 | 1.418 | 3.229 |
| pN | < 0.001 | 1.656 | 1.302 | 2.106 |
| Lum A FGFR neg (ref) | 0.026 | |||
| Lum B FGFR neg | 0.014 | 2.270 | 1.182 | 4.358 |
| Lum A FGFR pos | 0.010 | 3.235 | 1.318 | 7.941 |
| Lum B FGFR pos | 0.022 | 2.410 | 1.132 | 5.131 |
| Final step | ||||
| Grade | 0.006 | 1.722 | 1.165 | 2.546 |
| pT | < 0.001 | 2.207 | 1.474 | 3.304 |
| pN | < 0.001 | 1.808 | 1.454 | 2.249 |
| Lum A FGFR neg (ref) | 0.005 | |||
| Lum B FGFR neg | 0.001 | 2.789 | 1.538 | 5.058 |
| Lum A FGFR pos | 0.008 | 3.341 | 1.372 | 8.136 |
| Lum B FGFR pos | 0.013 | 2.500 | 1.209 | 5.173 |
DISCUSSION
There are ongoing interests for FGFR as a prognostic marker and treatment target in breast cancer [18]. However, most studies focuses mainly on its gene amplification [3, 8–10, 12]. The FGFR amplicon is complex, composing of several candidate oncogenes which may drive cancer development [19]. In fact, while high FGFR1 protein expression was related to gene amplification, the reverse may not be true [10, 12, 20, 21]. Therefore, this study was designed to investigate FGFR1 protein expression in a large cohort of breast cancers by IHC staining. The relationship of FGFR1 expression with multiple relevant clinicopathologic features, tumor biomarker panels as well as the prognostic value in different molecular subtypes of breast cancer was investigated. The overall FGFR1 expression rate in breast cancer was 14.3%, occurring predominantly in Lum B cancers (24.9%). This observation was concordant with its reported gene amplification [10]. Little has been reported regarding the clinicopathologic and biomarker association of FGFR1 protein expression in breast cancer. One study that analyzed FGFR1 amplification by FISH on TMA did not demonstrate any association with histologic parameters, including grade, size, nodal status, vascular invasion or a number of biomarkers [3]. We observed significant correlation of FGFR1 expression with high tumor pN, pT stages, large tumor size, and increased expression of several biomarkers (ER, Ki67, P63, CG, SYN and SOX2). Its positive association with ER and Ki67 expression corroborated its prevalence in Lum B cancer subtype. FGFR signaling is one of the most common pathways implicated in controlling stemness [22]. Here, we observed a positive association of FGFR1 with the transcriptional factor SOX2 with neural stem cell renewal [23], and particularly with neuroendocrine differentiation in breast cancer.
Previously, we reported the specific association of SOX2 with expression of hormonal receptor and neuroendocrine differentiation in breast cancers [20]. Given the role of SOX2 in neural stem cell renewal, its expression have been reported in other types of neuroendocrine tumor [21–23]. Of interest, FGFR1 expression was also related to cancers with neuroendocrine differentiation. High copy number gain of FGFR1 was detected in pulmonary neuroendocrine tumors [24]. Ectopic expression of FGFR1 in mouse prostate cancer model was shown to associate with the acquisition of an aggressive neuroendocrine phenotype and metastasis [25]. However, the underlying mechanism for these observations was not completely clear. Notably, previous study has shown that blocking FGF signaling with FGFR1 inhibitor can reduce the level of SOX2 expression [26]. FGF signaling could control osteoblast differentiation through induction of SOX2 and regulation of the Wnt-β-catenin pathway [27]. Together with the current findings, we postulated that FGFR1 expression could regulate SOX2 expression and subsequently neuroendocrine differentiation in breast cancer.
Another interesting finding was the association of FGFR1 expression with poor outcome in Lum cancer. We found that FGFR1 expression was predominantly in luminal cancers, in particularly Lum B cancers. Concordantly, a significant association with the related biomarkers can be demonstrated. A significant association of FGFR1 with ER and Ki67 in the overall cohort while significant correlation with low PR and high Ki67 as well as a near significance with HER in luminal cancers were observed. Although there was a lack of association with PR and HER2 in the overall cohort, both luminal B and non-luminal cancers exhibited low PR and high HER2 expression. High FGFR1 was in the former and low was in the latter subtypes. The opposite relationship of FGFR1 with different subtypes could nullify its association with PR and HER2. By contrast, FGFR1 expression associated with Ki67 regardless of subtypes. FGFR1 activation has shown to induce proliferation in breast cancer [28]; thus its expression could have a direct cause-effect on increased Ki67 rather than merely an epiphenomenon. FGFR1 amplification was shown to be associated with poor outcome in hormone receptor-positive breast cancer and resistance to endocrine therapy [3, 9, 10]. Interestingly, here, we showed that its prognostic impact mainly associated with Lum A cancers. The FGFR1 expression in Lum A subtype was shown to be an independent prognostic feature. It had a similar hazard ratio as luminal B cancers for DFS. In addition, it correlated with poor prognostic features positively, including LVI, high pT, pN and P-cadherin expression mainly in Lum A. Lum B cancers are genetically and genomically altered to a greater extent than Lum A cancers [29]. Apart from FGFR1, other genes overexpressed in Lum B have also shown to affect cancer growth and patients outcome [30]. It appeared that multiple drivers could be involved in Lum B cancers. Lum A subtype is a diverse and the most frequent subtype in breast cancer. Within this subtype, four major subgroups, namely 1p/16q, copy number quiet, chr8-associated and copy number high (CNH), have been identified recently by genomic analysis [31]. CNH subgroup has shown to have poor prognosis. However, the prognostication in other subgroups, including Chr8-associated subgroup which associated with focal FGFR1 amplification, has not been reported. Our data showing poor outcome of FGFR1 expressing Lum A cancers may implicate the poor prognostication also for this Chr8-associated subgroup [31]. In the Chr8-associated subgroup, MAP3K1 mutation was frequently found. FGFR signaling can cause persistent MAPK activation, subsequently leading to tamoxifen resistance [4]. It could contribute to the poor outcome in the FGFR1 expressing Lum A cancers. Our results may be useful in further stratification and thus management of tamoxifen resistant Lum A cancers.
In summary, FGFR1 protein expression was shown to be associated with Lum cancers. Although it is more prevalent in Lum B subtype, its expression showed adverse prognostication significance in only Lum A cancers. FGFR-expressing Lum A cancers showed a similar outcome as Lum B cancers, suggesting its role in identifying the aggressive subset of the heterogeneous Lum A cancers. Agents targeting FGFR pathway are currently actively explored as breast cancer treatment, which could be especially relevant for tamoxifen resistant Lum A cancer.
MATERIALS AND METHODS
Patients and database
The histologic files of the 3 involved institutions were searched for breast carcinoma over a period of 4 (2002–2005), 7 (2003–2009), and 2 (2003–2004) years respectively. All consecutive cases with excision specimens were included. The study was approved by Joint Chinese University of Hong Kong—New Territories East Cluster clinical research ethics committee. All the specimens were routinely processed and stained with hematoxylin and eosin (H & E). All the slides form all the cases were reviewed, graded (modified Bloom and Richardson) [32], and histotyped (WHO 2012) by two pathologists separately in a blinded manner [33]. Lymphovascular invasion (LVI) and fibrotic focus (FF) were also evaluated as present or absent, as previously reported criteria [2]. Patients’ age, tumor size, lymph node involvement, pN stage, pT stage, and outcome data were retrieved from the medical records. Overall survival (OS) was defined as the time interval from the date of initial diagnosis to the date of breast cancer related death. Disease free survival (DFS) was defined as the duration from the date of initial diagnosis to the first detection of breast cancer specific relapse or death. If no relapse or death observed, the survival time was censored at the last follow up visit.
Tissue microarray (TMA) construction and immunohistochemistry
TMAs containing representative tumor areas were constructed with duplicated 0.6-mm cores as previously described [18]. The TMAs were assembled with a tissue arrayer (Beecher Instruments, Silver Springs, MD). One section from each TMA was stained with H&E and reviewed to confirm the presence of representative tumors. Immunohistochemical (IHC) staining was performed on the TMA with the selected antibodies using Ultraview Universal DAB Detection Kit (Ventana, Tucson, AZ) after deparaffinization, rehydration, and antigen retrieval of the slides. All slides were counterstained with hematoxylin. The TMA slides were assessed for the staining intensity, and the actual percentage of stained cells in the nucleus, cytoplasm, or membrane according to different antibodies by 2 of the authors blinded to the clinical information and the staining results of other markers. For FGFR1 staining, the reactivity was assessed both membranous and cytoplasmic. The staining was considered positive when unequivocal staining was detected in at least 1% of tumor cells [13]. Several groups of other markers were examined, including basal markers (EGFR, c-kit, p63, CK5/6 and CK14), markers related to stem cell features (SOX2 and p-cadherin), neuroendocrine markers (chromogranin (CG) and synaptophysin (SYN)), hormonal receptors (ER and PR) and other common cancer markers (HER2 and Ki67). The staining was considered positive when there was moderate or strong immune reactivity at the appropriate location over the cut-off point. Any discordant results were resolved by reading the slides at a multi-head microscope and discussed. Further details of the IHC stainings and their assessment are shown in Supplementary Table S1.
In addition, all cases were also classified into molecular subtypes basing on IHC surrogates, listed as follows [34, 35].
Luminal A (Lum A) (ER+, PR ≥ 20%, HER2−, Ki67 < 20%),
Luminal B (Lum B) (ER+, PR < 20% and/or HER2+ and /or Ki67 ≥ 20%), HER2-overexpressed (HER2-OE) (ER−, PR−, HER2+),
Basal-like breast cancer (BLBC) (ER−, PR−, HER2−, CK5/6+, and EGFR+),
Unclassified (5NP) (ER−, PR, HER2−, CK5/6−, EGFR−).
Statistical analysis
Statistical analysis was performed using SPSS for Windows, Version 21. For association between FGFR1 IHC staining and clinic-pathologic parameters, χ2 and Fisher exact tests were applied as appropriate. Survival analysis was accomplished using Kaplan–Meier method and comparison between groups was done using log-rank statistics. Multivariate cox regression analysis was performed to survival hazard ratios (HR) and corresponding 95% confidence intervals (95% CI) using the backwald method. Statistical significance was defined as p < 0.05.
SUPPLEMENTARY MATERIALS TABLES
Footnotes
CONFLICTS OF INTEREST
The authors declare no conflicts of interest.
REFERENCES
- 1.Network TCGA. Comprehensive molecular portraits of human breast tumours. Nature. 2012;490:61–70. doi: 10.1038/nature11412. [DOI] [PMC free article] [PubMed] [Google Scholar]
- 2.Dienstmann R, Rodon J, Prat A, Perez-Garcia J, Adamo B, Felip E, Cortes J, Iafrate AJ, Nuciforo P, Tabernero J. Genomic aberrations in the FGFR pathway: opportunities for targeted therapies in solid tumors. Ann Oncol. 2014;25:552–563. doi: 10.1093/annonc/mdt419. [DOI] [PMC free article] [PubMed] [Google Scholar]
- 3.Elbauomy Elsheikh S, Green AR, Lambros MB, Turner NC, Grainge MJ, Powe D, Ellis IO, Reis-Filho JS. FGFR1 amplification in breast carcinomas: a chromogenic in situ hybridisation analysis. Breast Cancer Res. 2007;9:R23. doi: 10.1186/bcr1665. [DOI] [PMC free article] [PubMed] [Google Scholar]
- 4.Turner N, Grose R. Fibroblast growth factor signalling: from development to cancer. Nat Rev Cancer. 2010;10:116–129. doi: 10.1038/nrc2780. [DOI] [PubMed] [Google Scholar]
- 5.Pond AC, Bin X, Batts T, Roarty K, Hilsenbeck S, Rosen JM. Fibroblast growth factor receptor signaling is essential for normal mammary gland development and stem cell function. Stem Cells. 2013;31:178–189. doi: 10.1002/stem.1266. [DOI] [PMC free article] [PubMed] [Google Scholar]
- 6.Heinzle C, Sutterluty H, Grusch M, Grasl-Kraupp B, Berger W, Marian B. Targeting fibroblast-growth-factor-receptor-dependent signaling for cancer therapy. Expert Opin Ther Targets. 2011;15:829–846. doi: 10.1517/14728222.2011.566217. [DOI] [PubMed] [Google Scholar]
- 7.Korc M, Friesel RE. The role of fibroblast growth factors in tumor growth. Curr Cancer Drug Targets. 2009;9:639–651. doi: 10.2174/156800909789057006. [DOI] [PMC free article] [PubMed] [Google Scholar]
- 8.Gru AA, Allred DC. FGFR1 amplification and the progression of non-invasive to invasive breast cancer. Breast Cancer Res. 2012;14:116. doi: 10.1186/bcr3340. [DOI] [PMC free article] [PubMed] [Google Scholar]
- 9.Jang M, Kim E, Choi Y, Lee H, Kim Y, Kim J, Kang E, Kim SW, Kim I, Park S. FGFR1 is amplified during the progression of in situ to invasive breast carcinoma. Breast Cancer Res. 2012;14:R115. doi: 10.1186/bcr3239. [DOI] [PMC free article] [PubMed] [Google Scholar]
- 10.Turner N, Pearson A, Sharpe R, Lambros M, Geyer F, Lopez-Garcia MA, Natrajan R, Marchio C, Iorns E, Mackay A, Gillett C, Grigoriadis A, Tutt A, et al. FGFR1 amplification drives endocrine therapy resistance and is a therapeutic target in breast cancer. Cancer Res. 2010;70:2085–2094. doi: 10.1158/0008-5472.CAN-09-3746. [DOI] [PMC free article] [PubMed] [Google Scholar]
- 11.Cuny M, Kramar A, Courjal F, Johannsdottir V, Iacopetta B, Fontaine H, Grenier J, Culine S, Theillet C. Relating genotype and phenotype in breast cancer: an analysis of the prognostic significance of amplification at eight different genes or loci and of p53 mutations. Cancer Res. 2000;60:1077–1083. [PubMed] [Google Scholar]
- 12.Lee HJ, Seo AN, Park SY, Kim JY, Park JY, Yu JH, Ahn JH, Gong G. Low prognostic implication of fibroblast growth factor family activation in triple-negative breast cancer subsets. Ann Surg Oncol. 2014;21:1561–1568. doi: 10.1245/s10434-013-3456-x. [DOI] [PubMed] [Google Scholar]
- 13.Cheng CL, Thike AA, Tan SY, Chua PJ, Bay BH, Tan PH. Expression of FGFR1 is an independent prognostic factor in triple-negative breast cancer. Breast Cancer Res Treat. 2015;151:99–111. doi: 10.1007/s10549-015-3371-x. [DOI] [PubMed] [Google Scholar]
- 14.Andre F, Cortes J. Rationale for targeting fibroblast growth factor receptor signaling in breast cancer. Breast Cancer Res Treat. 2015;150:1–8. doi: 10.1007/s10549-015-3301-y. [DOI] [PMC free article] [PubMed] [Google Scholar]
- 15.Gelsi-Boyer V, Orsetti B, Cervera N, Finetti P, Sircoulomb F, Rouge C, Lasorsa L, Letessier A, Ginestier C, Monville F, Esteyries S, Adelaide J, Esterni B, et al. Comprehensive profiling of 8p11-12 amplification in breast cancer. Mol Cancer Res. 2005;3:655–667. doi: 10.1158/1541-7786.MCR-05-0128. [DOI] [PubMed] [Google Scholar]
- 16.Ray ME, Yang ZQ, Albertson D, Kleer CG, Washburn JG, Macoska JA, Ethier SP. Genomic and expression analysis of the 8p11-12 amplicon in human breast cancer cell lines. Cancer Res. 2004;64:40–47. doi: 10.1158/0008-5472.can-03-1022. [DOI] [PubMed] [Google Scholar]
- 17.Reis-Filho JS, Simpson PT, Turner NC, Lambros MB, Jones C, Mackay A, Grigoriadis A, Sarrio D, Savage K, Dexter T, Iravani M, Fenwick K, Weber B, et al. FGFR1 emerges as a potential therapeutic target for lobular breast carcinomas. Clin Cancer Res. 2006;12:6652–6662. doi: 10.1158/1078-0432.CCR-06-1164. [DOI] [PubMed] [Google Scholar]
- 18.Dvorak P, Dvorakova D, Hampl A. Fibroblast growth factor signaling in embryonic and cancer stem cells. FEBS Lett. 2006;580:2869–2874. doi: 10.1016/j.febslet.2006.01.095. [DOI] [PubMed] [Google Scholar]
- 19.Episkopou V. SOX2 functions in adult neural stem cells. Trends Neurosci. 2005;28:219–221. doi: 10.1016/j.tins.2005.03.003. [DOI] [PubMed] [Google Scholar]
- 20.Huang YH, Luo MH, Ni YB, Tsang JY, Chan SK, Lui PC, Yu AM, Tan PH, Tse GM. Increased SOX2 expression in less differentiated breast carcinomas and their lymph node metastases. Histopathology. 2014;64:494–503. doi: 10.1111/his.12257. [DOI] [PubMed] [Google Scholar]
- 21.Yu X, Cates JM, Morrissey C, You C, Grabowska MM, Zhang J, DeGraff DJ, Strand DW, Franco OE, Lin-Tsai O, Hayward SW, Matusik RJ. SOX2 expression in the developing, adult, as well as, diseased prostate. Prostate Cancer Prostatic Dis. 2014;17:301–309. doi: 10.1038/pcan.2014.29. [DOI] [PMC free article] [PubMed] [Google Scholar]
- 22.Sholl LM, Long KB, Hornick JL. Sox2 expression in pulmonary non-small cell and neuroendocrine carcinomas. Appl Immunohistochem Mol Morphol. 2010;18:55–61. doi: 10.1097/PAI.0b013e3181b16b88. [DOI] [PubMed] [Google Scholar]
- 23.Laga AC, Lai CY, Zhan Q, Huang SJ, Velazquez EF, Yang Q, Hsu MY, Murphy GF. Expression of the embryonic stem cell transcription factor SOX2 in human skin: relevance to melanocyte and merkel cell biology. Am J Pathol. 2010;176:903–913. doi: 10.2353/ajpath.2010.090495. [DOI] [PMC free article] [PubMed] [Google Scholar]
- 24.Voortman J, Lee JH, Killian JK, Suuriniemi M, Wang Y, Lucchi M, Smith WI, Jr, Meltzer P, Giaccone G. Array comparative genomic hybridization-based characterization of genetic alterations in pulmonary neuroendocrine tumors. Proc Natl Acad Sci USA. 2010;107:13040–13045. doi: 10.1073/pnas.1008132107. [DOI] [PMC free article] [PubMed] [Google Scholar]
- 25.Yang F, Gao Y, Geng J, Qu D, Han Q, Qi J, Chen G. Elevated expression of SOX2 and FGFR1 in correlation with poor prognosis in patients with small cell lung cancer. Int J Clin Exp Pathol. 2013;6:2846–2854. [PMC free article] [PubMed] [Google Scholar]
- 26.Millimaki BB, Sweet EM, Riley BB. Sox2 is required for maintenance and regeneration, but not initial development, of hair cells in the zebrafish inner ear. Dev Biol. 2010;338:262–269. doi: 10.1016/j.ydbio.2009.12.011. [DOI] [PMC free article] [PubMed] [Google Scholar]
- 27.Mansukhani A, Ambrosetti D, Holmes G, Cornivelli L, Basilico C. Sox2 induction by FGF and FGFR2 activating mutations inhibits Wnt signaling and osteoblast differentiation. J Cell Biol. 2005;168:1065–1076. doi: 10.1083/jcb.200409182. [DOI] [PMC free article] [PubMed] [Google Scholar]
- 28.Welm BE, Freeman KW, Chen M, Contreras A, Spencer DM, Rosen JM. Inducible dimerization of FGFR1: development of a mouse model to analyze progressive transformation of the mammary gland. J Cell Biol. 2002;157:703–714. doi: 10.1083/jcb.200107119. [DOI] [PMC free article] [PubMed] [Google Scholar]
- 29.Creighton CJ. The molecular profile of luminal B breast cancer. Biologics. 2012;6:289–297. doi: 10.2147/BTT.S29923. [DOI] [PMC free article] [PubMed] [Google Scholar]
- 30.Karn T, Ruckhaberle E, Hanker L, Muller V, Schmidt M, Solbach C, Gatje R, Gehrmann M, Holtrich U, Kaufmann M, Rody A. Gene expression profiling of luminal B breast cancers reveals NHERF1 as a new marker of endocrine resistance. Breast Cancer Res Treat. 2011;130:409–420. doi: 10.1007/s10549-010-1333-x. [DOI] [PubMed] [Google Scholar]
- 31.Ciriello G, Sinha R, Hoadley KA, Jacobsen AS, Reva B, Perou CM, Sander C, Schultz N. The molecular diversity of Luminal A breast tumors. Breast Cancer Res Treat. 2013;141:409–420. doi: 10.1007/s10549-013-2699-3. [DOI] [PMC free article] [PubMed] [Google Scholar]
- 32.Elston CW, Ellis IO. Pathological prognostic factors in breast cancer. I. The value of histological grade in breast cancer: experience from a large study with long-term follow-up. Histopathology. 1991;19:403–410. doi: 10.1111/j.1365-2559.1991.tb00229.x. [DOI] [PubMed] [Google Scholar]
- 33.Lakhani SR, Ellis IO, Schnitt SJ, Tan PH, van de Vijver MJ. World Health Organisation classification of tumors of the Breast. Lyon: IARC Press; 2012. [Google Scholar]
- 34.Goldhirsch A, Winer EP, Coates AS, Gelber RD, Piccart-Gebhart M, Thurlimann B, Senn HJ. Personalizing the treatment of women with early breast cancer: highlights of the St Gallen International Expert Consensus on the Primary Therapy of Early Breast Cancer 2013. Ann Oncol. 2013;24:2206–2223. doi: 10.1093/annonc/mdt303. [DOI] [PMC free article] [PubMed] [Google Scholar]
- 35.Coates AS, Winer EP, Goldhirsch A, Gelber RD, Gnant M, Piccart-Gebhart M, Thurlimann B, Senn HJ. -Tailoring therapies-improving the management of early breast cancer: St Gallen International Expert Consensus on the Primary Therapy of Early Breast Cancer 2015. Ann Oncol. 2015;26:1533–1546. doi: 10.1093/annonc/mdv221. [DOI] [PMC free article] [PubMed] [Google Scholar]
Associated Data
This section collects any data citations, data availability statements, or supplementary materials included in this article.