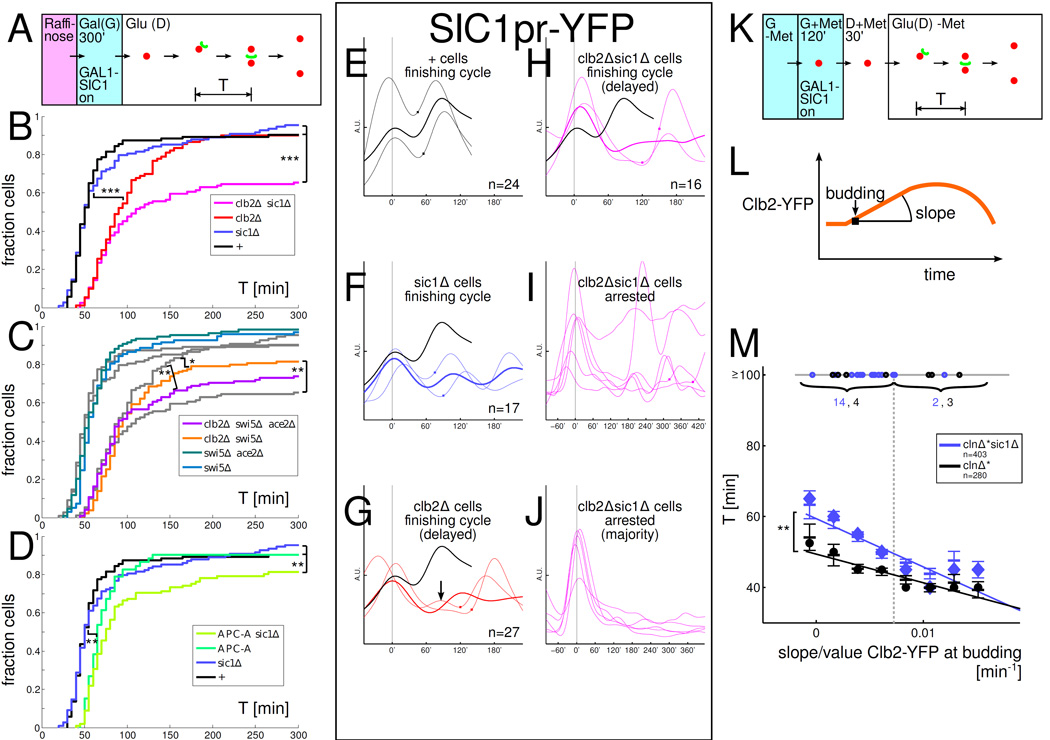
Figure 6.
SIC1 rescues low-Clb cell cycles and some low-Clb cells show multiple SIC1pr-YFP oscillations. All strains in A-M have one copy of a GAL1-SIC1 construct. '+': WT except for GAL1-SIC1. A: Experimental set-up for panels A–J. B–D: Distribution of times T between the first budding to nuclear division in glucose (budneck marker: Myo1-GFP, nuclear marker: Htb2-mCherry). Plots from B underlaid in C in grey for comparison. E–J: A subset of low-Clb cells reveal extra peaks and oscillations in SIC1pr-YFP. Time courses aligned so that first budding after GAL1-SIC1 shut-off is at time 0'; Square symbol: time of nuclear division. Same vertical scale is used in all time course plots. EH: SIC1pr-YFP levels in cells that complete a cell cycle (note extra bump in low-Clb cell in panel G). Thin lines: sample time courses; thick lines: mean. Mean time course for '+' cells plotted in black for reference. I: Subset of arrested clb2Δsic1Δ cells 14%(6/43) show SIC1pr-YFP oscillations. J: In the majority of arrested clb2Δsic1Δ cells, strong SIC1pr-YFP activity cannot be easily detected during the arrest. K: Experimental set-up for experiment in panel M. L: Clb2-YFP was recorded in each cell using time lapse fluorescence microscopy. M: sic1Δ cells which fire Clb2-YFP more slowly take longer to finish nuclear division (and fail significantly more often) than SIC1 cells. Plot of time from budding to nuclear division T versus slope of Clb2-YFP at budding (normalized by Clb2-YFP at budding). The median Clb2-YFP slope at budding is indicated by a dashed vertical line. The circles on the horizontal line at T=100' indicate cells that took T≥100' to complete budding to nuclear division (numbers indicated). For cells with T<100', slopes were collected in 8 equal-width bins covering the range of slopes observed, the mean ± SEM is indicated by horizontal lines for each bin, and a large circle (clnΔ*) or diamond (clnΔ*sic1Δ) indicates the median in each bin; the linear regression lines for T<100' populations are also indicated. Statistical significance of differences is indicated as : p<0.1, : p<0.05, : p<0.001 (log-rank test). In B-D, the difference between strains is only statistically significant if indicated. In M, the statistical significance refers to the difference of the slopes of the linear regression lines.

