Summary
Deletion of phenylalanine 508 of the Cystic Fibrosis Transmembrane Conductance Regulator (CFTR) is the major cause of Cystic Fibrosis (CF), one of the most common inherited childhood diseases. The mutated CFTR anion channel is not fully glycosylated and shows minimal activity in bronchial epithelial cells of CF patients. Low temperature or inhibition of histone deacetylases (HDACi) can partially rescue ΔF508 CFTR cellular processing defects and function. A favorable change of ΔF508 CFTR protein-protein interactions was proposed as mechanism of rescue, however CFTR interactome dynamics during temperature-shift and HDACi rescue are unknown. Here, we report the first comprehensive analysis of the wt and ΔF508 CFTR interactome and its dynamics during temperature shift and HDACi. By using a novel deep proteomic analysis method (CoPIT), we identified 638 individual high-confidence CFTR interactors and discovered a mutation-specific interactome, which is extensively remodeled upon rescue. Detailed analysis of the interactome remodeling identified key novel interactors, whose loss promoted enhanced CFTR channel function in primary CF epithelia or which were critical for normal CFTR biogenesis. Our results demonstrate that global remodeling of ΔF508 CFTR interactions is crucial for rescue, and provide comprehensive insight into the molecular disease mechanisms of CF caused by deletion of F508.
Keywords: Affinity-Purification Mass spectrometry, Membrane Proteins, protein-protein interactions, protein misfolding disease, interactome dynamics
Introduction
Cystic Fibrosis is the most common inherited childhood disease in the Caucasian population, with about 10 million carriers in the US alone. The disease is caused by mutation of the CFTR gene, which encodes an ion channel critical for salt homeostasis of a number of polarized epithelial tissues including the lung, intestine, pancreas and kidney. Disturbed salt homeostasis in CF patients leads to impaired clearance of mucus from the respiratory tract, subsequent chronic lung infections and inflammation, and eventual respiratory failure1–3. The most prevalent mutation, occurring in more than 70% of patients, is an in-frame-deletion of phenylalanine 5084,5. Although the ΔF508 CFTR protein is in principle a functional anion channel, the protein is unstable and rapidly degraded, leading to an almost complete loss of CFTR channel function1,3,6–10. While both wt and ΔF508 CFTR exhibit almost identical folds, the folding of ΔF508 CFTR is kinetically impaired, resulting in an increased recruitment of different chaperones11. CF is therefore also characterized as a protein misfolding disease. Up to 90 % of ΔF508 CFTR protein is retained in the ER and subsequently targeted for proteolytic degradation by the ER-associated degradation pathway (ERAD)8,10,12. However, ΔF508 CFTR function can be partially rescued by a shift to lower temperature (26 to 30 °C)9 or HDACi13,14. It is therefore likely that posttranslational processes, such as altered chaperone recruitment, are critical for manifestation of CF. Accordingly, models have been proposed in which differential protein interactions with ΔF508 CFTR contribute to the functional failure, but are favorably altered by temperature shift or HDACi11. Yet relatively few proteins have been identified that interact with and participate in CFTR processing, in particular in bronchial epithelial cells, and it is largely unknown which interactions lead to stabilization and partial restoration of channel activity of ΔF508 CFTR observed upon shift to permissive temperature or HDACi.
ΔF508 CFTR mutation specific interactome
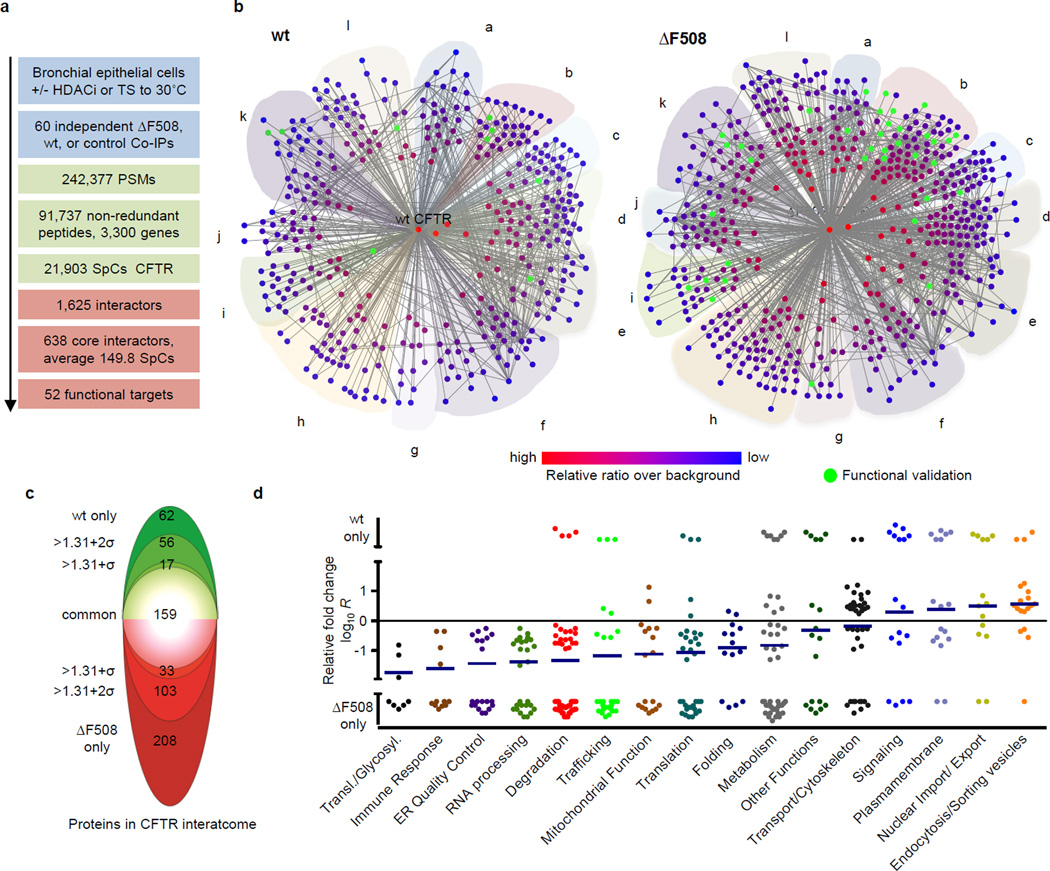
To identify interactions that potentially drive the disease phenotype, we developed Co- Purifying Protein Identification Technology (CoPIT), an immuno-precipitation (IP) based proteomic-profiling approach of protein-protein interactions across different sample conditions. Using CoPIT, which increased CFTR yield by 30–100 fold, we first determined the changes that occur between the wt and ΔF508 CFTR interactome in isogenic HBE41o- (wt CFTR) and CFBE41o- (ΔF508 CFTR) bronchial epithelial cell lines derived from a CF patient15 (Fig. 1a, Extended Data Fig. 1). Proteins mapping to 638 genes were classified as high-confidence interactors. ΔF508 CFTR (Supplementary Data 1) and wt CFTR (Supplementary Data 2) interactomes comprised 576 and 430 proteins, respectively, with an overlap of more than 85 % (Fig. 1b,c). These 638 proteins form the core CFTR interactome, and represent direct as well as indirect CFTR interactors (Supplementary Table S1–S3). Additional 915 interactors with medium confidence scores and at least a ratio of 10:1 over background were further assembled into an extended interactome (Extended Data Fig. 2a).
Figure 1.
Wt and ΔF508 CFTR interactome in bronchial epithelial cells. a. Overview of workflow and results. b. Network representation of the wt and ΔF508 CFTR core interactome. Colour and distance to the center (CFTR) reflect relative enrichment of individual interactors over background. Interactors targeted for functional rescue are in green (node labeling, Fig. S1, S2). Proteins are grouped according to function: (a) protein folding, (b) protein degradation, ER quality control, (c) trafficking (d) protein transport, cytoskeleton, (e) endocytosis, plasma membrane micro-domain organization, (f) signaling, ion transport across membranes, (g) immune response, ROS signaling, (h) metabolism, lipid metabolism, mitochondrial function, (i) uncharacterized, (j) DNA transcription, replication, repair, (k) RNA processing, nuclear import/export, (l) translation, post-translational modification, protein translocation. c. The two-sided “interactome onion” indicates the number of proteins significantly regulated between the wt (green) and ΔF508 CFTR (red) core interactome within different standard errors of measurement (σ) and those detected only in wt or ΔF508 CFTR-IPs. d. The plot depicts the top pathways affected by the ΔF508 mutation and individual regulation of identified CFTR interactors. Pathways are arranged in ascending order of the mean (blue horizontal line). Data are from independent biological replicates, ΔF508 CFTR n=8, wt CFTR n=7. TS: Temperature shift; PSM: Peptide Spectrum Match; SpC: Spectral Counts.
While the majority of proteins (368) in the core-interactome interact with both ΔF508 and wt CFTR, 209 differ significantly in the relative amounts recovered. Additional 208 and 62 interactors were detected only in ΔF508 CFTR and wt CFTR CoPIT experiments, respectively, and might represent interactors specific to or very highly enriched for either ΔF508 or wt CFTR. Protein expression profiling showed that the vast majority of observed differences between the ΔF508 and wt CFTR interactome are not due to altered expression levels of these proteins in the two cell lines (Extended Data Fig. 2b). Thus, a ΔF508 CFTR mutation-specific interactome was identified, which is characterized mainly by gain of novel interaction partners (Supplementary Table S5). Alterations in protein networks revealed distinct differences in the biogenesis of wt and ΔF508 CFTR. In particular, we observed enhanced recruitment of specific chaperones like Hsp90 as well as enhanced protein degradation of ΔF508 CFTR mediated by a protein network, which differs vastly from the degradation and ER quality control network for wt CFTR and includes up to 25% of the ΔF508 CFTR specific interactions (Fig. 1d, Supplementary Table S6). While we recovered many of the proteins known to be involved in CFTR degradation, such as AMFR, STUB1 (CHIP) and VCP, we also identified several proteins that have been implicated previously in ERAD of other misfolded proteins but not of ΔF508 CFTR, including AUP1, SEL1L and FAF216. Several of these novel interactions, such as with the lectin-binding protein LGALS3BP and the E3-ligase TRIM21 were confirmed by Co-IP followed by Western blot detection in bronchial epithelial cell lines and primary bronchial epithelial cells from CF patients (Extended Data Fig. 2c–g). In addition, protein interactions implicated in translational control and mRNA decay, insertion of proteins into the ER (Translocation), N-glycosylation, protein transport and trafficking, anchoring at the plasma membrane, as well as endocytic recycling were strongly altered, suggesting that the entire CFTR biogenesis is affected by deletion of F508. An example of such re-routing is the association of ΔF508 CFTR with the ER quality control component and sugar transferase UGGT, leading to re-glucosylation of ΔF508 CFTR and eventual association with ERAD components, or the highly enhanced association of the co-chaperone PTPLAD1 with ΔF508 CFTR. Association of wt CFTR with components of Wnt and mTOR signaling pathways, and of ΔF508 CFTR with proteins involved in TGF-beta and JAK/STAT signaling suggests that cellular signaling is also affected by the F508 deletion. Taken together, these data suggest that the loss of ΔF508 CFTR function emerges from novel associations with multiple alternate protein complexes and cellular pathways that route ΔF508 CFTR differently than wt CFTR.
Interactome dynamics upon functional rescue of ΔF508 CFTR at 30°C
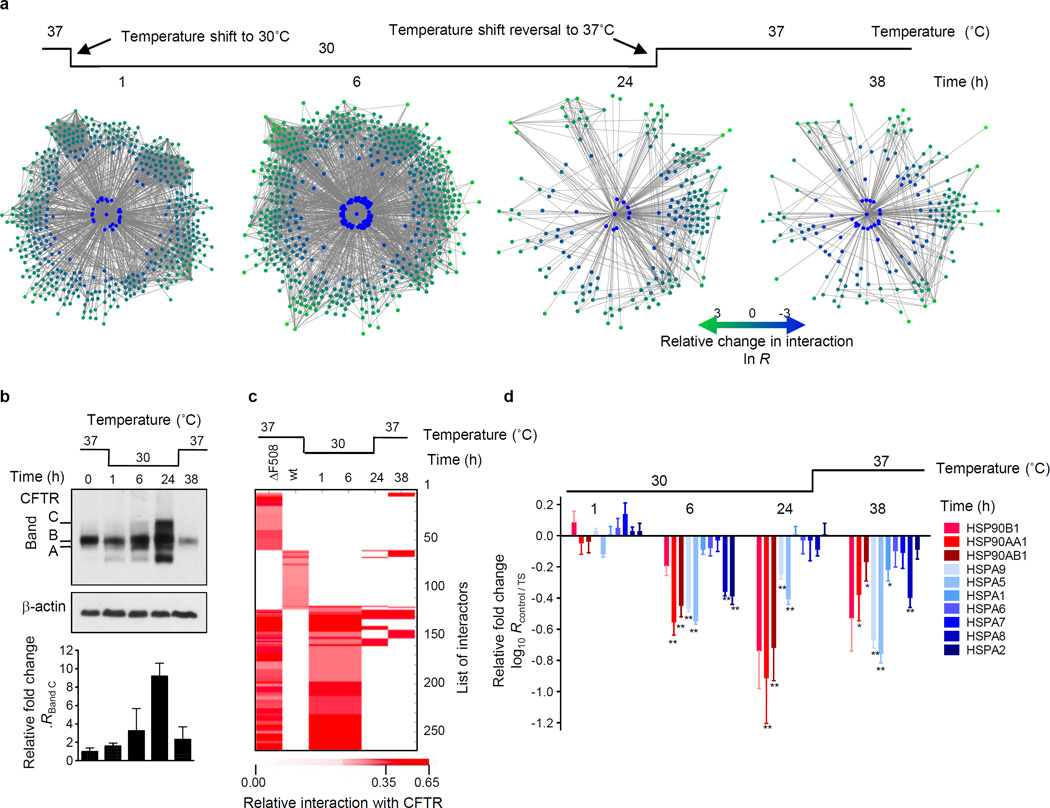
Culture at 26°C to 30°C promotes formation of the fully glycosylated form of ΔF508 CFTR (band C), incorporation into the plasma membrane and partial restoration of its channel activity9. To probe the temporal dynamics of interactions with ΔF508 CFTR and identify the molecular mechanisms that facilitate full glycosylation and lead to functional rescue of ΔF508 CFTR at lower temperature, we monitored changes of the ΔF508 CFTR interactome at different time points during temperature shift to 30°C (Extended Data Fig. 3a). To this end, we first analyzed the ΔF508 CFTR-interactome by CoPIT after short (1 h, Supplementary Data 3), intermediate (6 h, Supplementary Data 4), and long (24 h, Supplementary Data 5) incubation at 30°C, as well as upon reversal of the temperature shift (37°C for 14 h after 24 h at 30°C, Fig 2a, Supplementary Data 6). Changes in the interactome were tightly coupled to the appearance of fully glycosylated ΔF508 CFTR (Band C, Fig 2b). While few interactome changes were observed after 1 h at 30°C, interactions with several proteins involved in ER quality control, like AIMP1 and AUP1, and in lysosomal targeting (LAMP1) were reduced, and a few new interactions were gained (Supplementary Table S7). Long term incubation at 30°C abolished 186 of the 208 (89%) unique and highly confident interactions (Fig. 2c) and the interactome was extensively remodelled with more than 65% of all interactions altered. The increased presence of band C was reflected in, first, reduced association of ΔF508 CFTR with degradation promoting proteins of ubiquitin-mediated pathways and ERAD, as well as of those involved in endocytic removal of plasma membrane proteins, second, by a more favourable folding environment marked by decreased recruitment of Hsp90 and glucose-regulated proteins (Fig. 2d), and third, by a markedly down-regulation of RNA processing (including mRNA decay) proteins like PABPC1 (33-fold) (Supplementary table S7–S10).
Figure 2.
Dynamic changes of the ΔF508 CFTR interactome during temperature shift to 30°C. a. Network representation of ΔF508 CFTR interactome changes occuring at different time points during temperature shift. Colour and distance to CFTR indicate fold-change of individual interactors (green: reduced; blue: enhanced association). The innermost circle contains interactors gained during temperature shift (node labeling, Fig. S3 – S6). Proteins are grouped according to function as in Figure 1b. b. Western blot showing the effect of the temperature shift on non-glycosylated (band A), core-glycosylated (band B) and fully glycosylated (band C) ΔF508 CFTR. The bar graph displays induction of band C during temperature shift relative to control (0 h). c. Heatmap of temperature sensitive ΔF508 CFTR and wt CFTR-specific interactions. Colour represents protein abundance relative to CFTR. d. Differential interactions of heat shock proteins (HSPs) with ΔF508 CFTR over time during temperature rescue and reversal. Data represent independent biological replicates, wt (n=7), ΔF508 (n=8), 1 h (n=4), 6 h (n=4), 24 h (n=2), 24 h reversed (n=2). TS: temperature shift.
Reversal of the temperature shift led to loss of fully glycosylated ΔF508 CFTR. However with only 20 interactions re-established, the ΔF508 CFTR interaction profile still clustered with that of wt CFTR. Interactions that mediate CFTR degradation from either the cell surface or ER, like E3-ubiquitin protein ligases AMFR (gp78) and STUB117–19, were re-gained first. Association of ΔF508 CFTR with RAB5B and RAB5A, which are involved in apical endocytosis and recycling, as well as with Erlin1 and Erlin2, which have been implicated in ERAD of IP3 receptors20, was also restored. The experiment thus indicated that removal from the plasma membrane and subsequent degradation as well as degradation of newly synthesized ΔF508 CFTR in the ER is responsible for the rapid loss of fully glycosylated ΔF508 CFTR. Taken together, the temperature shift experiment revealed that the association of ΔF508 CFTR with the mutation-specific interactome and consequent alteration of CFTR biogenesis can be suppressed by temperature shift and thus may be responsible for the functional rescue.
Interactome remodelling upon HDACi
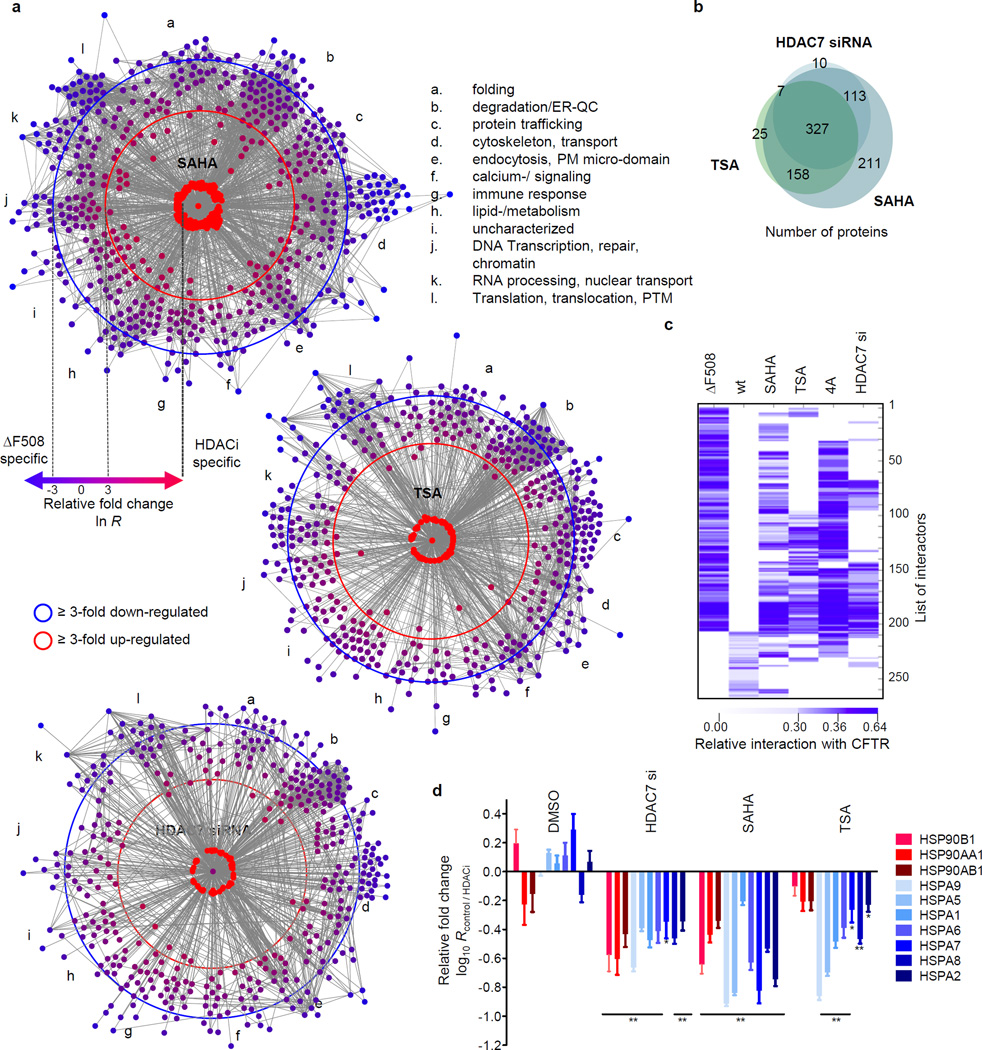
Recently, Hutt et al.13 reported that inhibition of HDAC activity leads to increased presence of fully glycosylated ΔF508 CFTR and partial functional rescue. Monitoring the interactome upon siRNA-mediated knockdown of HDAC7 (Supplementary Data 7), or treatment with 100 nM TSA (Supplementary Data 8) or 5 µM SAHA (Supplementary Data 9) for 24 h, revealed that HDACi induced similar large-scale changes to the ΔF508 CFTR interactome as the temperature shift (Fig. 3a, Supplementary Tables S11–13, Supplementary results and discussion). More than 75% and almost 90% of interactions affected by TSA or HDAC7 knockdown, were also altered by SAHA treatment (Fig. 3b). In particular, HDACi abolished interactions that were either specific for or recruited preferentially to ΔF508 CFTR and restored a few wt CFTR-specific interactions (Fig. 3c), such as with the proteins NHERF1 and NHERF2, which can act as apical plasma membrane adapters for wt CFTR, and thus probably reflect enhanced ΔF508 CFTR stability at the plasma membrane.
Figure 3.
HDACi sensitive changes of the ΔF508 CFTR interactome. a. Network representation of dynamic changes in the ΔF508 CFTR interactome upon HDAC7 knockdown or treatment with SAHA or TSA. Distance to ΔF508 CFTR and colour represent fold-change of individual interactors (blue: reduced; red: enhanced, node labeling, Fig. S7 – S9). Proteins are grouped according to function. b. Heatmap of HDACi sensitive ΔF508 and wt CFTR-specific interactions. ΔF508 CFTR Co- IP results from CFBE41o- cells treated with 10 µM of Cmpd 4a (CFF) are included for comparison. c. Proportional Venn diagram depicting the overlap of ΔF508 CFTR interactions affected by SAHA, TSA or HDAC7 siRNA. d. Differential interactions of heat shock proteins (HSPs) with ΔF508 CFTR upon treatment with SAHA, TSA or DMSO (control) or HDAC7 knockdown. All data represent independent biological replicates, wt (n=7), ΔF508 (n=8), SAHA (n=4), TSA (n=4), HDAC7 si (n=3), Cmpd 4a (n=3).
Comparison of the interactions that were affected by temperature shift and HDACi identified trafficking, degradation and mRNA decay pathways required for ΔF508 CFTR rescue and pinpointed distinct differences in the mechanisms by which ΔF508 CFTR rescue is achieved. In contrast to temperature shift, TSA failed to reduce association with several protein disulfide isomerases that are involved in ER quality control. SAHA treatment even enhanced association with ERAD component SEL1L, with E3-ligase SUGT1 and E3C ligase (UBE3C), which enhances proteasome processivity21. We also identified additional lysosomal degradation proteins like Cathepsin B and TPP1 in the SAHA interactome, probably reflecting failure of SAHA to fully prevent retrotranslocation and degradation of ΔF508 CFTR. Additionally, HDACi induced extensive changes to the ΔF508 CFTR associated cytoskeleton, which appear to have wide-ranging influence on anterograde and retrograde transport. Despite these changes to the interactome, the interaction profiles of ΔF508 CFTR upon treatment with HDACi or Cmpd 4a still clustered with the interaction profile of control ΔF508 CFTR rather than with wt CFTR (Extended Data Fig. 3d). Further differences between temperature shift and HDACi mediated rescue included an inversely altered association of chaperone HSP70 and HSP90 family members with ΔF508 CFTR (Fig. 3d). While temperature shift only slightly affected association of ΔF508 CFTR with the HSP70 and Hsc70 chaperone machinery (1.35-fold less) it strongly reduced the association of ΔF508 CFTR with Hsp90 proteins (6.2-fold less). Conversely, HDACi strongly reduced the association of ΔF508 CFTR with detected Hsp70 family members (3.4-fold less) and affected association with Hsp90 proteins to a lesser degree (2.5-fold less). Reduced binding of chaperones to ΔF508 CFTR was independent of chaperone expression levels, which were either not influenced or up regulated by temperature shift or HDACi13 (Extended Data Fig. 3b). However, enhanced acetylation of the ATPase domain of Hsp70 (HSPA1A) was observed upon HDACi, suggesting that the remodelling of the chaperone environment is induced by acetylation of Hsp70 (Extended Data Fig. 3c). Acetylation of the ATPase domain may disrupt the Heat shock-Ubiquitin-Proteoasome pathway, which controls mRNA decay22. ΔF508 CFTR mRNA decay is possibly the pacemaker for the CF phenotype, as all treatments that induced ΔF508 CFTR rescue down-regulate the association of a distinct set of more than 30 proteins that affect mRNA stabilization and decay, including PABPC1, YBX1, and UPF1.
Interestingly, a subset of seven ΔF508 CFTR specific interactions was neither corrected by temperature shift nor by SAHA. This subset includes members of the 26S proteasome (PSMC1, PSMD11), which induce protein aggregation and neuro-degeneration if inhibited in their function23,24, and PSMB8, a stress-inducible subunit of the 20S core proteasome25, as well as the two co-chaperones BAG3 and DNAJB2. DNAJB2 inhibition leads to partial ΔF508 CFTR rescue19. BAG3, whose binding to ΔF508 CFTR was significantly up-regulated immediately after temperature shift, mediates aggresome formation and selectively induces autophagy of misfolded proteins26. Persistence of these interactions suggests that these proteins detect ΔF508 CFTR and channel it to autophagy and proteasomal degradation even under rescuing conditions. SURF4 has been implicated in vesicular trafficking27,28 and store-operated Ca2+ entry29, whereas the molecular function of the last member of this subset, ERH, has remained enigmatic, but may be associated with RNA splicing30.
Interactor RNAi restores ΔF508 function
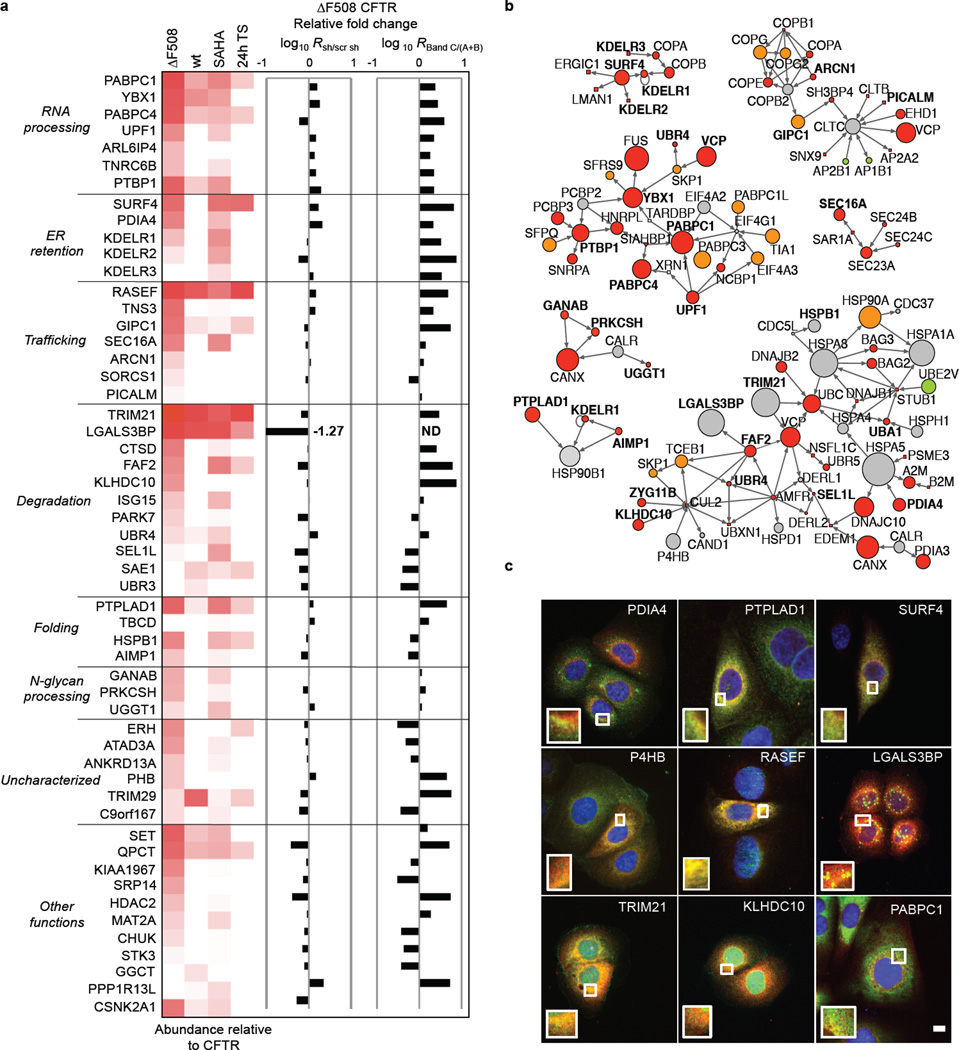
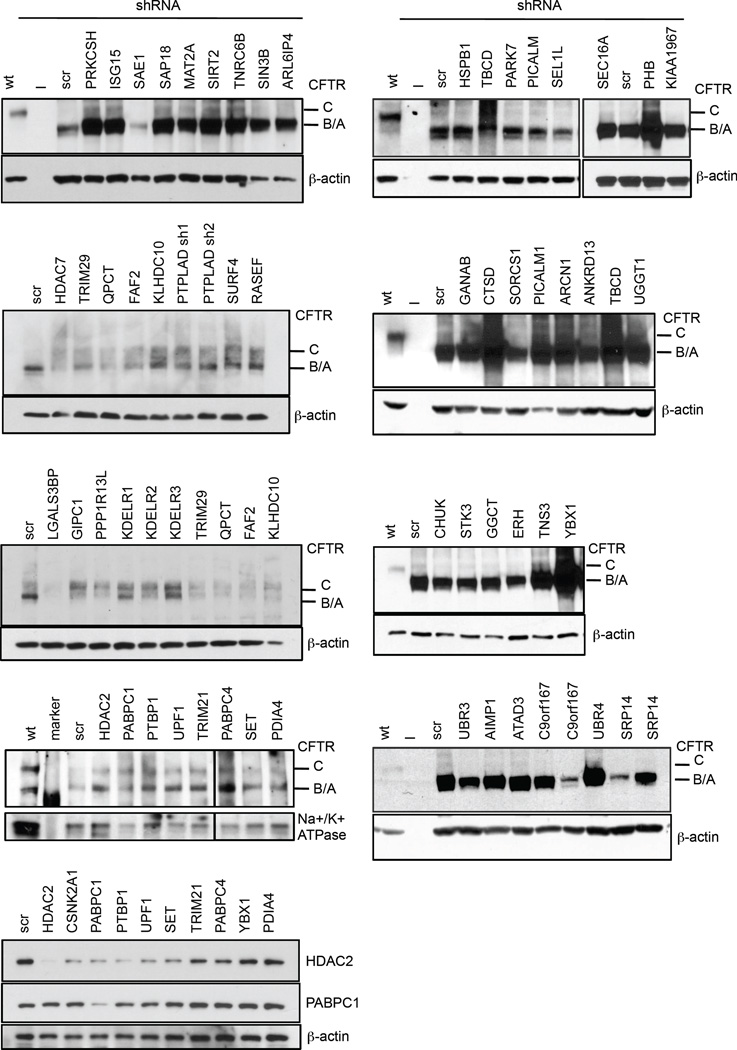
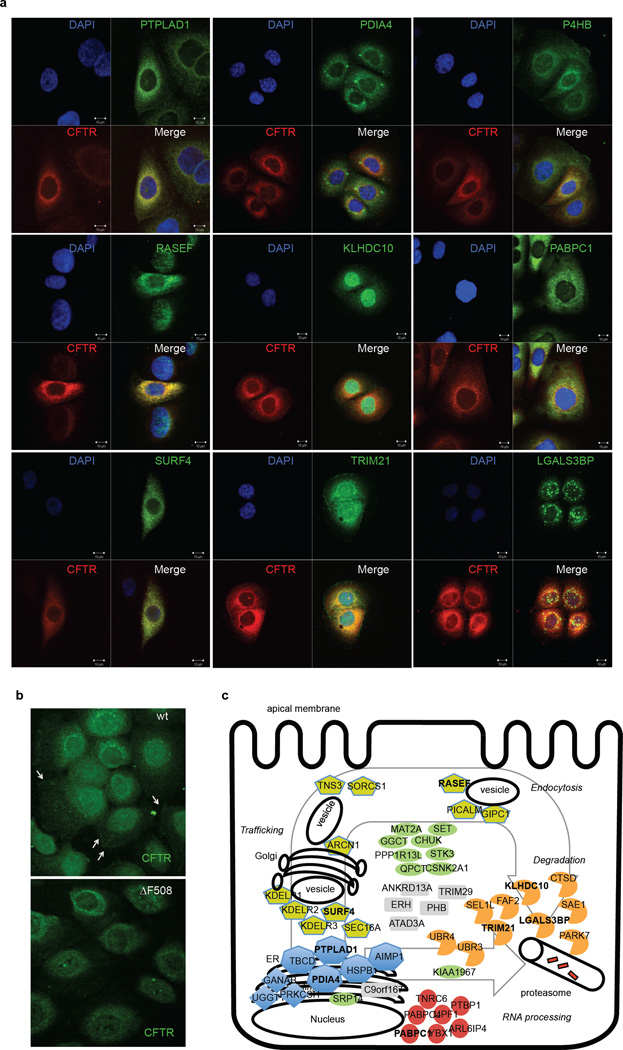
To assess the potential of rescuing the ΔF508 CFTR phenotype by blocking novel protein-protein interactions identified in this study, we performed an RNAi screen with validated shRNAs and monitored ΔF508 CFTR maturation and its glycosylation pattern by electrophoresis as a measure for ΔF508 CFTR rescue. A total of 52 proteins were tested including HDAC2 as positive and CSNK2A as negative controls (Extended Data Fig 4). Knockdown of 31 interactors promoted ΔF508 CFTR maturation, 6 proteins had minor to no effect, and knockdown of 17 proteins led to reduced ΔF508 CFTR stability and yield (Fig. 4a, Extended Data Fig. 5). Many of the 31 novel interactors might sequentially control ΔF508 CFTR protein production and turn over as they belong to (1) a network associated with mRNA decay and co-translational control, (2) complexes affecting ΔF508 CFTR trafficking and endocytic recycling, (3) ER quality control and folding, or (4) the protein degradation network (Fig. 4b, see also Supplemental results and discussion). The subcellular interaction of ΔF508 CFTR with the top sub-networks or complexes was spatially resolved by co-immunostainings of nine binding partners that represent different cellular compartments according to Gene Ontology (Fig. 4c, Extended Data Fig. 6a–c). Prolyl-4-hydroxylase (P4HB), an ER and plasma membrane marker, PDIA4, which recognizes unfolded protein regions31, and PTPLAD1, which exhibits Hsp90 co-chaperone activity32, co-localized with ΔF508 CFTR in the ER. Co-staining was also observed with SURF4, which is found in the early secretory pathway, ERGIC, and Golgi28, as well as with the GTPase RASEF, which is potentially involved in membrane trafficking. Co-staining of ΔF508 CFTR with KLHDC10 and TRIM21, which are involved in degradation33,34, and with PABPC1, which is involved in RNA processing35–37, was observed in the nuclear periphery. LGALS3BP, which is part of the KLHDC10-FAF2 degradation complex38 and which negatively influenced ΔF508 CFTR stability, only partially co-localized with ΔF508 CFTR in vesicular structures.
Figure 4.
RNAi and subnetworks of novel key interactors. a. Heatmap indicating relative abundance to CFTR of interactors selected for RNAi (left). Bar graphs show the relative change of total ΔF508 CFTR protein upon RNAi (central) and of the ratio of ΔF508 CFTR band C to band (A+B) as determined by Western blot (right). ND: value not determined. Data are representative of at least two independent knockdown experiments per target protein. b. Sub-networks of CFTR interactors with RNAi candidates (bold). Colouring indicates relative fold-change and significance (ΔF508 / wt CFTR): red, enhanced (2σ); orange, enhanced (1σ); green, decreased (2σ); light green, decreased (1σ); grey, non-significant. Node size reflects log10- interactor abundance in ΔF508 CFTR IPs. c. Co-localization of ΔF508 CFTR (red) with selected interactors (green) representing different sub-networks and complexes. Nuclei were counterstained with DAPI (blue). Insets in each panel are magnifications of the region indicated by the boxed area (DAPI stain excluded). Scalebar 10 µm.
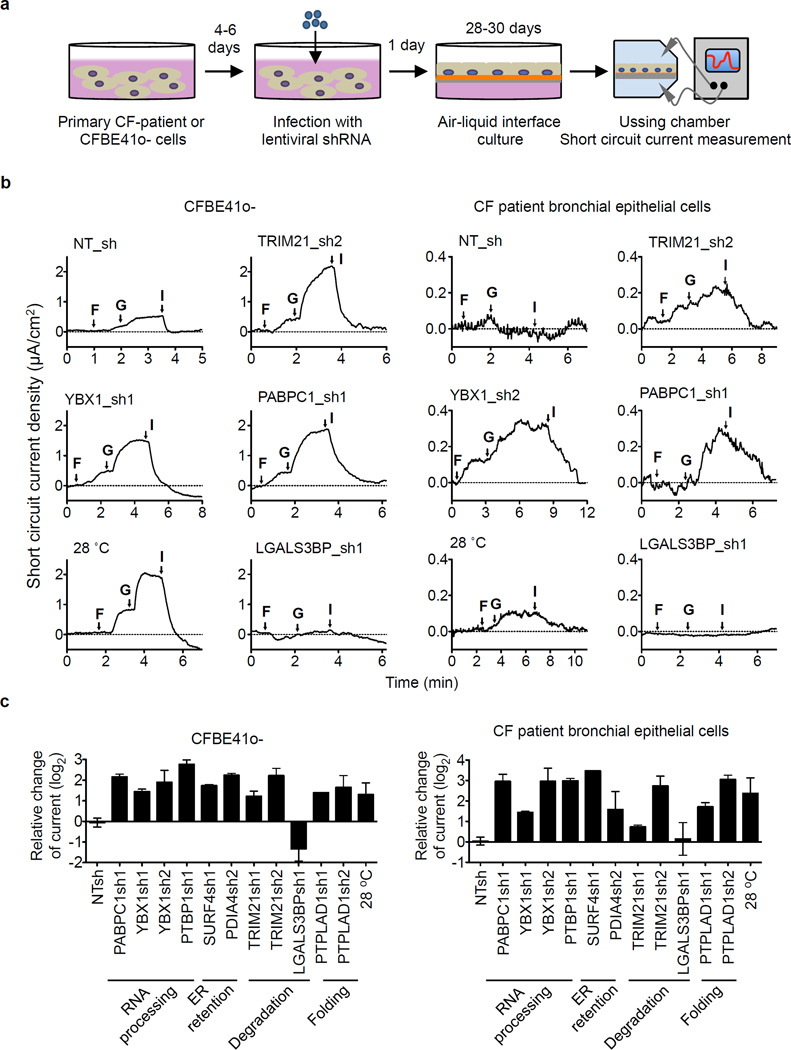
To further evaluate the therapeutic potential of interactors that influenced ΔF508 CFTR maturation in CFBE41o- cells in the RNAi screen, we assessed rescue of ΔF508 CFTR channel function for eight interactors that bind preferentially to ΔF508 CFTR and/or were dynamically regulated by temperature shift and HDACi. Each interactor represents either the RNA decay and co-translational control network (PABPC1, PTBP1, YBX1), the degradation network (LGALS3BP, TRIM21) or is a potential novel component of ER quality control (PDIA4, SURF4, PTPLAD1). Primary human bronchial epithelial cells from healthy donors or CF patients and CFBE41o- cells were differentiated into epithelial cultures at an air-liquid interface (ALI) and ΔF508 CFTR channel function was determined by electrophysiology in an Ussing chamber (Fig. 5a).
Figure 5.
Rescue of ΔF508 CFTR channel function defect by knockdown of ΔF508 CFTR interactors in human primary CF bronchial epithelial and CFBE41o- cells. a. Experimental schematic. Primary bronchial epithelial cells or CFBE41o- cells were infected with lentiviral shRNAs before seeding onto snapwells, culturing the cells at air-liquid interface (ALI) for 28–30 days and measuring short circuit current in an Ussing chamber. b. Representative traces of forskolin (10 µM) and genistein (50 µM) activated ΔF508 CFTR short circuit current (Isc). c. Quantification of the peak CFTR Inhibitor 172 (Inh 172)-sensitive Isc (ΔIsc) in CFBE41o- cells (n=3–5) and in human primary CF bronchial epithelial cells (DHBE, n = 2 to 5) after knockdown of the indicated interactors as fold change relative to non-target shRNA (NT sh). Data represent mean ± s.e.m.
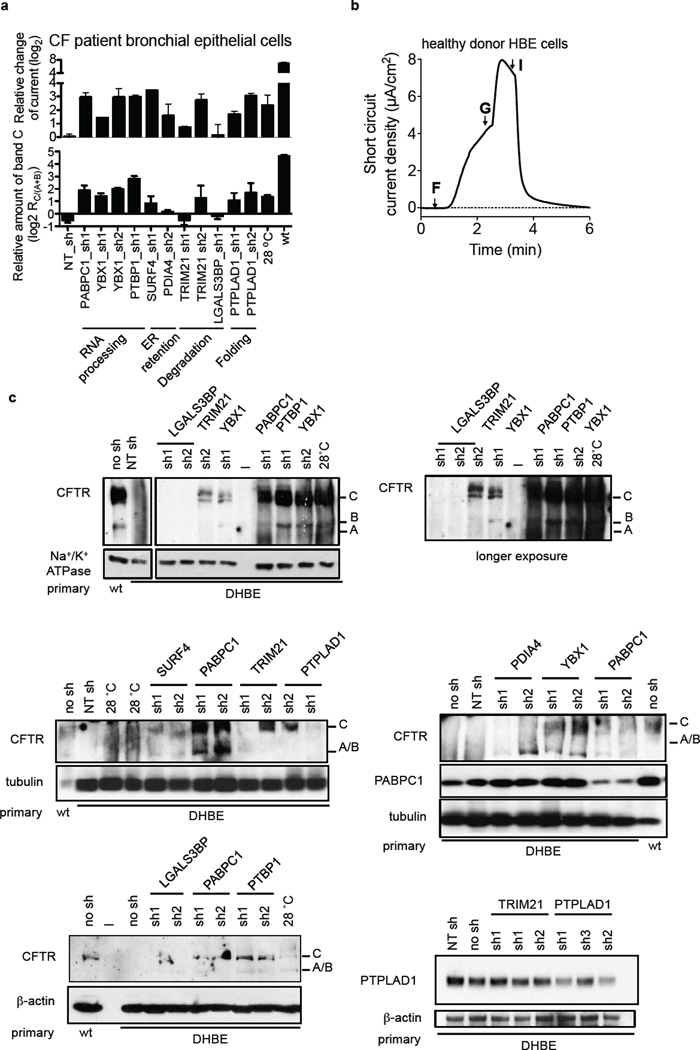
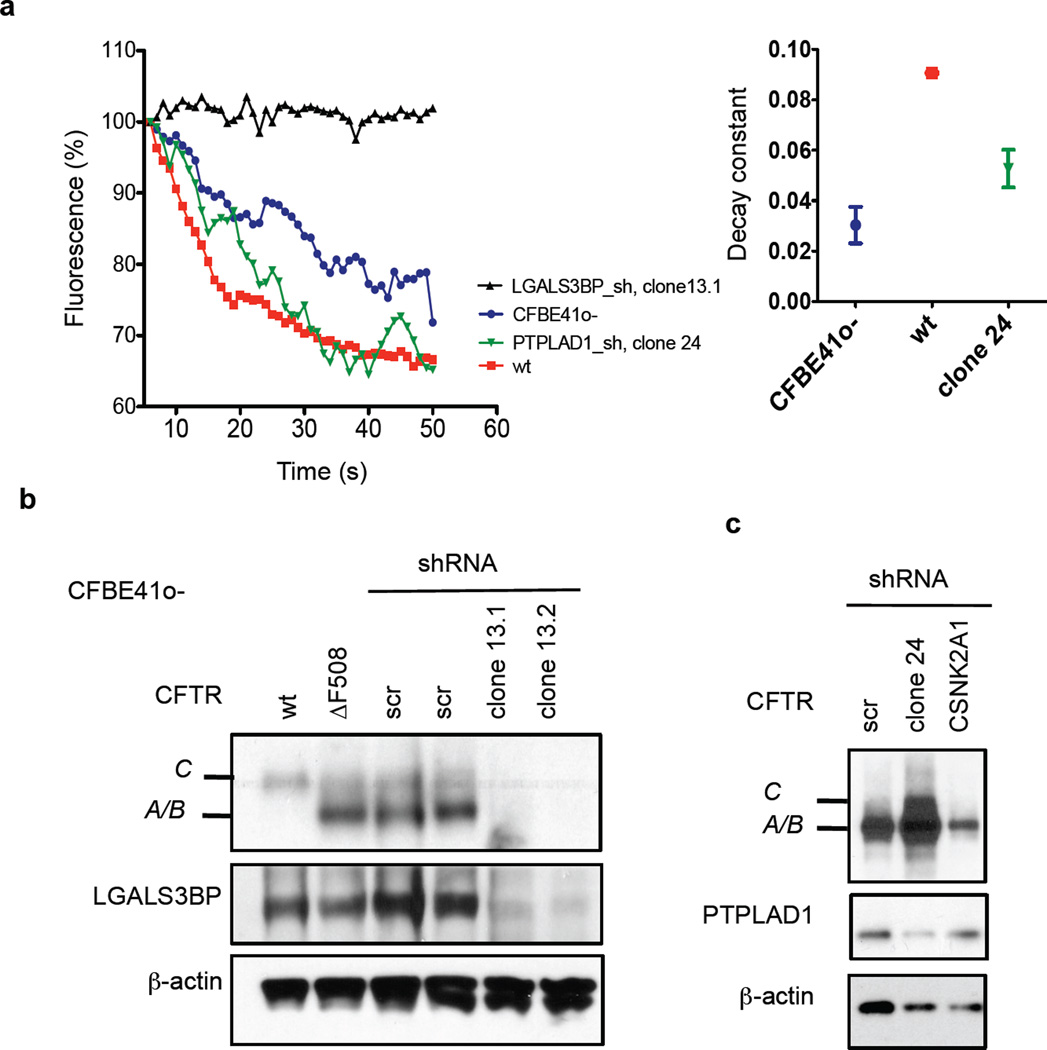
Knock down of seven interactors enhanced forskolin/genistein-stimulated ΔF508 CFTR channel activity at the apical plasma membrane up to 8- to 12-fold over controls in primary CF epithelia and by about 4.5- to 7-fold in CFBE41o- epithelia, which is comparable to rescue by temperature shift (Fig. 5b,c). As determined by Western blot, knockdown of seven of the eight interactors also led to a clearly visible ΔF508 CFTR signal in the primary ALI cultures after differentiation for 28 d and induced band C formation similar to temperature shift, which correlates well with the increase in ΔF508 CFTR activity observed in the Ussing chamber measurements (Extended Data Fig. 7). In the case of LGALS3BP knock down, no CFTR signal was detected in primary CF bronchial epithelial cells by Western blot and we failed to detect ΔF508 CFTR-specific chloride current in CFBE41o- epithelia or primary CF bronchial epithelia. Complete loss of ΔF508 CFTR in CFBE41o- cells that constitutively express an LGALS3BP shRNA (clone 13) showed that LGALS3BP is critical for ΔF508 CFTR stability. Furthermore, no CFTR chloride channel activity was measured upon LGALS3BP knockdown in a halide sensitive YFP assay, whereas upon stable knockdown of PTPLAD1 (clone 24), CFTR chloride channel function was greater than in parental CFBE41o- cells (Extended Data Fig. 8). Our results show that reduction of protein levels of the other seven interactors rescues channel function of ΔF508 CFTR and thus we conclude that modulation of interactors may be a promising route to correction of the ΔF508 CFTR defect.
Closing remarks and outlook
The CoPIT results established a comprehensive interactome for wt as well as ΔF508 CFTR in epithelial airway cells, defined disease-specific alterations and revealed interactome dynamics upon temperature shift and intervention by HDACi. The high number of proteins obtained for the CFTR core interactome with CoPIT (638) can be rationalized by the identification of direct and indirect interactors of CFTR (2nd and 3rd degree interactions) and reflects the complicated multi-step biogenesis of membrane proteins in mammalian cells as well as the number of different possibilities of a cell to cope with misfolded CFTR protein. ΔF508 alters CFTR translation, folding, insertion into the ER, and trafficking, and enhances its degradation, overall contributing to an increased number of both direct and indirect interactors as compared to wt CFTR. Thus, CoPIT analysis of the CFTR interactome shows that the disease phenotype CF is a direct consequence of the derailment of a whole network of protein interactions in the presence of the ΔF508 mutation.
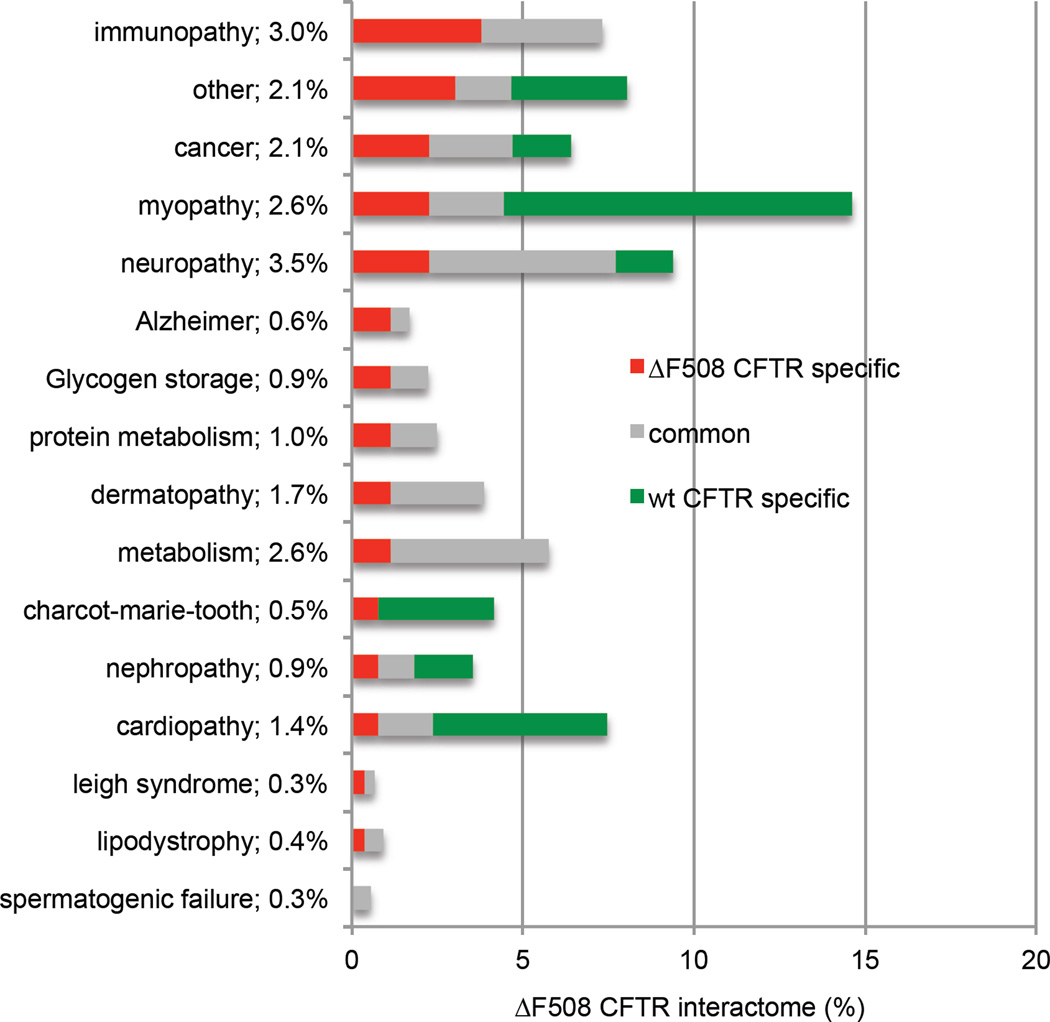
Intriguingly, many of the proteins that bind differentially to wt and ΔF508 CFTR have been implicated in other misfolding or protein aggregation diseases as well, as revealed by querying the OMIM database39 and UniprotKB40. In particular, we noticed differential binding of proteins to CFTR that are implicated in neurodegenerative diseases (Extended Data Fig. 9), suggesting similar disease mechanisms. Although we can only speculate, the mechanisms that lead to ΔF508 CFTR destabilization and clearance could be tentatively harvested to achieve clearance of toxic protein aggregates or to stabilize other misfolded proteins that display a loss of function phenotype like ΔF508 CFTR.
Methods are described in the supplementary information.
Methods
Cell lines and cell culture
Human bronchial epithelial cells (CFBE41o-) carrying the ΔF508 CFTR mutation, or HBE41o- cells harboring a wt CFTR allele, and isogenic CFTR null cells (CFBE41o-, null) were kindly provided by Dr. J. Clancy (University of Alabama, Birmingham, AL). Cells were cultured at 37 °C, 5% CO2 in Advanced-MEM (GIBCO, Carlsbad, CA) supplemented with 1% Penicillin/Streptomycin (GIBCO), 10% fetal bovine serum (GIBCO) and 2 mM L-Glutamine (GIBCO) and appropriate selective antibiotics. Cells were treated with 100 nM Trichostatin A (TSA, Sigma-Aldrich, St. Louis, MO), 5 µM Suberoylanilide hydroxamic acid (SAHA, Cayman Chemicals, Ann Arbor, MI), 15 µM N-[2-(5-Chloro-2-methoxyphenylamino)-4′–methyl-[4,5′]bithiazolyl-2′-yl]-benzamide (Cmpd 4a, C4, Cystic Fibrosis Foundation, www.cftrfolding.org/CFTReagents.htm) or vehicle (DMSO) for 20 h before immunoprecipitation. For siRNA-mediated knockdown of HDAC7, CFBE41o-cells were transfected with Lipofectamine RNAiMAX (Invitrogen, Carlsbad, CA) and 50 nM of validated HDAC7-specific siRNA (Ambion, Austin, TX) or scrambled control siRNA (Ambion) according to the manufacturers’ protocol. The medium was changed the next day and cells harvested 72 h post-transfection. Primary bronchial epithelial cells were obtained from the Cystic Fibrosis Center at University of Alabama, Alabama according to IRB regulations and from Lonza (Walkersville, MD), and were cultured in complete BEGM medium (Lonza) at 37°C, 5% CO2 for up to three passages, starting with passage 0.
Lentiviral mediated knock down of target proteins
Lentiviral particles harboring shRNA sequences specific for the target proteins were generated in HEK293T cells using the Mission® shRNA system with validated shRNAs (Sigma-Aldrich, St.Louis, MO) following standard protocols70. CFBE41o- cells were infected with lentiviral particles for 16 h and cultivated for additional 48 h prior to harvest. Lentivirus production and infection is covered under TSRI approval #01- 13- 10- 07 and all steps were carried out in a BSL2/3 certified laboratory. Rescue of ΔF508 CFTR was monitored by Western blotting followed by immunodetection of CFTR using rat monoclonal 3G11 antibody. The RNAi Consortium (TRC) identification numbers for the shRNAs used are given in Table S15.
Western Blotting and Immunofluorescence
Protein lysates were prepared as described for CoPIT, denatured in SDS sample buffer71 for 15 min at 37°C for detecting CFTR or for 5 min at 95°C, separated by SDS-PAGE and transferred onto nitrocellulose (Protran, Schleicher&Schuell, Germany). The following primary antibodies were used: Rat monoclonal antibody against CFTR (3G11), mouse monoclonal antibodies against CFTR (24.1, ATCC; M3A7, Chemicon, Temecula, CA) and β- actin (AC-15, Sigma), rabbit polyclonal antibodies against HDAC2 (9928S, Cell Signaling, Danvers, MA), PABPC1 (ab21060, Abcam, Cambridge, MA), anti-galectin-3BP (AF2226, R&D Systems, Minneapolis, MN), anti-PTPLAD1 (WH0051495M1, Sigma), anti-52kDA Ro/SSA (sc-25351, Santa Cruz, CA) and anti-Na+/K+ATPase α Antibody (H-300, sc28800, Santa Cruz). Horseradish-peroxidase conjugated secondary antibodies (Jackson ImmunoResearch, West Grove, PA) were detected with enhanced chemiluminescence reagent (ECL, Pierce, Rockford, IL). For Immunofluorescence, CFBE41o- cells fixed with 4% Paraformaldehyde were permeabilized with 0.1% Triton X100, blocked in 10% FBS in 1× PBS for 1 h at room temperature and incubated with the following antibodies for 4 h at RT: anti-CFTR (3G11), anti-galectin-3BP (R&D Systems, AF2226), anti-PTPLAD1 (Sigma, WH0051495M1), anti-KLHDC10 (Sigma, HPA020119), anti-52 kDa Ro/SSA (Santa Cruz, sc-25351), anti-Rab45 (Santa Cruz, sc-81925), anti-Surfeit4 (Santa Cruz, sc-107304), anti-Erp72 (Abcam, ab82587, Enzo ADI-SPS-720), anti-PABPC1 (Abcam, ab21060) and anti-P4HB (3501S, Cell Signaling). AlexaFluor 488-, DyLight 488-, or DyLight 549-conjugated secondary antibodies (Jackson ImmunoResearch) were used for detection of the primary antibodies. Nuclei were counterstained with DAPI (Molecular Probes, Invitrogen). Photographs of cells mounted in ProLong Gold antifade reagent (Molecular Probes, Invitrogen) were taken with a laser scanning confocal microscope LSM 710 (Zeiss) or Radiance 2100 Rainbow (Zeiss).
PremoTm Halide sensor assay
Chloride channel activity of CFTR was determined with a PremoTm Halide sensor assay (Invitrogen) measuring quenching of a halide-sensitive yellow-fluorescent protein (YFP) variant (Venus YFP). To this end, HBE41o-, CFBE41o-, and CFBE41o- cell lines stably transduced with shRNA lentivirus were infected with the Bacman gene delivery system to introduce the YFP expression construct according to manufacturer’s recommendations (Invitrogen). Subsequently, cells were seeded in glass bottom 96 or 24 well plates and cultivated over night. Quenching of fluorescence by Iodide influx was measured on single cell level with a Radiance 2100 Rainbow laser scanning confocal microscope (Zeiss) according to the protocol initially established by Galietta et al.72. Briefly, before time-lapse recording cells were pre-incubated with 50 µM Genistein. Cells with sufficient YFP fluorescence were then selected and data acquisition was started with a frame speed of 0.5 s to 1.0 s. After 5 s, NaI was added to 0.1 M final concentration and chloride channel activity was further stimulated by addition of Forskolin (20 µM). Acquired data were analyzed with Matlab (www.mathworks.com) and Prism (GraphPad Software, Inc.), and decay curves were fitted over the time course. At least 10 individual cells for each cell line were recorded per experiment.
Ussing chamber measurements
Primary human CF and control (wt) bronchial epithelial cells infected with Mission shRNA lentiviral particles with a multiplicity of infection (MOI) between 3 and 5 were plated on 12 mm Snapwell membranes (Corning, Cambridge, MA) coated with rat tail collagen I (BD Biosciences) at a density of 1×10⁵ cells/cm2 and cultured in BEGM. Upon confluence, cells were maintained in B-ALI differentiation medium (Lonza) under air-liquid interface conditions for at least 21 d. Transepithelial resistance (TEER, RT) of the ALI cultures was between 200 and 2700 Ω/cm2, and was measured with a Millicell ERS2 Volt-Ohmmeter (Millipore, Billerica, MA). Polarized cultures were mounted in EasyMount Ussing chambers (Physiological Instruments, San Diego, CA) and bathed bilaterally with Krebs-bicarbonate Ringer solution (140 mM Na+, 119.8 mM Cl−, 25 mM HCO3−, 2.8 mM K+, 2.4 mM HPO4, 0.4 mM PO4, 1.2 mM Mg+, 1.2 mM Ca+, 5 mM Glucose) and the solution saturated with 95% O2, 5% CO2. The epithelial sodium channel was blocked with 100 µM Amiloride (Sigma-Aldrich). CFTR was stimulated by addition of Forskolin (10 µM) and Genistein (50 µM) to the apical side of the chamber followed by CFTR Inhibitor 172 (20 µM, EMD Biosciences, apical) to isolate the CFTR-specific, apical Cl− current. Measurements were carried out at 37°C and the short circuit current (Isc) was recorded and analyzed with Acquire and Analyze 2.0 (Physiological Instruments).
CoPIT Co-Immunoprecipitation and sample preparation for LC/LC-MS/MS
Rat monoclonal anti-CFTR antibody (3G11) was coupled to ProteinG Sepharose 4 Fast Flow beads (GE Healthcare, Piscataway, NJ) at 6 mg/ml packed beads and covalently crosslinked to the beads with 20 mM Dimethylpimelimidate (DMP, Pierce). CFBE41o- or HBE41o- cells from passage 5 to 19 were grown to confluence in Advanced-MEM supplemented with 10% FCS, 1% Penicillin/Streptomycin, 2 mM L-glutamine and appropriate antibiotics. Approximately 4×10⁷ or 1×10⁸ cells were harvested per IP, rinsed with PBS, lysed, CFTR protein complexes immuno-precipitated and prepared for mass spectrometric analysis according to the CoPIT protocol. Briefly, cells were lysed in 0.5% Igepal CA-630 (Sigma-Aldrich), 50 mM Tris pH 7.5, 250 mM NaCl, 1 mM EDTA and 1× Complete EDTA-free Protease Inhibitor mix (Roche, Switzerland) on ice. Following water-bath sonication insoluble material was removed by centrifugation (30 min, 14,000 rpm, 4°C) and the supernatant pre-cleared by incubation with CL4B-Sepharose (GE Healthcare). The pre-cleared lysate was then incubated overnight at 4°C with 50 µl (approx. 250 µg) of anti-CFTR 3G11 antibody covalently coupled to ProteinG-Sepharose. Immunoprecipitates were recovered by centrifugation (500× g, 5 min, 4°C), washed three times with lysis buffer and two times with lysis buffer containing no detergent. Bound proteins were eluted twice with 0.2 M Glycine pH 2.3 and 0.5% Igepal CA-630 at 37°C and precipitated (Eluate : Methanol : Chloroform, 1:4:1, v:v:v). The precipitate was washed with 95% Methanol and re-solubilized in 100 mM Tris pH 8.5 and 0.2% Rapigest (Waters, Milford, MA). Samples were reduced with 5 mM TCEP (Pierce), alkylated with 10 mM Iodoacetamide (Pierce) and proteins digested overnight with 3 µg of sequencing-grade recombinant Trypsin (Promega, Madison, WI). Formic acid (9% final, v:v) was added to inactivate Rapigest (2 h at 37°C), any precipitate removed by centrifugation (15 min, 14,000 rpm at RT), and samples reduced to near dryness in vacuo. To identify non-specific contaminating proteins, control IPs were carried out from (a) isogenic CFTR null cells to identify background that is recognized non-specifically by the 3G11 antibody and (b) by using mock-IPs, in which no antibody is coupled to the beads, to control for bead specific and cell specific background.
Expression profiling
Protein lysates from CFBE41o- and HBE41o- cells at the same passage number were prepared in TNI lysis buffer, precipitated (lysate : Methanol : Chloroform (1:4:1, v:v:v) and 100 µg of protein reduced, alkylated and digested with Trypsin as described above. Resulting peptides were labeled with 6-plex Tandem Mass Tag labeling reagent (Thermo-Fisher, San Jose, CA) according to manufacturers’ recommendations. Subsequently, Rapigest was inactivated by acidification with 10% formic acid, insoluble precipitate removed by centrifugation (15 min, 14,000 rpm), and samples reduced to near dryness in vacuo.
LC/LC-MS/MS
Samples were analyzed by nano-ESI-LC/LC-MS/MS on an LTQ-Orbitrap XL, LTQ or Orbitrap Elite (Thermo Fisher, San Jose, CA) by placing the triphasic MudPIT column inline with an Agilent 1100 quaternary HPLC pump (Agilent, Palo Alto, CA) and separating the peptides in multiple dimensions with a modified 6-step gradient containing 0%, 20%, 40%, 60%, and 100% of Buffer C (500 mM ammonium acetate/5% acetonitrile/0.1% formic acid) over 12 h or a 10-step gradient (0%, 10%, 20%, 30%, 40%, 50%, 70 %, 80%, 90%, 100% Buffer C) over 20 h as described previously73. Each full scan mass spectrum (400–2000 m/z) was followed by 6 (LTQ, LTQ-Orbitrap XL,) or 20 (Orbitrap Elite) data-dependent MS/MS scans at 35% normalized collisional energy and an ion count threshold of 1000 (LTQ-Orbitrap XL, Orbitrap Elite) or 500 counts (LTQ). Dynamic exclusion was used with an exclusion list of 500, repeat time of 60 s and asymmetric exclusion window of −0.51 and +1.5 Da. To avoid cross contaminations between the different samples, each sample was loaded onto a fresh column.
CoPIT data analysis
Raw-files were extracted with RawExtract (fields.scripps.edu/researchtools.php) and MS/MS spectra searched with ProLuCID74 against the human International Protein Index (IPI) database version 3.23, using a target-decoy approach in which each protein sequence is reversed and concatenated to the normal database75. Search parameters were set to no enzyme specificity, 50 ppm precursor mass tolerance, and carboxyamidomethylation (m = 57.021464 Da) as a static modification. Search results were filtered with DTASelect version 2.176 allowing for tryptic peptides only and a peptide false discovery rate (FDR) of less than 0.5%, usually corresponding to a protein false discovery rate of less than 1.0%. To uniformly control the FDR across samples in CoPIT, and eliminate potential comparison problems arising from the use of isoform-specific identifiers, sqt-files of replicate samples were filtered in one single DTASelect run and split again in corresponding replicate subsets for further analysis. Samples with non-sufficient recovery of the bait (<35 SpC) were excluded from further analysis. To remove redundancy, which is problematic for statistical analysis, IPI numbers were first converted to Entrez Gene Symbol using the X-REF Converter developed by RIKEN (http://refdic.rcai.riken.jp/tools/xrefconv.cgi) and manual annotation based on the Ensembl release 43 (www.regulatorygenomics.org) and the highest PSM (peptide-spectrum match) value of all protein variants per gene and experiment retained. CoPIT assumes that proteins binding non-specifically and non-selectively to carrier or antibody are detected with equal likelihood in experimental conditions (e) and control (c) as shown before77, 78. Ratios for proteins p were calculated as , n equals number of experiments. Data were then plotted in Matlab, and a bimodal model to analyze the frequency distribution of all ratios rp ec applied and fitted with a Gaussian of two terms with a goodness of fit between 0.90 ≤ R2 ≤ 0.98, where (bg) is background and (sp) bait specific interactors. Confidence values are calculated for each protein according to where σbg, μbg, σsp and μsp are derived from the respective terms of the Gaussian fit. Proteins that were identified only in background control samples were eliminated from the analysis as obvious background contaminants. For a protein to be considered a potentially true interactor, we required further that it be detected in at least two independent biological replicates of the same condition to minimize random sampling errors and IDs. Fold change of a protein p between two different experimental conditions was calculated according to . Errors for relative changes were calculated based on random error of measurement in CoPIT and if not indicated otherwise, the following significance definitions were used throughout all figures: (*) indicates (σrp + log10 1.32) ≤ rp < (2σrp + log10 1.32) and (**) indicates rp ≥ (2σrp + log10 1.32), wherein rp is the average relative ratio of the protein and σrpis the random error of measurement.
Annotation data were derived from Uniprot Knowledge Base, Entrez Gene information, GO Miner and literature review on PubMed. Interactions between the identified interactors were obtained with the GeneMANIA 2.2 Plugin79 in Cytoscape 2.8.2 using physical interactions reported in BIOGRID-small scale studies, BIOGRID and BIND as well as Pathway information reported in Pathway Commons. Proteins, their connections and according functional annotation were then graphed in the Radial Topology Viewer 0.6, which was based on Medusa80, whereby length of individual edges reflects a quantitative relationship with the bait such as enrichment over background.
Analysis of additional small networks was carried out using Osprey 1.2.081 and Ingenuity Pathway Analysis (IPA). Analysis of the expression profiling experiments was carried out in Census and the Integrated Proteomics pipeline (Integrated Proteomics Applications, Inc) using the TMT-option with 10 mDa tolerance and a minimum intensity threshold of 100,000 relative ion counts82. Statistical significance was determined with an unpaired t-test for differential expression (two-tailed and two-sample t-test on every protein). The volcano plot was generated with the biostatistics package in Matlab (Mathworks). The dataset was uploaded to Proteomics INTegrator (PINT, unpublished, S.M.B.) for online accession by the scientific community at http://sealion.scripps.edu/pint?project=CFTR (“CFTR” dataset). It includes all qualitative and quantitative data over all experimental conditions and replicates measured. In addition, PINT provides an advanced query and annotation system, including the retrieval of Uniprot annotations assigned to the proteins in the dataset.
CFTR Core interactome hierarchical clustering analysis
The CFTR interaction profile of a given condition was represented by log10 transformed ratios of core interactome protein abundances (sum of spectral counts across the replicates of that condition) and the abundance value of CFTR in that same condition. Hierarchical clustering of the different conditions was produced using the average linkage algorithm. The distance between two conditions was set to one minus their Pearson correlation. Heatmap representation was produced using gplots version 2.14.1 package and bootstrap values were obtained using the R package pvclust 1.2–283.
Extended Data
Extended Data Figure 1.
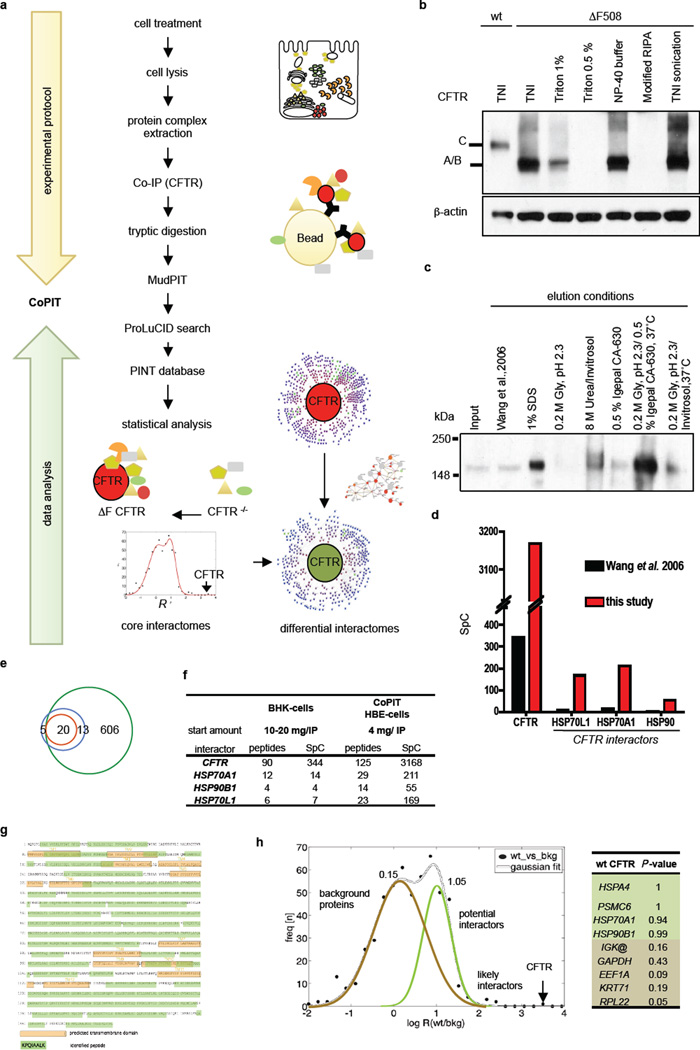
CoPIT workflow and results. a. Schematic overview of the Co-PIT workflow. Top panel: Cell lysates for Immunoprecipitation were prepared from ≥ 4×10⁷ lung epithelial cells (CFBE41o- or HBE41o-) with emphasis on extracting both cytoplasmic and membrane protein interactors of CFTR and pre-cleared before Co-IP with anti-CFTR antibody 3G11. Proteins eluted from the beads were purified by methanol/chloroform precipitation and digested with trypsin, before loading onto a MudPIT column and online MudPIT data acquisition. Lower Panel: Resulting spectra were searched with ProLuCID and search results filtered with DTASelect 2.1 to a protein false positive rate of < 1% before normalization and further statistical analysis of the dataset. Core CFTR interactomes were determined by modeling the distribution functions of control and sample IPs, and applying corresponding confidence scores and abundance filters. Corresponding networks were graphed using the Radial Topology Viewer and differential comparison carried out. Data is stored in the Proteomics INTegrator (PINT) tool. b. Improved recovery of CFTR and interactors. Western blot depicting improved recovery of ΔF508 CFTR from CFBE41o- cells with TNI in comparison with different lysis buffers. A, B, and C indicate the different CFTR glycoforms. c. Western blot showing enhanced recovery of ΔF508 CFTR from beads after Co-IP with detergent and heat aided low pH elution in comparison to other directly mass spectrometric compatible elution methods. Lane Wang et al. 2006: Elution conditions as described in Wang et al., 200611. Gly: Glycine. d. Enhanced sensitivity of the CFTR Co-IP and chromatography is reflected by enhanced spectral counts for CFTR itself and well-established interactors like HSP70 and HSP90. e. Comparison between the CFTR interactome reported by Wang et al.11 and this study (Supplemental table S4). 33 of the reported 38 interactions in Calu-3 cells were recovered; 20 were confirmed as highly confident interactions (innermost circle) and 13 as medium confident interactions in this study, achieving an almost complete overlap of the two datasets. f. The table shows the recovery of CFTR and exemplary, well-characterized interactors in Co-IPs of wt CFTR (BHK cells (from Wang et al.11) or HBE41o- cells (this study). g. Sequence coverage of the CFTR protein with mass spectrometry. Green background indicates identified amino acids whereas orange highlights putative transmembrane (TM) domains of CFTR numbered from 1 to 12. h. Frequency distribution Nrp ec of all rp ec determined for the experimental condition wt CFTR to control condition. Individual points (black dots) indicate the individual vrp ec values. The two-term Gaussian fit is shown in grey. The individual Gaussian describing the distribution of non-specific binding is coloured in brown, whereas the Gaussian describing the enrichment for weak specific interactors is indicated in light green. The black arrow marks the rp ec determined for CFTR, the bait protein. Right panel: Example P-values for well known CFTR interactors (light green) and proteins commonly identified as background in Co-IP experiments (light brown). Threshold for a high-confidence ΔF508-CFTR interactor was calculated at ≥ 0.92.
Extended Data Figure 2.
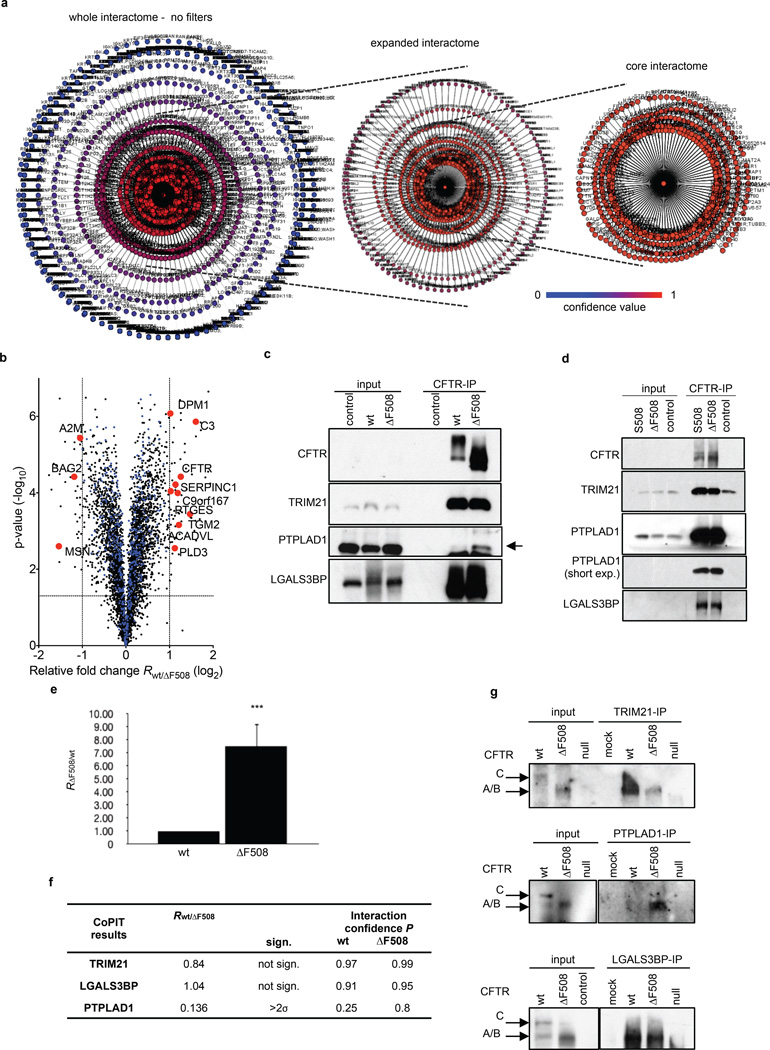
CFTR interactome and validation of novel interactors. a. Network representation of the ΔF508 CFTR interactome in a radial topography map. The colour and relative distance to CFTR in the center reflect the confidence P of an identified protein to be a specific CFTR interactor. Left panel: no filters were applied and all recovered proteins from the IPs are depicted. Right panel: Core interactome of ΔF508 CFTR (>0.92). Distance and colour indicate the confidence of an identified protein to be a specific CFTR interactor. b. Overlay of the interactome data with protein expression profiling data shows that observed interactome differences between wt and ΔF508 CFTR are unrelated to expression changes between HBE41o- and CFBE41o- cells. The volcano plot displays the fold-change and log10 p-value for 4563 proteins quantified with Tandem Mass Tag (TMT) in the expression profiling experiment. Core-interactors of CFTR (529 proteins) that were not differentially regulated between the two cell lines are displayed in blue whereas significantly altered (2-fold and p < 0.01) core-interactors are displayed in red. c. Western blotting of CFTR- IPs confirms specific interaction of CFTR with the novel interaction partners TRIM21, LGALS3BP and PTPLAD1 in CFBE41o- or HBE41o- cells. Results indicate similar binding of wt and ΔF508 CFTR with TRIM21 and LGALS3BP, and confirm enhanced binding of PTPLAD1 with ΔF508 CFTR. d. CFTR Co-IPs confirm CFTR interaction with TRIM21, PTPLAD1 and LGALS3BP in CF patient primary lung epithelial cells carrying either the ΔF508 or the F508S mutation. Control: CFTR null CFBE41o- cell line. e. Ubiquitin (UBB/UBC) recovery is increased in ΔF508 CFTR Co-IPs. f. CoPIT confidence scores and observed fold changes for TRIM21, LGALS3BP and PTPLAD1 match recovery in the IP-western blot. g. Reciprocal Co-IP using newly identified, endogenous interactors as bait confirms interaction of TRIM21, LGALS3BP and PTPLAD1 with ΔF508 CFTR and confirms differential binding of PTPLAD1 to wt and ΔF508 CFTR. Control, null: CFTR null CFBE41o- cell line, mock: beads only – IP with no antibody added.
Extended Data Figure 3.
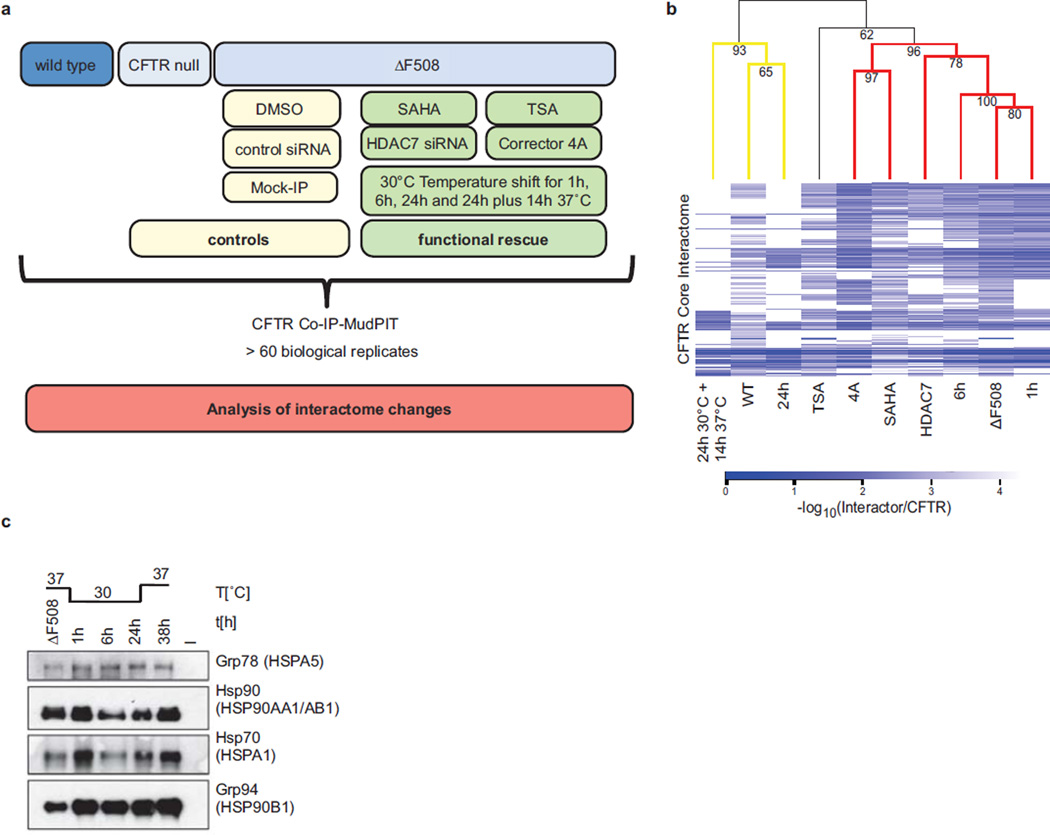
Overview of drug treatment, siRNA mediated knockdown and temperature shift experiments. a. Schematic showing the experimental outline. b. Expression of different heat shock proteins. The Western blot shows expression of HSP90 (encoded by HSP90AA1 and HSP90AB1), GRP78 (HSPA5), GRP94 (HSP90B1) and HSP70 (HSPA1) during temperature shift to 30°C. c. CID MS2 spectrum of the acetylated HSPA1 peptide LDK(42.01)AQIHDLVLVGGSTR acquired on an Orbitrap XL. Mass shift of 42.01 indicates acetylation of HSP70 at Lysine 328 in the ATPase domain. Depicted are b- and y-fragment ions with the corresponding m/z values. All data are from independent biological replicates, wt (n=7), ΔF508 (n=8), SAHA (n=4), TSA (n=4), HDAC7 (n=3), Cmpd 4a (n=3). d. Hierarchical clustering analysis of the CFTR core interactomes shows that the ΔF508 CFTR interaction profile clusters with high significance with those of ΔF508 CFTR at 1 h and 6 h temperature shifts to 30°C (mutant cluster), whereas temperature shift to 30°C for 24 h and temperature shift to 30°C for 24 h with reversal cause the respective ΔF508 CFTR interaction profiles to significantly cluster with that of wt CFTR. Bootstrap values (10,000 samplings) are given for each tree node. Significant (bootstrap value > 90, yellow) and highly significant clusters (bootstrap value > 95, red) are coloured on the dendrogram. The heatmap indicates the relative protein abundance values measured by mass spectrometry as negative log10 ratios of interactors relative to CFTR. White in the heatmap indicates that no interaction was observed.
Extended Data Figure 4.
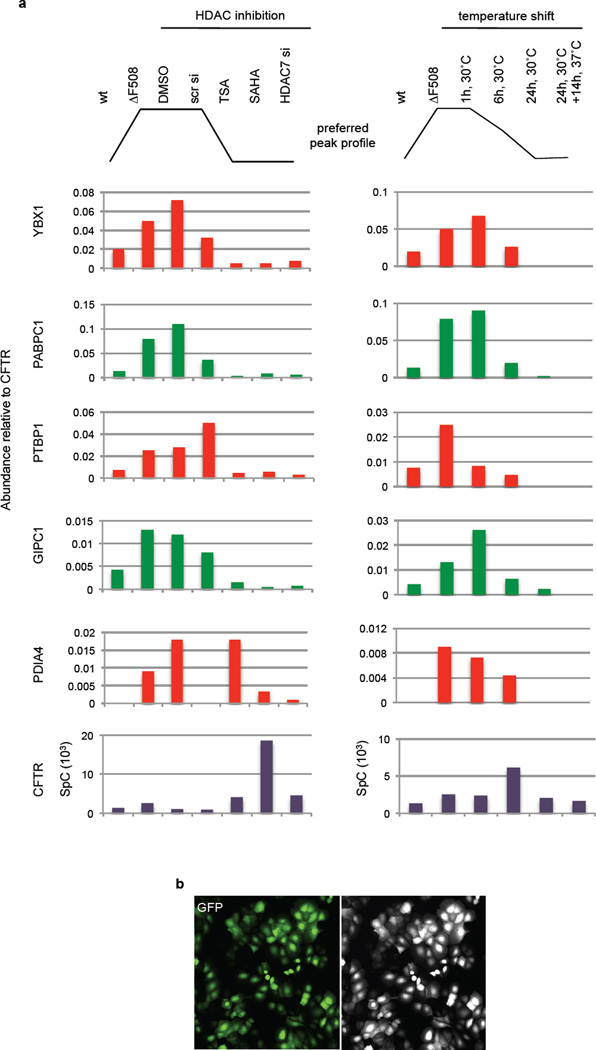
Interaction profiles of proteins selected for the RNAi screen. a. Observed interaction profiles of selected candidates and CFTR (lower panel) and expected candidate profiles (upper panel). Norm. Int.: normalized intensity. Scr.: scrambled. b. Lentiviral infection rates were greater than 97% after 48 h in CFBE41o-cells as indicated by control GFP infection.
Extended Data Figure 5.
Western blot detection of ΔF508 CFTR upon RNAi of interactors. ΔF508 CFTR was detected 48 – 72 h after lentiviral shRNA infection using the 3G11 antibody or 24.1 antibody (lowest left panel). Rescue is indicated by appearance of band C. Detection of β-actin served as loading control. Samples on the same blot represent parallel infections. Samples in the lower three left panels were lysed initially in TNI buffer, whereas samples in the other panels were lysed directly in 2× Laemmli sample buffer as described in Materials and Methods. Scr: scrambled non-target shRNA.
Extended Data Figure 6.
Co-localization of novel interactors with ΔF508 CFTR. a. Each panel contains immunofluorescence staining of CFTR (red), interactor as indicated (green), nuclei (DAPI) and the merged picture. Scale bars, 10 µm. b. Wt and ΔF508 CFTR was detected by immunofluorescence staining (green) in HBE41o- and CFBE41o- cells, respectively. Arrows points to wt CFTR at the plasma membrane of control cells. c. Schematic of a cell depicting sequential (spatio-temporal) regulation of ΔF508 CFTR protein biogenesis by the interactors targeted in the shRNA screen. Functional classification of interactors is indicated by shape and colour. Proteins detected in co-localization studies are marked in bold.
Extended Data Figure 7.
ΔF508 CFTR detection in primary bronchial epithelial cells upon RNAi of key interactors. a. Quantification of the ΔF508 CFTR ion channel activity (as fold change of the ΔIsc relative to non-target shRNA) in comparison to the ratio of band C to band A/B in primary CF patient or healthy donor (wt) cells. b. Representative trace of forskolin (10 µM, F) and genistein (50 µM, G) activated, wt CFTR short circuit current (Isc) in a 30 d ALI culture from a healthy donor. CFTR inhibitor 172 (I) indicates specificity of the measured Isc for CFTR. c. Western blot of 28–30 d old primary human bronchial epithelial snapwell cultures from CF patients (DHBE) indicates formation of band C after specific knockdown of PABPC1, YBX1, PTBP1, TRIM21, PTPLAD1 and SURF4 with different shRNAs. Tubulin, β-actin or Na+/K+−ATPase was used as a loading control. Knockdown of PABPC1 and PTPLAD1 was verified by Western blotting with the respective antibodies. NT sh: non-target shRNA.
Extended Data Figure 8.
Halide assay results for CFTR chloride channel activity in stable cell clones. a. CFTR chloride channel activity was measured in HBE41o-, CFBE41o- and CFBE41o- cells with stable knockdown of LGALS3BP (clone 13) or PTPLAD1 (clone 24). Activity was measured by NaI mediated quenching of a halide sensitive Venus YFP. Time-lapse experiments show the Iodide influx following pre-incubation of cells with 50 µM Genistein. Additional stimulation with Forskolin was performed 15 s following addition of NaI. Representative single cell traces are shown. Inset shows the fitted fluorescence decay time constant for each trace. b. Western blot showing the negative influence of LGALS3BP knock down on ΔF508 CFTR protein stability. Clone 13.1 and 13.2 are two independent CFBE41o- clones that stably express an shRNA against LGALS3BP. The knockdown was validated by detection of LGALS3BP. c. Western blot showing increased production of ΔF508 CFTR band C in CFBE41o- cell clone 24 stably expressing an shRNA against PTPLAD1. The knock down was validated by detection of PTPLAD1. Detection of β-actin served as loading control. Scr: scrambled non-target shRNA.
Extended Figure 9.
Percentage of CFTR interactors associated with known protein misfolding and other prevalent diseases. The bar graph shows the fraction of the interactome associated with genetic diseases listed in OMIM. Percentages next to the disease name indicate the percentage of ΔF508 CFTR specific interactors involved in these diseases. Interactors causative for Alzheimers disease and other neurodegenerative diseases like Leigh-syndrome are enriched in the ΔF508 CFTR interactome. “Other” indicates diseases not fitting into one of the other categories listed.
Supplementary Material
Acknowledgments
We thank Dr. Andreas Bamberger (Albert-Ludwigs-University Freiburg, Germany) for many discussions on data taking and statistical analysis, Dr. Daniel Cociorva and Dr. Tao Xu for making DTASelect 2.1 available and for suggestions and comments on data analysis strategies. We further thank Dr. Darren Hutt and Dr. Daniela Roth for discussion. This work is supported by NIH grants 5R01HL079442-08 (J.R.Y. and W.E.B.), P01AG031097 (J.R.Y and W.E.B.), P41 RR011823 (J.R.Y), HHSN268201000035C (J.R.Y), and a CFF mass spectrometry fellowship BALCH050X6 (S.P. and J.R.Y). M.L.- A. holds a postdoctoral fellowship from FRQNT. Raw data will be made publicly available upon publication.
Footnotes
Author contributions
S.P. and C.B. developed experimental methods and performed all experiments, data analysis and mass spectrometric measurements. C.B. and S.P. developed and performed statistical analysis. D.C. and C.B. developed the Radial Topology Viewer. M.L.A performed and wrote the methods detailing the hierarchical clustering. S.M.B. developed and maintains PINT. J.R.Y., W.E.B., S.P., and C.B. designed the study. S.P., C.B., and J.R.Y. wrote the paper.
Analyzed data are available at http://sealion.scripps.edu/pint?project=CFTR (“CFTR” dataset). Raw-files have been deposited on Proteome Exchange under accession number PXD002722.
The authors declare no competing financial interests.
References
- 1.Dalemans W, et al. Altered chloride ion channel kinetics associated with the delta F508 cystic fibrosis mutation. Nature. 1991;354:526–528. doi: 10.1038/354526a0. [DOI] [PubMed] [Google Scholar]
- 2.Collins FS. Cystic fibrosis: molecular biology and therapeutic implications. Science. 1992;256:774–779. doi: 10.1126/science.1375392. [DOI] [PubMed] [Google Scholar]
- 3.Lukacs GL, et al. The delta F508 mutation decreases the stability of cystic fibrosis transmembrane conductance regulator in the plasma membrane. Determination of functional half-lives on transfected cells. J Biol Chem. 1993;268:21592–21598. [PubMed] [Google Scholar]
- 4.Watson MS, et al. Cystic fibrosis population carrier screening: 2004 revision of American College of Medical Genetics mutation panel. Genetics in medicine : official journal of the American College of Medical Genetics. 2004;6:387–391. doi: 10.1097/01.GIM.0000139506.11694.7C. [DOI] [PMC free article] [PubMed] [Google Scholar]
- 5.Report, W. The molecular genetic epidemiology of cystic fibrosis. 2004 http://www.who.int/genomics/publications/en/HGN_WB_04.02_report.pdf.
- 6.Drumm ML, et al. Chloride conductance expressed by delta F508 and other mutant CFTRs in Xenopus oocytes. Science. 1991;254:1797–1799. doi: 10.1126/science.1722350. [DOI] [PubMed] [Google Scholar]
- 7.Li C, et al. The cystic fibrosis mutation (delta F508) does not influence the chloride channel activity of CFTR. Nat Genet. 1993;3:311–316. doi: 10.1038/ng0493-311. [DOI] [PubMed] [Google Scholar]
- 8.Lukacs GL, et al. Conformational maturation of CFTR but not its mutant counterpart (delta F508) occurs in the endoplasmic reticulum and requires ATP. Embo J. 1994;13:6076–6086. doi: 10.1002/j.1460-2075.1994.tb06954.x. [DOI] [PMC free article] [PubMed] [Google Scholar]
- 9.Denning GM, et al. Processing of mutant cystic fibrosis transmembrane conductance regulator is temperature-sensitive. Nature. 1992;358:761–764. doi: 10.1038/358761a0. [DOI] [PubMed] [Google Scholar]
- 10.Jensen TJ, et al. Multiple proteolytic systems, including the proteasome, contribute to CFTR processing. Cell. 1995;83:129–135. doi: 10.1016/0092-8674(95)90241-4. [DOI] [PubMed] [Google Scholar]
- 11.Wang X, et al. Hsp90 cochaperone Aha1 downregulation rescues misfolding of CFTR in cystic fibrosis. Cell. 2006;127:803–815. doi: 10.1016/j.cell.2006.09.043. [DOI] [PubMed] [Google Scholar]
- 12.Ward CL, Omura S, Kopito RR. Degradation of CFTR by the ubiquitin-proteasome pathway. Cell. 1995;83:121–127. doi: 10.1016/0092-8674(95)90240-6. [DOI] [PubMed] [Google Scholar]
- 13.Hutt DM, et al. Reduced histone deacetylase 7 activity restores function to misfolded CFTR in cystic fibrosis. Nat Chem Biol. 2010;6:25–33. doi: 10.1038/nchembio.275. [DOI] [PMC free article] [PubMed] [Google Scholar]
- 14.Boyault C, et al. HDAC6-p97/VCP controlled polyubiquitin chain turnover. Embo J. 2006;25:3357–3366. doi: 10.1038/sj.emboj.7601210. [DOI] [PMC free article] [PubMed] [Google Scholar]
- 15.Bruscia E, et al. Isolation of CF cell lines corrected at DeltaF508-CFTR locus by SFHR-mediated targeting. Gene Ther. 2002;9:683–685. doi: 10.1038/sj.gt.3301741. [DOI] [PubMed] [Google Scholar]
- 16.Mueller B, Klemm EJ, Spooner E, Claessen JH, Ploegh HL. SEL1L nucleates a protein complex required for dislocation of misfolded glycoproteins. Proc Natl Acad Sci U S A. 2008;105:12325–12330. doi: 10.1073/pnas.0805371105. [DOI] [PMC free article] [PubMed] [Google Scholar]
- 17.Vij N, Fang S, Zeitlin PL. Selective inhibition of endoplasmic reticulum-associated degradation rescues DeltaF508-cystic fibrosis transmembrane regulator and suppresses interleukin-8 levels: therapeutic implications. J Biol Chem. 2006;281:17369–17378. doi: 10.1074/jbc.M600509200. [DOI] [PubMed] [Google Scholar]
- 18.Meacham GC, Patterson C, Zhang W, Younger JM, Cyr DM. The Hsc70 co-chaperone CHIP targets immature CFTR for proteasomal degradation. Nat Cell Biol. 2001;3:100–105. doi: 10.1038/35050509. [DOI] [PubMed] [Google Scholar]
- 19.Okiyoneda T, et al. Peripheral protein quality control removes unfolded CFTR from the plasma membrane. Science. 2010;329:805–810. doi: 10.1126/science.1191542. [DOI] [PMC free article] [PubMed] [Google Scholar]
- 20.Pearce MM, Wormer DB, Wilkens S, Wojcikiewicz RJ. An endoplasmic reticulum (ER) membrane complex composed of SPFH1 and SPFH2 mediates the ER-associated degradation of inositol 1,4,5-trisphosphate receptors. J Biol Chem. 2009;284:10433–10445. doi: 10.1074/jbc.M809801200. [DOI] [PMC free article] [PubMed] [Google Scholar]
- 21.Chu BW, et al. The E3 ubiquitin ligase UBE3C enhances proteasome processivity by ubiquitinating partially proteolyzed substrates. J Biol Chem. 2013;288:34575–34587. doi: 10.1074/jbc.M113.499350. [DOI] [PMC free article] [PubMed] [Google Scholar]
- 22.Laroia G, Cuesta R, Brewer G, Schneider RJ. Control of mRNA decay by heat shock-ubiquitin-proteasome pathway. Science. 1999;284:499–502. doi: 10.1126/science.284.5413.499. [DOI] [PubMed] [Google Scholar]
- 23.Bedford L, et al. Depletion of 26S proteasomes in mouse brain neurons causes neurodegeneration and Lewy-like inclusions resembling human pale bodies. J Neurosci. 2008;28:8189–8198. doi: 10.1523/JNEUROSCI.2218-08.2008. [DOI] [PMC free article] [PubMed] [Google Scholar]
- 24.Santamaria PG, Finley D, Ballesta JP, Remacha M. Rpn6p, a proteasome subunit from Saccharomyces cerevisiae, is essential for the assembly and activity of the 26 S proteasome. J Biol Chem. 2003;278:6687–6695. doi: 10.1074/jbc.M209420200. [DOI] [PubMed] [Google Scholar]
- 25.Callahan MK, Garg M, Srivastava PK. Heat-shock protein 90 associates with N-terminal extended peptides and is required for direct and indirect antigen presentation. Proc Natl Acad Sci U S A. 2008;105:1662–1667. doi: 10.1073/pnas.0711365105. [DOI] [PMC free article] [PubMed] [Google Scholar]
- 26.Gamerdinger M, Kaya AM, Wolfrum U, Clement AM, Behl C. BAG3 mediates chaperone-based aggresome-targeting and selective autophagy of misfolded proteins. EMBO Rep. 2011;12:149–156. doi: 10.1038/embor.2010.203. [DOI] [PMC free article] [PubMed] [Google Scholar]
- 27.Matsuzaki F, Shirane M, Matsumoto M, Nakayama KI. Protrudin serves as an adaptor molecule that connects KIF5 and its cargoes in vesicular transport during process formation. Mol Biol Cell. 2011;22:4602–4620. doi: 10.1091/mbc.E11-01-0068. [DOI] [PMC free article] [PubMed] [Google Scholar]
- 28.Mitrovic S, Ben-Tekaya H, Koegler E, Gruenberg J, Hauri HP. The cargo receptors Surf4, endoplasmic reticulum-Golgi intermediate compartment (ERGIC)-53, and p25 are required to maintain the architecture of ERGIC and Golgi. Mol Biol Cell. 2008;19:1976–1990. doi: 10.1091/mbc.E07-10-0989. [DOI] [PMC free article] [PubMed] [Google Scholar]
- 29.Fujii Y, et al. Surf4 modulates STIM1-dependent calcium entry. Biochem Biophys Res Commun. 2012;422:615–620. doi: 10.1016/j.bbrc.2012.05.037. [DOI] [PubMed] [Google Scholar]
- 30.Weng MT, Luo J. The enigmatic ERH protein: its role in cell cycle, RNA splicing and cancer. Protein & cell. 2013;4:807–812. doi: 10.1007/s13238-013-3056-3. [DOI] [PMC free article] [PubMed] [Google Scholar]
- 31.Forster ML, et al. Protein disulfide isomerase-like proteins play opposing roles during retrotranslocation. J Cell Biol. 2006;173:853–859. doi: 10.1083/jcb.200602046. [DOI] [PMC free article] [PubMed] [Google Scholar]
- 32.Taguwa S, et al. Cochaperone activity of human butyrate-induced transcript 1 facilitates hepatitis C virus replication through an Hsp90-dependent pathway. J Virol. 2009;83:10427–10436. doi: 10.1128/JVI.01035-09. [DOI] [PMC free article] [PubMed] [Google Scholar]
- 33.Mallery DL, et al. Antibodies mediate intracellular immunity through tripartite motif-containing 21 (TRIM21) Proc Natl Acad Sci U S A. 2010;107:19985–19990. doi: 10.1073/pnas.1014074107. [DOI] [PMC free article] [PubMed] [Google Scholar]
- 34.Behrends C, Sowa ME, Gygi SP, Harper JW. Network organization of the human autophagy system. Nature. 2010;466:68–76. doi: 10.1038/nature09204. [DOI] [PMC free article] [PubMed] [Google Scholar]
- 35.Uchida N, Hoshino S, Katada T. Identification of a human cytoplasmic poly(A) nuclease complex stimulated by poly(A)-binding protein. J Biol Chem. 2004;279:1383–1391. doi: 10.1074/jbc.M309125200. [DOI] [PubMed] [Google Scholar]
- 36.Fabian MR, et al. Mammalian miRNA RISC recruits CAF1 and PABP to affect PABP-dependent deadenylation. Mol Cell. 2009;35:868–880. doi: 10.1016/j.molcel.2009.08.004. [DOI] [PMC free article] [PubMed] [Google Scholar]
- 37.LaCava J, et al. RNA degradation by the exosome is promoted by a nuclear polyadenylation complex. Cell. 2005;121:713–724. doi: 10.1016/j.cell.2005.04.029. [DOI] [PubMed] [Google Scholar]
- 38.Alexandru G, et al. UBXD7 binds multiple ubiquitin ligases and implicates p97 in HIF1alpha turnover. Cell. 2008;134:804–816. doi: 10.1016/j.cell.2008.06.048. [DOI] [PMC free article] [PubMed] [Google Scholar]
- 39.McKusick VA. Mendelian Inheritance in Man and its online version, OMIM. Am J Hum Genet. 2007;80:588–604. doi: 10.1086/514346. [DOI] [PMC free article] [PubMed] [Google Scholar]
- 40.Magrane M Consortium, U. UniProt Knowledgebase: a hub of integrated protein data. Database : the journal of biological databases and curation. 2011;2011:bar009. doi: 10.1093/database/bar009. [DOI] [PMC free article] [PubMed] [Google Scholar]
Associated Data
This section collects any data citations, data availability statements, or supplementary materials included in this article.


