

Abstract
While hemodynamic forces and intraluminal thrombus (ILT) are believed to play important roles on abdominal aortic aneurysm (AAA), it has been suggested that hemodynamic forces and ILT also interact with each other, making it a complex problem. There is, however, a pressing need to understand relationships among three factors: hemodynamics, ILT accumulation, and AAA expansion for AAA prognosis. Hence this study used longitudinal CT scans from 14 patients and analyzed the relationship between them. Hemodynamic forces, represented by wall shear stress (WSS), were obtained from computational fluid dynamics; ILT accumulation was described by ILT thickness distribution changes between consecutives scans, and ILT accumulation and AAA expansion rates were estimated from changes in ILT and AAA volume. Results showed that, while low WSS was observed at regions where ILT accumulated, the rate at which ILT accumulated occurred at the same rate as the aneurysm expansion. Comparison between AAAs with and without thrombus showed that aneurysm with ILT recorded lower values of WSS and higher values of AAA expansion than those without thrombus. Findings suggest that low WSS may promote ILT accumulation and submit the idea that by increasing WSS levels ILT accumulation may be prevented.
1. Introduction
An abdominal aortic aneurysm (AAA) is a permanent focal dilatation of the aorta at the abdominal level. The end stage of this dilatation is rupture, which can lead to death. Mechanically speaking, the rupture of an AAA is believed to occur when the wall stresses exerted by the hemodynamic forces overcome the wall strength of the aneurysm37. These hemodynamic forces that consist of two components, normal and shear, have a profound impact on mechano-homeostasis of arterial and vascular remodeling 26. Both components of these forces are also believed to play a key role in AAA pathogenesis 14,17,28,40,54.
Under normal hemodynamic shear levels (1.5 to 4 Pa) 43, changes in wall shear stress are sensed by endothelium cells on the arterial wall modifying the surface's anti-inflammatory and anti-thrombogenic response, vasoactive tone and fibroblast activity, and extracellular remodeling 9,10,22,30,34. Under low wall shear stress loads (<0.4 Pa), however, wall shear stress promotes atherogenic phenotype and wall degenerative processes 30,45. Low wall shear stress and oscillatory flow are commonly found at the distal aorta in patients with special conditions as limb amputation and spinal cord injuries, or in patients with low physical activities. These patients have been proven to have higher risk of AAA progression 12.
Interestingly, abnormal flow patterns such as low wall shear stress levels, flow separation, and formation of vortex rings are flow characteristics found even at the earliest stages of aneurysm development38. In addition, a lowering of hemodynamic shear stress levels were described as AAA enlarged. In other types of aneurysms, for instance intracranial, a negative correlation between hemodynamic wall shear and surface displacement during expansion were found 7. This negative direct correlation, however, may not be simple to test in AAAs since 75% of them are partially or fully covered by intraluminal thrombus (ILT) layers 25.
Physiologically speaking, ILT is found covering the aneurysm lumen wall, increasing its prevalence as AAA enlarges 41. The mechanism that leads thrombus accumulation are still not well understood; While it is still uncertain whether platelets are mechanically activated4, or biochemical induced23, it is known that hemodynamic forces play an important role. Doyle and colleagues 11, by using a patient-specific geometry of one patient observed that the regions where the AAA expanded coincided with the regions of low TAWSS and ILT accumulation, which in turn was the same area that experienced ruptured. Recently, Arzani and colleagues 2 investigated the relationship between the changes of ILT and hemodynamic variables at mid aneurysm cross-sections. They found a strong correlation between near wall recirculation zones and thrombus accumulation.
Once ILT is formed, it disrupts the direct interaction between hemodynamic forces and the aneurysm wall, and potentially affecting the AAA wall strength and stress. In fact, studies that have compared AAA wall characteristics between those aneurysms with and without ILT suggested that ILT may cause hypoxia 49,50, wall thinning, cell inflammation, apoptosis of smooth muscle cells, and degradation of the extracellular matrix 27 of walls covered by thick thrombus, thus weakening the wall and potentially lowering the wall tensile strength. It is suggested though that wall weakening in regions covered by a thick thrombus is not caused by ILT released proteases that are capable of cell degradation. It has been shown that these enzymes released by ILT at the abluminal layer are inactive 16 and, therefore, may not affect wall strength. Similar to its influence on wall strength, ILT is also been thought to affect wall stress. Numerical studies have found ILT to lower wall stress 6,18,29,32,33,47,51, suggesting that its presence could prevent AAA rupture. An in vivo study, however, challenged this beneficial effect of the ILT since it found no significant pressure reduction at wall regions covered by the thrombus 39, suggesting no reduction in wall stress 13.
All these previous findings have successfully shown the different relationships between two of these three factors. However, the same studies have also shown the close dependence between hemodynamic forces, ILT accumulation and AAA progression, indicating the importance of studying them together. Hence, this study analyzed these three factors using longitudinal computer tomography (CT) images of 14 patients. The inclusion of real AAA geometries for patient specific computational fluid dynamics (CFD) simulations improves the flow prediction and enables the capability of developing a better understanding about mechanisms that promote ILT accumulation and AAA expansion related to hemodynamic forces.
2. Methods
Sixty two CT scans from longitudinal follow-up studies of 14 patients, taken at Seoul National University Hospital, were used for the present analysis. Each patient had a set of 2 to 7 CT scans. The study had access to the time interval between scans (table I). All data collection and usage were in compliance with guidelines established by the Institutional Review Board at Seoul National University Hospital and at Michigan State University.
Table 1. The time interval between two consecutive scans for 14 patients.
| Time interval (years) | |||||||
|---|---|---|---|---|---|---|---|
| Patients | 1-2 | 2-3 | 3-4 | 4-5 | 5-6 | 6-7 | |
| P-1 | 0.50 | ||||||
| P-2 | 0.56 | 1.45 | |||||
| P-3 | 1.73 | ||||||
| P-4 | 1.35 | 2.36 | |||||
| P-5 | 0.48 | 0.50 | 0.49 | 0.48 | 0.52 | ||
| P-6 | 1.07 | 4.69 | 0.95 | 0.97 | 0.96 | 0.46 | |
| P-7 | 1.02 | 1.02 | 0.90 | 1.00 | 1.91 | ||
| P-8 | 1.06 | 1.02 | 1.00 | 0.46 | |||
| P-9 | 0.62 | 1.22 | 1.03 | 0.97 | |||
| P-10 | 0.27 | 0.46 | 0.82 | ||||
| P-11 | 0.46 | 1.05 | 1.01 | 1.16 | 1.01 | ||
| P-12 | 2.09 | 0.45 | 0.69 | 0.70 | 0.32 | ||
| P-13 | 1.09 | 1.03 | 1.04 | ||||
| P-14 | 1.23 | 0.46 | |||||
Each patient's CT scan was imported to the biomedical imaging software Mimics (Materialise, Leuven, Belgium) where lumen and AAA outer surfaces were segmented and 3-D volumes were generated. A centerline was calculated for each patient's scan, and it was later used to section AAA volumes in orthogonal planes to this line at the renal and the iliac bifurcation levels. Once the upper and lower boundaries were determined, lumen and AAA volumes were obtained. The ILT volume for each scan was calculated by subtracting the value of the lumen volume from that of the AAA volume.
For the maximum diameter calculation, the method of inscribed spheres19, which consist of calculating diameters of maximally inscribed spheres along the centerline, was used. Therefore, the largest value of the diameter along the centerline was defined as the maximum diameter.
To calculate AAA's outer and lumen cross-section areas at the location of maximum diameter, an orthogonal plane to the centerline at the location of the maximum diameter was first generated. The intersection between the orthogonal plane, the AAA's outer wall and lumen wall surface were used to delineate cross section areas. After delineating the cross section contour, the cross section areas for AAA and lumen were generated and calculated.
Computational fluid dynamic (CFD) analysis
For the CFD analysis, wall shear stress (WSS) was estimated using 3-D lumen volumes of patients. Renal branches were trimmed and lumen volumes were truncated approximately above the renal level and after the iliac bifurcation. Since a fully developed flow assumption was used at the inlet and outlet boundaries, the specific location of these truncations for the CFD analysis changed from patient to patient. Additionally, extended boundaries were created at the inlet and outlets of the flow by approximately three times the inflow diameter in order to avoid numerical instabilities (Figure 1) 3. The estimation of the extension length was done using the relationship suggested by Wood and colleagues 53
Figure 1.

Volume flow rate and pressure outlet waves imposed at the inlet and outlet, respectively. This figure also shows the inlet and outlet extension made to the inlet and outlet boundaries in order to avoid numerical instabilities
All lumen volumes of all patients were used except patient 4. The CT image resolution required to obtain an accurate estimation of the WSS values for patient 4 was not optimal; and, therefore, this patient was excluded just from the CFD analysis.
Once the computational domain was defined, models were meshed using ICEM (ANSYS Inc, Lebanon, NH, USA). A sensitivity analysis was performed by using 4 different element sizes (0.95, 0.8, 0.6, and 0.55 mm) and by testing our variables of interest (i.e., WSS). From this preliminary CFD analysis, a mesh of an element size of 0.6 mm was found to be optimal for this analysis. This edge length resulted in a mesh size that ranged between approximately 5-8 millions of elements. The element size and computational size domain obtained from this analysis are similar of what others have reported for similar CFD analysis 1,2,28.
Hemodynamic simulations using FLUENT (ANSYS Inc, Lebanon, NH, USA) were performed on each lumen model under the assumption of laminar incompressible flow (ρ=1060 Kg/m3) with rigid walls. Idealistic time-dependent volume flow rate and pressure waves were imposed at the inlet and outlets based on data presented by Olufsen and colleagues 35 (Figure 1). The disaggregation of red blood cells (RBCs) due to shear stresses makes blood to be considered a non-Newtonian fluid with high shear-thinning. This shear-thinning behavior has an impact on the flow structure, including in the fluid circulation near the surface 21 and it was captured in the present study by using the Carreau-Yasuda model 20.
A time step of 0.001s (1000 time step per cardiac cycle) was chosen and the flow field was saved every 5 time steps (200 time steps per cardiac cycle). In order to minimize the error due to the initial condition, the first two cardiac cycles were discarded from the analysis and the third cardiac cycle was averaged to obtain a time-average wall shear stress (TAWSS) values. Additionally, values of TAWSS were also averaged throughout the surface and used in this analysis
ILT morphology
To characterize the process of the ILT accumulation inside AAAs, changes in the spatial distribution of ILT thickness were calculated from patients' CT scans taken at different time points. ILT thicknesses were calculated as the normal distance between lumen and AAA's outer wall surfaces. Since it was challenging to delineate the boundaries between the aneurysmal wall and the thrombus layer using CT scans, ILT thicknesses were here considered as the addition of the ILT and aneurysmal wall thicknesses. Previous studies have estimated the AAA wall thickness to be between 0.23 mm and 4.23 mm 31,36,46. Therefore, areas with ILT thickness values of less than 3.5 mm were considered as areas with no ILT.
To study the relationship between hemodynamic forces, AAA growth and ILT accumulation, each scan of each patient was classified as one with or without an ILT content using the wall fraction of area covered by ILT criteria. The fraction was calculated by dividing the measure of the AAA wall area covered by ILT over the surface measurement of the AAA wall. A surface fraction threshold of 0.2 was assumed and used as a threshold to classify AAAs in two groups: “AAAs with ILT” and “AAAs without ILT”. Classifying scans independently rather than patients helped to increase the accuracy of our observations since ILT can be accumulated at any time during the surveillance period.
Relations between measurements and statistical analysis
Statistical analyses were performed using the Matlab software (Mathwork, Natick, USA). A linear regression was used to examine the relationship between the ILT accumulation rate and the AAA expansion rate on AAA's CT scans classified as with an ILT accumulation. Additionally, the relationship between the maximum equivalent diameter and maximum ILT thickness at the region of maximum diameter was investigated using Pearson's correlation coefficient for all patients.
3. Results
Classification according to the AAA wall area covered by ILT
In order to understand hemodynamic differences between AAAs with an ILT accumulation from those that did not show ILT, each patient was analyzed according to the area covered by thrombus. Results from this analysis showed that 5 patients presented a significant ILT accumulation from the beginning of the surveillance study (P4, P10, P11, P13, P14), 4 patients showed an ILT buildup while AAAs were under surveillance (P5, P6, P8, and P9), and 5 patients were found not to show any significant ILT accumulation (P1-P3, P7, and P12; Figure 2a). The ILT thickness distributions of patients at their last scans are shown in Figure 2b.
Figure 2.

(a) Fraction of the AAA wall area covered by ILT showing the classification between AAAs with and without ILT according to the 0.2 threshold (---) (b) The ILT thickness distribution of all AAAs at their respective last scan shows the ILT accumulation for each patient.
ILT accumulation process
In AAAs that showed an ILT buildup, observed spatial distribution of the ILT thickness through time showed that all followed a common development pattern (Figure 3). Specifically, all ILTs began as a localized buildup at the region of maximum diameter. From this region, ILTs spread to the surrounding areas at the same time as an increase in ILT thickness was observed on areas previously covered by ILT. This process occurred gradually as the aneurysm expanded. Sequential 3-D images (Figure 3a) and circumferentially averaged values of ILT thickness plotted in the longitudinal direction (Figure 3b) demonstrate this ILT growth pattern in patients P-8 and P-9 as en example of the common pattern found in all patients with an ILT buildup. Note that in both patients, the location where the thrombus was the thickest varied throughout the scans but was located within regions of maximum diameter.
Figure 3.
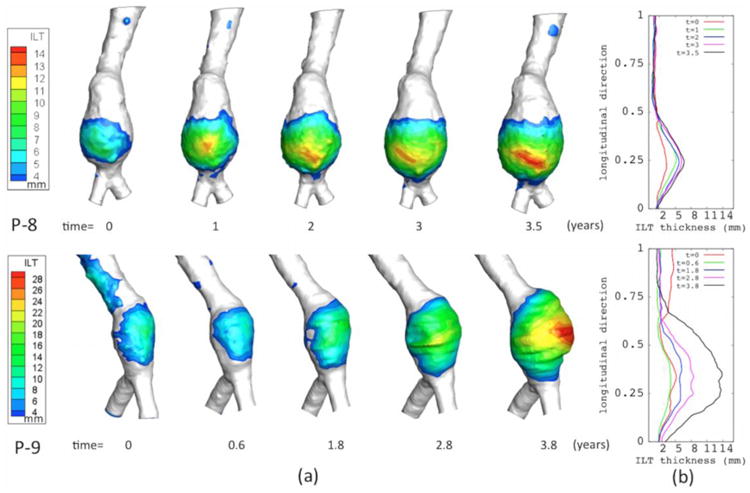
The ILT accumulation process using: (a) Spatial distribution of ILT thickness for patients P-8, and P-9 at all their scans, and (b) the circumferentially averaged values of ILT along the longitudinal direction. (These two plots show that ILT is initially found at region of maximum diameter and from here ILT spread and accumulates as the aneurysm expands.)
A positive correlation coefficient between maximum ILT thickness and maximum diameter was found for all patients with ILT, which agrees with the above described accumulation process (r=0.681, P<.001).
CFD Analysis
Blood flow pattern
Results from CFD analysis performed on all aneurysms showed some similarities and differences in the blood flood pattern between AAA's that showed an ILT deposition from those that did not develop it. While recirculation zones inside the sac region that formed after peak systolic and in some cases remaining through the cardiac cycle was commonly observed among them, the magnitude of the velocity of these recirculation zones near the lumen wall showed to be lower in AAAs that developed ILT from those that remained without a significant accumulation. An illustration of this is shown in Figure 4 when the magnitude of time-averaged velocity is plotted at specific longitudinal cross sections for 3 AAAs (P01 at scans 1 and 2, P06 at scans 2 and 3, and P08 at scans 4 and 5). From P06 and P08 it can be clearly seen that regions of low time-averaged velocity coincided with the regions of ILT accumulation. Another illustration of this trend is showed by P01 that experienced high magnitude of time-averaged velocity near the wall in most of its lumen surface except at a small region; the same region at which, ILT accumulation was later seen. From the cross-sectional analysis (not shown here), it was also found that the direction of the flow at regions near the wall areas covered by ILT was dominantly aligned with the normal flow direction (from proximal to distal). However, reverse flow was seen at these areas at certain scans; nevertheless, these reverse flows realign with the normal flow direction at the following scans.
Figure 4.
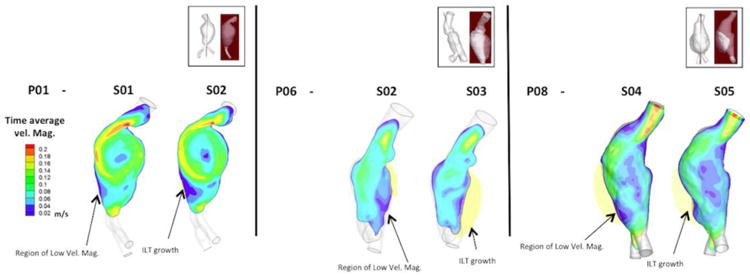
Color contour of magnitude of time-averaged velocity plotted at particular longitudinal cross sections (shown at the top figure) for AAAs P01, P06 and P08; respectively. These plots qualitatively show that regions of low time-averaged velocity coincide with regions that experienced an ILT growth.
Wall shear stress
Differences in flow pattern found between AAAs with and without significant thrombus depositions were reflected in the TAWSS values. Figure 5 illustrated this effect by comparing TAWSS between 4 AAAs and a Healthy aorta. Results show that despite the fact that low TAWSS values were found in all AAAs in comparison to the Healthy aorta; these values were lower in those aneurysms at the time that they developed a thick ILT. This trend was also captured when values of TAWSS at all AAAs' time points (scans) were average over the entire lumen surface, namely called “mean TAWSS”, and plotted as a function of its maximum diameter. Figure 6a and Figure 6b shows these mean TAWSS values for groups of AAAs without and with ILT accumulation respectively. From these plots, it can be observed that AAAs with ILT deposition recorded lower mean TAWSS values than those without an ILT. Also, while a decreasing mean TAWSS trend as diameter increases was found in all AAAs without ILT but patient P12 (figure 6a), AAAs with ILT accumulation showed nearly constant values of TAWSS at larger diameters (Figure 6b).
Fig 5.
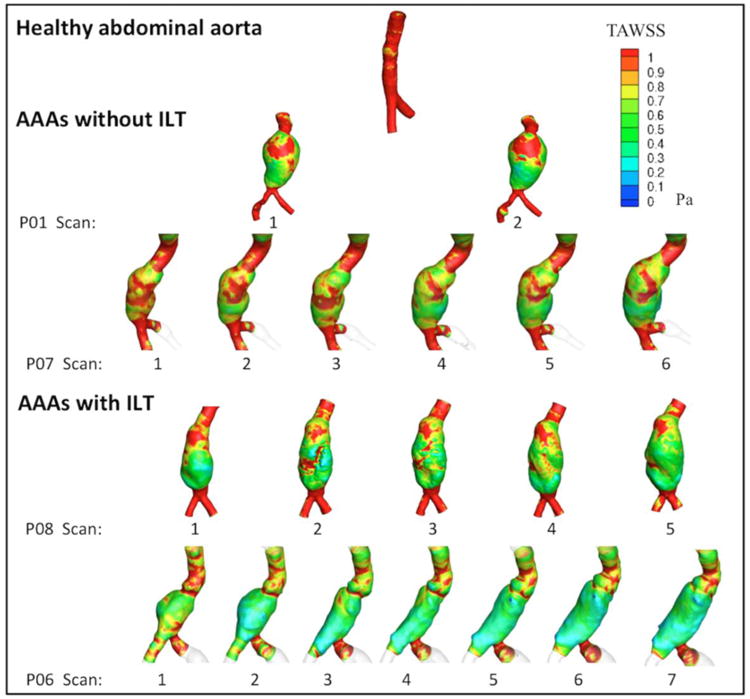
Color-coded time averaged wall shear stress (TAWSS) for patients with and without ILT showing lower TAWSS values on AAAs with an ILT accumulations from those that did not developed thrombus.
Fig 6.

mean TAWSS as a function of maximum diameter of patients with (a) and without (b) ILT deposition. (These plots show that patients without ILT accumulation recorded higher mean TAWSS values then those (b) with ILT deposition). Additionally, while a decreasing trend was found in all patients without ILT accumulation (a) but patient 12, mean TAWSS values were nearly constant in patient with ILT accumulation (b) at larger diameters.
ILT accumulation and Wall shear stress relationship
The relationship between the ILT accumulation process and TAWSS was studied by plotting TAWSS values and ILT thickness for all lumen surfaces' nodal points of each AAA at each scan. Figure 7 illustrates the results for P8 and P9 and shows that ILT accumulated at areas of low TAWSS (yellow). It also showed that as ILT accumulates, the values of wall shear stress fluctuate within a low range. This trend was followed for all AAAs that developed significant ILT.
Figure 7.
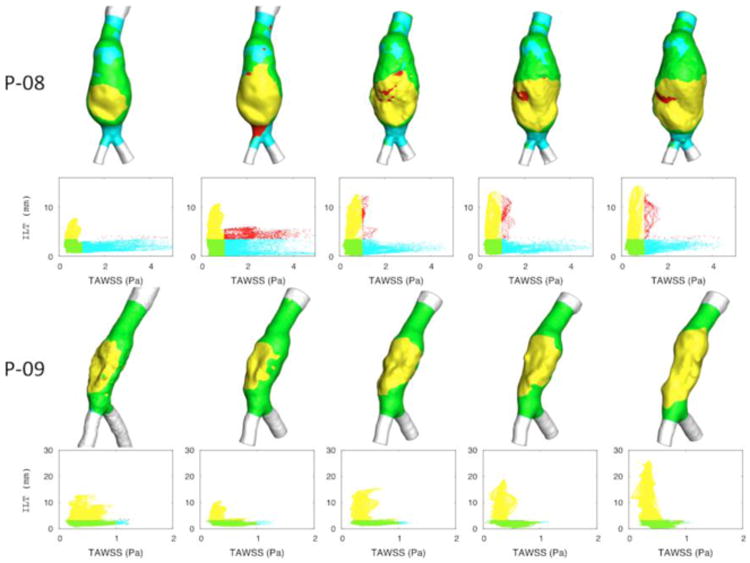
TAWSS values of all lumen surfaces' nodal points at each scan of patient P08 and P09. Four regions were depicted with different colors: high TAWSS and low (cyan) or high (red) ILT thickness, and low TAWSS and low (green) or high (yellow) ILT thickness. (It shows that ILT accumulated at areas of low TAWSS (yellow). It also showed that as ILT accumulates, values of wall shear stress fluctuate within a low range.).
AAA expansion rates and ILT accumulation rates analysis
Using 29 samples from the group of AAA scans classified as “with an ILT”, a linear regression was conducted for the ILT accumulation rate and AAA expansion rate, which revealed a positive linear correlation (Rsq=0.738; AȦAexp = p1 * IL̇Tacum = p2; p1 = 0.87 ± 0.203, p2 = 10440 ± 4335; Figure 8). A statistical test of the null hypothesis that the slope of ILT accumulation rate is 1 from the result of linear regression gives us the value of t-statistics as 0.591 with the corresponding p-value as 0.559. This indicates that the ILT accumulation rate is statistically not different from the aneurysm expansion rate (t=0.591, P=0.559). In other words, it was found that ILT accumulates at the same rate as the aneurysm expands.
Figure 8.

Linear regression shows the linear positive correlation between ILT accumulation rate and AAA expansion rate (Rsq=0.738). (This plot shows that for these AAAs, ILT accumulates at the same rate that aneurysm (AȦAexp = p1 * IL̇Tacum = p2; p1 = 0.87 ± 0.203, p2 = 10.44 ± 43.35))
This finding and the positive correlation between ILT thickness and diameter reported above suggest that ILT might be occupying the expanded AAA areas, thus maintaining the lumen cross-section nearly constant. To confirm this, AAA and lumen cross-sectional areas at the region of maximum diameter were determined (Figure 9a). Analysis showed that, while the AAA cross-section area increased, the lumen cross-section area remained nearly constant. This relation is qualitatively (Figure 9b) and quantitatively (Figure 9c) shown for sequential scans at the region of maximum diameter for patients P-6, P-8, P-9 and P-11
Figure 9.
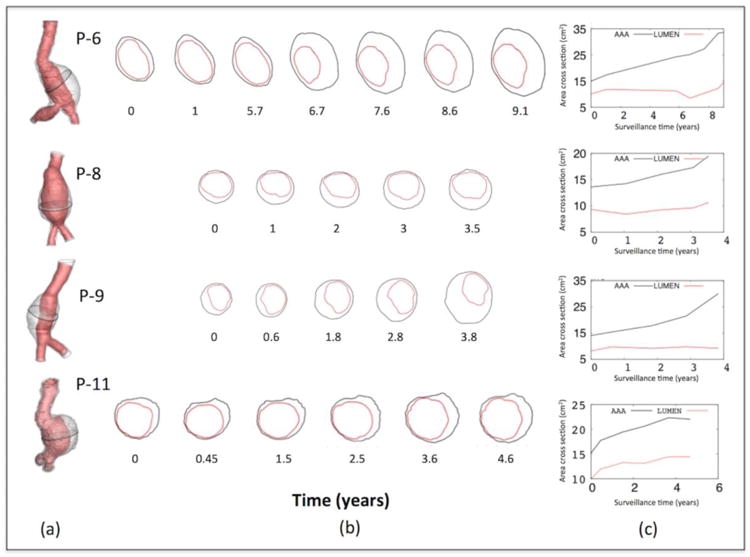
Lumen and AAA's outer cross-sectional areas at the region of maximum diameter for patients P-6, P-7, P-9, and P-11. (a) Shows the cross section at the maximum diameter location (b) qualitative shows the increasing of the cross-sectional AAA outer area while the lumen area remained nearly constant. (c) Values of both cross-sectional areas at different times showing the same effect.
Relationships between mean TAWSS, AAA expansion rate, and ILT accumulation rate
Results from mean TAWSS confirmed that AAAs classified as with an ILT showed lower mean TAWSS values than those that were classified as without ILT (Figure 10a-b). Comparing the results of mean TAWSS and the AAA expansion rate for these two groups of AAAs, it was observed that the highest expansion rates were recorded in patients that showed an ILT accumulation and lowest mean TAWSS values (Figure 10a). A similar pattern was found when mean TAWSS values were compared to ILT accumulation rates (Figure 10b). Similarly to the AAA expansion rates, the highest ILT accumulation rates were recorded at aneurysms with low mean TAWSS.
Figure 10.
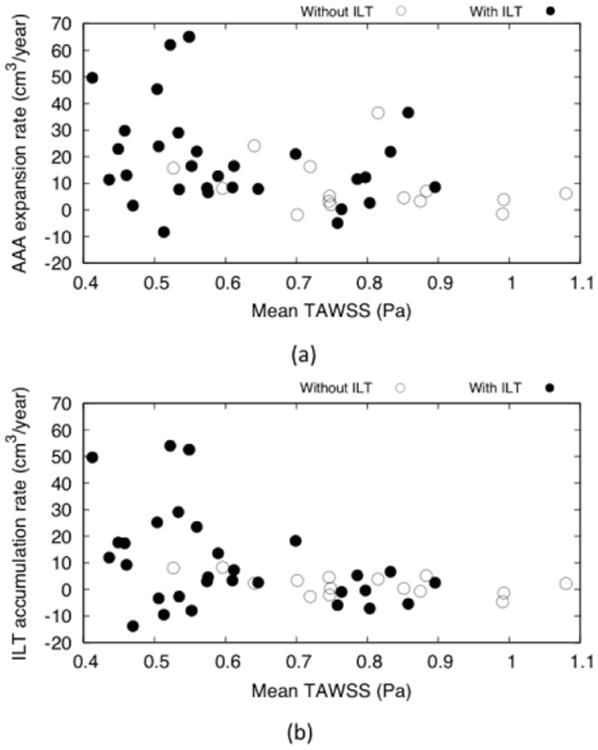
Mean wall shear stress (TAWSS) values associated for AAAs with and without ILT associated with: (a) AAA expansion rate and (b) ILT accumulation rate. Here it can be seen that AAAs with no ILT have an overall higher mean TAWSS values than AAAs with an ILT accumulation. Conversely, higher values of ILT accumulation and AAA expansion rates were recorded in AAAs with an ILT accumulation that in turn also showed a lower mean TAWSS values.
4. Discussion
This study used longitudinal CT images from 14 different patients and analyzed the relationship between the ILT accumulation process, wall shear stress changes, and AAA expansion. Results showed that the ILT accumulation process began at a localized region of maximum diameter and spread to neighboring regions while ILT continued to thicken at previously covered areas. While low wall shear stress showed to be a common feature on the regions where ILT deposition occurred, the rate at which ILT accumulated occurred at the same rate as the aneurysm expansion. Comparison between AAAs with and without thrombus showed that aneurysm with ILT recorded lower values of wall shear stress and higher values of AAA expansion than those AAAs free of thrombus.
The dynamics of the ILT accumulation process is here described for the first time using a macroscopic perspective. Briefly, ILTs were most often found accumulating eccentrically in the AAA 24, and their localization and initial accumulation were both observed in regions of maximum diameter. The continuous ILT thickening and outward spreading pattern described here agrees with the hypothesis that the luminal layer is active and interacts with the main blood flow, which might enhance further thrombus accumulation 16.
The ILT accumulation process described above for AAAs that showed an ILT buildup in conjunction with the positive correlation seen between ILT thickness and diameter suggests that ILT accumulates at the AAA regions that have expanded, agreeing with what Wilson and colleagues 52 hypothesized. Therefore, it is expected to find larger ILT volumes at larger diameters, as it was found by Hans and colleagues 24. This trend, however, cannot be generalized for all aneurysms since our results showed a few AAAs that despite their large size, were found free of thrombus. Interestingly, in these AAAs, mean TAWSS values were higher than in those AAAs that developed a thick ILT. This result suggests that high values of wall shear stress would prevent the ILT from accumulating. It has been previously proposed that increasing the values of wall shear stress would attenuate AAA growth 28. Our results would additionally suggest that by increasing wall shear stress values e.g., by exercising, ILT deposition could also be prevented.
On the other hand, once this ILT process begins, it accumulates at the same rate that AAA expands; maintaining the lumen area nearly constant. This nearly constant area would also impact hemodynamic conditions. In fact, our results showed that values of TAWSS on average would remain nearly constant on aneurysms of larger diameters. In other words, all these findings indicate that while low values of wall shear stress are promoting ILT accumulation; the thrombus accumulation may be at the same time modifying values of wall shear stress.
The effect of ILT on AAA prognosis has also been studied by other using different approaches 27,49,50,6,18,29,32,33,47,51 and the possible association between thrombus accumulation and AAA growth has been proposed 44. Our results agree with the suggestion of an association between ILT and AAA growth since higher values of aneurysm expansion rate were recorded on AAAs with an ILT accumulations in comparison to those that remained free of thrombus. It is worth to note that these AAAs that showed higher expansion rate values were in turn AAAs that showed lower values of wall shear stress.
The positive association between aneurysm size and AAA expansion has been widely proposed and the relationship between wall stress and strength is expected to be linear and gradually changing as the aneurysm progresses 8,48. The hemodynamic forces, however, responsible of imposing the wall shear stress also change 14,15,38. Albeit multiple hemodynamic factors (oscillatory shear index, endothelial cell activation potential or thrombus activation potential 1,2) along with the wall shear stress have been proposed as key factors in the accumulation process and further AAA expansion.
Once ILT is initially adhered to the lumen wall, it would enhance the adhesion of new fresh thrombus at regions where wall shear stress is favorable for its adhesion (low WSS regions). This adhesion would in turn activate proteolytic degradation with stress-mediated growth4 that modifies the AAA wall stress and strength27,49,50,6,18,29,32,33,47,51. Therefore, as AAA expands, ILT would accumulate and spread throughout the AAA sac modifying the wall stress-strength relationship strongly. At the same time, the ILT accumulation would promote a reduction of the lumen passage, which in turn would have an impact in the hemodynamic conditions. These hemodynamic conditions would be lowering gradually as AAA expands and thus promoting further accumulation. In summary, once ILT begins to accumulates, it would slowly impact the wall-strength relationship and potentially enhancing AAA expansion while modifying wall shear stress levels. This WSS level would be also modified by AAA expansion
Like most human studies, this investigation had limitations that need to be considered while interpreting the results. This study used sequential CT scans from 14 patients, and it would be ideal to increase the sample size to reach stronger conclusions. Additionally, it was difficult to accurately differentiate the aneurysm wall from the thrombus layer 42. This required the summation of ILT and AAA wall thicknesses and that a uniform 3mm AAA wall thickness was assumed for analysis. This assumption could have over- or underestimated the value of the ILT thickness. The results for hemodynamic simulations of this study were obtained based on volumetric flow rate of a young healthy aorta. Although the volumetric flow rate and pressure wave as inlet and outlet are commonly used for setting up the boundary conditions 3,4, the evolution of AAA may have effects on the total rate or profiles of inlet and outlet flow and quantitative measurements of flow rates for individual patients will be needed for better estimation of the blood flow. Despite the limitations that this assumption could have instilled, results in this study are consistent with previous findings.
In closing, this study used longitudinal studies of 14 patients and analyzed the relationship between ILT accumulation, wall shear stress and AAA expansion. The findings presented explained the ILT accumulation process and showed that ILT accumulated at the same rate as the AAA expansion rate. Additionally, our results support the idea that suggests that low wall shear stress level would promote ILT deposition and submits the hypothesis that by increasing wall shear stress levels thrombus accumulation inside AAA can be avoided.
Acknowledgments
The authors gratefully acknowledge the support, in part, by the National Heart, Lung, and Blood Institute of the National Institutes of Health (R01HL115185 and R21HL113857) and National Science Foundation (CMMI-1150376). The contents are solely the responsibility of the authors and do not necessarily represent the official views of the NIH and NSF.
Bibliography
- 1.Di Achille P, Tellides G, Figueroa CA, Humphrey JD. A haemodynamic predictor of intraluminal thrombus formation in abdominal aortic aneurysms. Proc R Soc Lond Math Phys Eng Sci. 2014;470:20140163. [Google Scholar]
- 2.Arzani A, Suh GY, Dalman RL, Shadden SC. A longitudinal comparison of hemodynamics and intraluminal thrombus deposition in abdominal aortic aneurysms. Am J Physiol - Heart Circ Physiol. 2014 doi: 10.1152/ajpheart.00461.2014. ajpheart.00461.2014. [DOI] [PMC free article] [PubMed] [Google Scholar]
- 3.Basciano C, Kleinstreuer C, Hyun S, Finol EA. A relation between near-wall particle-hemodynamics and onset of thrombus formation in abdominal aortic aneurysms. Ann Biomed Eng. 2011;39:2010–2026. doi: 10.1007/s10439-011-0285-6. [DOI] [PMC free article] [PubMed] [Google Scholar]
- 4.Biasetti J, Gasser TC, Auer M, Hedin U, Labruto F. Hemodynamics of the Normal Aorta Compared to Fusiform and Saccular Abdominal Aortic Aneurysms with Emphasis on a Potential Thrombus Formation Mechanism. Ann Biomed Eng. 2009;38:380–390. doi: 10.1007/s10439-009-9843-6. [DOI] [PubMed] [Google Scholar]
- 5.Biasetti J, Hussain F, Gasser TC. Blood flow and coherent vortices in the normal and aneurysmatic aortas: a fluid dynamical approach to intra-luminal thrombus formation. J R Soc Interface R Soc. 2011;8:1449–1461. doi: 10.1098/rsif.2011.0041. [DOI] [PMC free article] [PubMed] [Google Scholar]
- 6.Bluestein D, Dumont K, De Beule M, Ricotta J, Impellizzeri P, Verhegghe B, Verdonck P. Intraluminal thrombus and risk of rupture in patient specific abdominal aortic aneurysm - FSI modelling. Comput Methods Biomech Biomed Engin. 2009;12:73–81. doi: 10.1080/10255840903077170. [DOI] [PubMed] [Google Scholar]
- 7.Boussel L, Rayz V, McCulloch AC, Martin A, Acevedo-Bolton G, Lawton M, Higashida R, Smith WS, Young WL, Saloner D. Aneurysm growth occurs at region of low wall shear stress: patient-specific correlation of hemodynamics and growth in a longitudinal study. Stroke. 2008;39:2997. doi: 10.1161/STROKEAHA.108.521617. [DOI] [PMC free article] [PubMed] [Google Scholar]
- 8.Brady AR, Thompson SG, Fowkes FG, Greenhalgh RM, Powell JT. Abdominal Aortic Aneurysm Expansion Risk Factors and Time Intervals for Surveillance. Circulation. 2004;110:16–21. doi: 10.1161/01.CIR.0000133279.07468.9F. [DOI] [PubMed] [Google Scholar]
- 9.Chatzizisis YS, Coskun AU, Jonas M, Edelman ER, Feldman CL, Stone PH. Role of Endothelial Shear Stress in the Natural History of Coronary Atherosclerosis and Vascular Remodeling. J Am Coll Cardiol. 2007;49:2379–2393. doi: 10.1016/j.jacc.2007.02.059. [DOI] [PubMed] [Google Scholar]
- 10.Dalman RL. Oxidative stress and abdominal aneurysms: how aortic hemodynamic conditions may influence AAA disease. Cardiovasc Surg Lond Engl. 2003;11:417–419. doi: 10.1016/S0967-2109(03)00075-9. [DOI] [PubMed] [Google Scholar]
- 11.Doyle BJ, McGloughlin TM, Kavanagh EG, Hoskins PR. From Detection to Rupture: A Serial Computational Fluid Dynamics Case Study of a Rapidly Expanding, Patient-Specific, Ruptured Abdominal Aortic Aneurysm. In: Doyle B, Miller K, Wittek A, Nielsen PMF, editors. Computational Biomechanics for Medicine. Springer; New York: 2014. pp. 53–68. [Google Scholar]
- 12.Dua MM, Dalman RL. Hemodynamic Influences on Abdominal Aortic Aneurysm Disease: Application of Biomechanics to Aneurysm Pathophysiology. Vascul Pharmacol. 2010;53:11–21. doi: 10.1016/j.vph.2010.03.004. [DOI] [PMC free article] [PubMed] [Google Scholar]
- 13.Farsad M, Zambrano B, Baek S. Data-guided growth and remodeling model of abdominal aortic aneurysm accounting for the bio-chemical effects of intraluminal thrombus, Computational Biomechanics for Medicine. Springer. 2015;6:13–23. [Google Scholar]
- 14.Finol EA, Amon CH. Flow-induced wall shear stress in abdominal aortic aneurysms: Part I--steady flow hemodynamics. Comput Methods Biomech Biomed Engin. 2002;5:309–318. doi: 10.1080/1025584021000009742. [DOI] [PubMed] [Google Scholar]
- 15.Finol EA, Amon CH. Flow-induced wall shear stress in abdominal aortic aneurysms: Part II--pulsatile flow hemodynamics. Comput Methods Biomech Biomed Engin. 2002;5:319–328. doi: 10.1080/1025584021000009751. [DOI] [PubMed] [Google Scholar]
- 16.Folkesson M, Silveira A, Eriksson P, Swedenborg J. Protease activity in the multi-layered intra-luminal thrombus of abdominal aortic aneurysms. Atherosclerosis. 2011;218:294–299. doi: 10.1016/j.atherosclerosis.2011.05.002. [DOI] [PubMed] [Google Scholar]
- 17.Gaillard E, Bergeron P, Deplano V. Influence of Wall Compliance on Hemodynamics in Models of Abdominal Aortic Aneurysm. J Endovasc Ther. 2007;14:593–599. doi: 10.1177/152660280701400423. [DOI] [PubMed] [Google Scholar]
- 18.Georgakarakos E, Ioannou CV, Volanis S, Papaharilaou Y, Ekaterinaris J, Katsamouris AN. The influence of intraluminal thrombus on abdominal aortic aneurysm wall stress. Int Angiol J Int Union Angiol. 2009;28:325–333. [PubMed] [Google Scholar]
- 19.Gharahi H, Zambrano BA, Lim C, Choi J, Lee W, Baek S. On growth measurements of abdominal aortic aneurysms using maximally inscribed sphere. Med Eng Phys. 2015;37:683–691. doi: 10.1016/j.medengphy.2015.04.011. [DOI] [PMC free article] [PubMed] [Google Scholar]
- 20.Gijsen FJH, van de Vosse FN, Janssen JD. Wall shear stress in backward-facing step flow of a red blood cell suspension. Biorheology. 1998;35:263–279. doi: 10.1016/S0006-355X(99)80010-9. [DOI] [PubMed] [Google Scholar]
- 21.Gijsen FJ, van de Vosse FN, Janssen JD. The influence of the non-Newtonian properties of blood on the flow in large arteries: steady flow in a carotid bifurcation model. J Biomech. 1999;32:601–608. doi: 10.1016/s0021-9290(99)00015-9. [DOI] [PubMed] [Google Scholar]
- 22.Gimbrone MA, Anderson KR, T JN, et al. Special communication: the critical role of mechanical forces in blood vessel development, physiology and pathology. J Vasc Surg. 1999;29:1104–1151. doi: 10.1016/s0741-5214(99)70252-1. [DOI] [PubMed] [Google Scholar]
- 23.Hansen KB, Arzani A, Shadden SC. Mechanical Platelet Activation Potential in Abdominal Aortic Aneurysms. J Biomech Eng. 2015;137:041005–041005. doi: 10.1115/1.4029580. [DOI] [PMC free article] [PubMed] [Google Scholar]
- 24.Hans SS, Jareunpoon O, Balasubramaniam M, Zelenock GB. Size and location of thrombus in intact and ruptured abdominal aortic aneurysms. J Vasc Surg Off Publ Soc Vasc Surg Int Soc Cardiovasc Surg North Am Chapter. 2005;41:584–588. doi: 10.1016/j.jvs.2005.01.004. [DOI] [PubMed] [Google Scholar]
- 25.Harter LP, Gross BH, Callen PW, Barth RA. Ultrasonic evaluation of abdominal aortic thrombus. J Ultrasound Med Off J Am Inst Ultrasound Med. 1982;1:315–318. doi: 10.7863/jum.1982.1.8.315. [DOI] [PubMed] [Google Scholar]
- 26.Humphrey JD. Vascular adaptation and mechanical homeostasis at tissue, cellular, and sub-cellular levels. Cell Biochem Biophys. 2008;50:53–78. doi: 10.1007/s12013-007-9002-3. [DOI] [PubMed] [Google Scholar]
- 27.Kazi M, Thyberg J, Religa P, Roy J, Eriksson P, Hedin U, Swedenborg J. Influence of intraluminal thrombus on structural and cellular composition of abdominal aortic aneurysm wall. J Vasc Surg Off Publ Soc Vasc Surg Int Soc Cardiovasc Surg North Am Chapter. 2003;38:1283–1292. doi: 10.1016/s0741-5214(03)00791-2. [DOI] [PubMed] [Google Scholar]
- 28.Les AS, Shadden SC, Figueroa CA, Park JM, Tedesco MM, Herfkens RJ, Dalman RL, Taylor CA. Quantification of hemodynamics in abdominal aortic aneurysms during rest and exercise using magnetic resonance imaging and computational fluid dynamics. Ann Biomed Eng. 2010;38:1288–1313. doi: 10.1007/s10439-010-9949-x. [DOI] [PMC free article] [PubMed] [Google Scholar]
- 29.Li ZY, U-King-Im J, Tang TY, Soh E, See TC, Gillard JH. Impact of calcification and intraluminal thrombus on the computed wall stresses of abdominal aortic aneurysm. J Vasc Surg. 2008;47:928–935. doi: 10.1016/j.jvs.2008.01.006. [DOI] [PubMed] [Google Scholar]
- 30.Malek AM, Alper SL, Izumo S. Hemodynamic shear stress and its role in atherosclerosis. JAMA. 1999;282:2035–2042. doi: 10.1001/jama.282.21.2035. [DOI] [PubMed] [Google Scholar]
- 31.Di Martino ES, Bohra A, Vande Geest JP, Gupta N, Makaroun MS, Vorp DA. Biomechanical properties of ruptured versus electively repaired abdominal aortic aneurysm wall tissue. J Vasc Surg. 2006;43:570–576. doi: 10.1016/j.jvs.2005.10.072. [DOI] [PubMed] [Google Scholar]
- 32.Di Martino ES, Mantero S, Inzoli F, Melissano G, Astore D, Chiesa R, Fumero R. Biomechanics of abdominal aortic aneurysm in the presence of endoluminal thrombus: Experimental characterisation and structural static computational analysis. Eur J Vasc Endovasc Surg. 1998;15:290–299. doi: 10.1016/s1078-5884(98)80031-2. [DOI] [PubMed] [Google Scholar]
- 33.Mower WR, Quiñones WJ, Gambhir SS. Effect of intraluminal thrombus on abdominal aortic aneurysm wall stress. J Vasc Surg Off Publ Soc Vasc Surg Int Soc Cardiovasc Surg North Am Chapter. 1997;26:602–608. doi: 10.1016/s0741-5214(97)70058-2. [DOI] [PubMed] [Google Scholar]
- 34.Nakahashi TK, Hoshina K, Tsao PS, Sho E, Sho M, Karwowski JK, Yeh C, Yang RB, Topper JN, Dalman RL. Flow Loading Induces Macrophage Antioxidative Gene Expression in Experimental Aneurysms. Arterioscler Thromb Vasc Biol. 2002;22:2017–2022. doi: 10.1161/01.atv.0000042082.38014.ea. [DOI] [PubMed] [Google Scholar]
- 35.Olufsen MS, Peskin CS, Kim WY, Pedersen EM, Nadim A, Larsen J. Numerical simulation and experimental validation of blood flow in arteries with structured-tree outflow conditions. Ann Biomed Eng. 2000;28:1281–1299. doi: 10.1114/1.1326031. [DOI] [PubMed] [Google Scholar]
- 36.Raghavan ML, Kratzberg J, Castro de Tolosa EM, Hanaoka MM, Walker P, da Silva ES. Regional distribution of wall thickness and failure properties of human abdominal aortic aneurysm. J Biomech. 2006;39:3010–3016. doi: 10.1016/j.jbiomech.2005.10.021. [DOI] [PubMed] [Google Scholar]
- 37.Raghavan ML, Vorp DA, Federle MP, Makaroun MS, Webster MW. Wall stress distribution on three-dimensionally reconstructed models of human abdominal aortic aneurysm. J Vasc Surg. 2000;31:760–769. doi: 10.1067/mva.2000.103971. [DOI] [PubMed] [Google Scholar]
- 38.Salsac AV, Sparks SR, Chomaz JM, Lasheras JC. Evolution of the wall shear stresses during the progressive enlargement of symmetric abdominal aortic aneurysms. J Fluid Mech. 2006;560:19–51. [Google Scholar]
- 39.Schurink GW, van Baalen JM, Visser MJ, van Bockel JH. Thrombus within an aortic aneurysm does not reduce pressure on the aneurysmal wall. J Vasc Surg. 2000;31:501–506. [PubMed] [Google Scholar]
- 40.Sheidaei A, Hunley SC, Zeinali-Davarani S, Raguin LG, Baek S. Simulation of abdominal aortic aneurysm growth with updating hemodynamic loads using a realistic geometry. Med Eng Phys. 2011;33:80–88. doi: 10.1016/j.medengphy.2010.09.012. [DOI] [PubMed] [Google Scholar]
- 41.Shindo S, Matsumoto H, Kubota K, Kojima A, Matsumoto M, Satoh K, Ozaki Y. Is the Size of an Abdominal Aortic Aneurysm Associated with Coagulopathy? World J Surg. 2005;29:925–929. doi: 10.1007/s00268-005-7718-z. [DOI] [PubMed] [Google Scholar]
- 42.Shum J, DiMartino ES, Goldhamme A, Goldman DH, Acker LC, Patel G, Ng JH, Martufi G, Finol EA. Semiautomatic vessel wall detection and quantification of wall thickness in computed tomography images of human abdominal aortic aneurysms. Med Phys. 2010;37:638–648. doi: 10.1118/1.3284976. [DOI] [PubMed] [Google Scholar]
- 43.Silver AE, Vita JA. Shear Stress–Mediated Arterial Remodeling in Atherosclerosis Too Much of a Good Thing? Circulation. 2006;113:2787–2789. doi: 10.1161/CIRCULATIONAHA.106.634378. [DOI] [PMC free article] [PubMed] [Google Scholar]
- 44.Swedenborg J, Eriksson P. The intraluminal thrombus as a source of proteolytic activity. Ann N Y Acad Sci. 2006;1085:133–138. doi: 10.1196/annals.1383.044. [DOI] [PubMed] [Google Scholar]
- 45.Taylor CA, Hughes TJR, Zarins CK. Effect of exercise on hemodynamic conditions in the abdominal aorta. J Vasc Surg. 1999;29:1077–1089. doi: 10.1016/s0741-5214(99)70249-1. [DOI] [PubMed] [Google Scholar]
- 46.Thubrikar MJ, Labrosse M, Robicsek F, Al-Soudi J, Fowler B. Mechanical properties of abdominal aortic aneurysm wall. J Med Eng Technol. 2001;25:133–142. doi: 10.1080/03091900110057806. [DOI] [PubMed] [Google Scholar]
- 47.Thubrikar MJ, Robicsek F, Labrosse M, Chervenkoff V, Fowler BL. Effect of thrombus on abdominal aortic aneurysm wall dilation and stress. J Cardiovasc Surg (Torino) 2003;44:67–77. [PubMed] [Google Scholar]
- 48.Vardulaki KA, Prevost TC, Walker NM, Day NE, Wilmink AB, Quick CR, Ashton HA, Scott RA. Growth rates and risk of rupture of abdominal aortic aneurysms. Br J Surg. 1998;85:1674–1680. doi: 10.1046/j.1365-2168.1998.00946.x. [DOI] [PubMed] [Google Scholar]
- 49.Vorp DA, Federspiel WJ, Webster MW. Does laminated intraluminal thrombus within abdominal aortic aneurysm cause anoxia of the aortic wall? J Vasc Surg Off Publ Soc Vasc Surg Int Soc Cardiovasc Surg North Am Chapter. 1996;23:540–541. doi: 10.1016/s0741-5214(96)80027-9. [DOI] [PubMed] [Google Scholar]
- 50.Vorp DA, Lee PC, Wang DH, Makaroun MS, Nemoto EM, Ogawa S, Webster MW. Association of intraluminal thrombus in abdominal aortic aneurysm with local hypoxia and wall weakening. J Vasc Surg. 2001;34:291–299. doi: 10.1067/mva.2001.114813. [DOI] [PubMed] [Google Scholar]
- 51.Wang DH, Makaroun MS, Webster MW, Vorp DA. Effect of intraluminal thrombus on wall stress in patient-specific models of abdominal aortic aneurysm. J Vasc Surg. 2002;36:598–604. doi: 10.1067/mva.2002.126087. [DOI] [PubMed] [Google Scholar]
- 52.Wilson JS, Virag L, Di Achille P, Karsaj I, Humphrey JD. Biochemomechanics of intraluminal thrombus in abdominal aortic aneurysms. J Biomech Eng. 2013;135:021011. doi: 10.1115/1.4023437. [DOI] [PMC free article] [PubMed] [Google Scholar]
- 53.Wood NB. Aspects of fluid dynamics applied to the larger arteries. J Theor Biol. 1999;199:137–161. doi: 10.1006/jtbi.1999.0953. [DOI] [PubMed] [Google Scholar]
- 54.Yu SCM. Steady and pulsatile flow studies in Abdominal Aortic Aneurysm models using Particle Image Velocimetry. Int J Heat Fluid Flow. 2000;21:74–83. [Google Scholar]