

Abstract
Background
Observational studies of influenza vaccine effectiveness (VE) are increasingly using the test-negative design. Studies are typically based in outpatient or inpatient settings, but these two approaches are rarely compared directly. The aim of our study was to assess whether influenza VE estimates differ between inpatient and outpatient settings.
Methods
We searched the literature from Medline, PubMed and Web of Science using a combination of keywords to identify published studies of influenza VE using the test-negative design. Studies assessing any type of influenza vaccine among any population in any setting were considered, while interim studies or re-analyses were excluded. Retrieved articles were reviewed, screened and categorized based on study setting, location and influenza season. We searched for parallel studies in inpatient and outpatient settings that were done in the same influenza season, in the same location, and in the same or similar age groups. For each of the pairs identified, we estimated the difference in VE estimates between settings, and we tested whether the average difference was significant using a paired t-test.
Results
In total 25 pairs of estimates were identified that permitted comparisons between VE estimates in inpatient and outpatient study settings. Within pairs, the prevalence of influenza was generally higher among patients enrolled in the outpatient studies, while influenza vaccination coverage among the test-negative control groups was generally higher in the inpatient studies. There was no heterogeneity in the paired differences in VE, and the pooled difference in VE between inpatient and outpatient studies was −2% (95% confidence interval: −12%, 10%).
Conclusions
We found no differences in VE estimates between inpatient and outpatient settings by studies using the test-negative design. Further research involving direct comparisons of VE estimates from the two settings in the same populations and years would be valuable.
Keywords: Influenza, Vaccination, Vaccine effectiveness, Public health, Case control study
1. Introduction
Influenza viruses are associated with a substantial disease burden of both medically attended ambulatory care and hospitalizations [1,2]. Vaccination is the best means of preventing influenza virus infections, but influenza vaccine effectiveness (VE) may differ from year to year and among different populations. Recently, there have been increasing numbers of studies estimating influenza VE using the test-negative design [3]. In this study design, patients are enrolled in outpatient clinics and/or hospitals based on a clinical case definition such as acute respiratory illness (ARI) or other syndromes consistent with influenza virus infections. Patients are then tested for influenza virus, and VE is estimated from the odds ratio comparing the odds of vaccination among patients testing positive for influenza versus those testing negative, adjusting for potential confounding factors. This study design is believed to be valid under a range of scenarios [4,5]. Importantly, this design is easy to implement in both inpatient and outpatient settings.
Estimates obtained from inpatient and outpatient settings in the same population may be expected to differ for several reasons. First, patients presenting to hospitals may present later in infection, may be older and may be more likely to be co-infected with another respiratory virus. There may therefore be a greater number of false negatives due to reduced viral shedding with time and age [6]. Such reduced sensitivity in case ascertainment can result in attenuation of the odds ratio [3]. In addition, patients at the highest risk of hospitalization, if infected, may be less protected by the vaccine because of poorer VE in people of older age [7] or immunosuppression as a result of chronic underlying conditions [8]. Furthermore, VE estimates between settings may also differ according to vaccine type or brand used. However, few previous studies have directly compared estimates in hospital-based studies with those from outpatient-based studies [9,10].
The aim of this study was to compare directly the VE estimates obtained from studies based in hospitalized patients with studies that recruited patients in an outpatient setting, using the test-negative design. Because VE can vary from location to location and from year to year, and by age, we intended to focus on comparisons of VE estimates from the same location and influenza season and in the same or similar age groups.
2. Methods
2.1. Study search and selection
We previously conducted a review of test-negative studies of influenza VE [3]. All papers identified as meeting the search criteria in that study were also included in the present analysis. The first online searches were updated on 22 July 2015. A second search was done on 28 December 2015. Papers were searched on Medline, PubMed and Web of Science for the following key words:
“Influenza” OR “flu”.
“Vaccine effectiveness” OR “VE”.
“Test-negative” OR “test negative” OR “case-control” OR “case control”.
1, 2 and 3.
Consistent with our previous study, only studies using the test-negative design on any type of influenza vaccination were considered. Articles that did not use a test-negative design, were a reanalysis of previously published data, or reported only interim estimates were excluded. Articles were restricted to English. Two reviewers (SF and SGS) independently retrieved and identified articles fitting the inclusion criteria. All studies meeting the inclusion criteria were reviewed for study setting (inpatient, outpatient or both), influenza season, and geographic location. Studies which pooled results for inpatients and outpatients and did not provide any breakdown were not considered further. The remaining articles were then grouped according to the season and location. Within these groups, studies were further scrutinized to identify pairs or triplets of papers from the same location and influenza season that reported VE estimates for the same influenza type/subtype and the same or similar age groups.
Study design features were abstracted using a standardized form. We extracted information on study location, setting, season, surveillance system, circulating influenza type/subtype, type of influenza vaccine, population age or age group, interval since onset to presentation, definitions of comorbidities, number of influenza positive and negative included in primary analysis, number of vaccinated among each group, and the statistical model used. Adjusted VE estimates were abstracted for influenza overall or the type/subtype common to both studies in each pair and, where possible, for specific age groups. To minimize discrepancies associated with different cut-points for age groupings in study pairs, we contacted authors and requested re-estimation of VE for consistent age groups within each pair.
2.2. Study comparison
To examine whether there were any significant differences in VE point estimates against influenza overall or by type/subtype within study pairs, we used a paired student t-test comparing the differences between the VE estimates of inpatient settings with those of outpatient settings for all pairs. For each study pair, the difference in VE estimates (ΔVE) was calculated as
where VEip was the VE estimated in the inpatient study and VEop was the VE estimated in the outpatient study. 95% confidence intervals for ΔVE were calculated by bootstrapping, using 1000 resamples [11]. Pooled ΔVE estimates against influenza A or B were calculated after removing estimates on duplicated age groups, assuming a fixed effects model, and heterogeneity was examined by I2 and Cochran's Q test. Considering heterogeneity on severity and VE may differ between influenza type/subtype, pooled ΔVE estimates against influenza by type/subtype were also calculated. To examine if variation exists between countries, we estimated country-stratified pooled ΔVE if more than one pair was available. Differences in study design features were compared by whether the ΔVE was positive or negative. All analyses were conducted using R version 3.1.1 (R Foundation for Statistical Computing, Vienna, Austria).
3. Results
A total of 85 full-text articles were retrieved from the previous systematic review [3], to which a further 35 articles were added from the updated search to give a total of 120 published test-negative studies. Grouping studies by location, season, age group and VE estimates by type/subtype, we identified 8 study pairs/triplet from a total of 14 publications [9,10,12–23] (Table 1, Fig. 1). These 8 pairs/triplet included VE estimates from five countries: Australia (n = 2), Canada (n = 1), USA (n = 1), Spain (n = 2), and New Zealand (n = 2) (Fig. 1). Of the Australian triplet, one inpatient study was paired with two different outpatient studies, and VE estimates against all influenza and H1N1 virus were compared, respectively (Table 1) [12,13,20]. One study in Spain and two studies in New Zealand reported estimates from both inpatient and outpatient settings and were thus self-paired (Table 1) [9,10,23]. In summary 14 studies were included which contributed 7 pairs and 1 triplet, providing 25 pairs of VE estimates available for further analysis (Fig. 1, Table 2).
Table 1.
Comparison of study design between inpatient and outpatient settings from 14 publications.
| Study | Country | Season | Setting | Case definition | Interval since onset | Dominant type/subtypeb | Vaccine matchc | Time in model | Comorbid in model | % with high-risk condition |
|---|---|---|---|---|---|---|---|---|---|---|
| Cheng et al. [12] | Australia | 2010 | Inpatient | Admission | Unrestricted | H1pdm | Yes | Fortnight | Yes | 79% |
| Levy et al. [13] | Western Australia | Outpatient | ILI | ≤4d | Week | No | NA | |||
| Fielding et al. [20] | Victoria, Australia | Outpatient | ILI | ≤4d | Month | No | ||||
| Kwong et al. [14] | Ontario, Canada | 2010–2011 | Inpatient | Admission | Unrestricted | H3 | Yes | Month | Yes | ≥72.8%d |
| Skowronski et al. [15] | Canada | Outpatient | ILI | ≤7d | Week | Yes | 34.9% | |||
| Puig-Barberàet al.a [16] | Valencia, Spain | 2011–2012 | Inpatient | ILI | Not specified | H3 | No | Week | No | 88% |
| Jimenez-Jorge et al.a [17] | Spain | Outpatient | ILI | ≤7d | Week (cat) | No | 62.9% | |||
| Talbot et al. [18] | Tennessee, USA | 2011–2012 | Inpatient | ARI | ≤10d | H3 | No | Onset to admission | Yes | 86% |
| Ohmit et al. [19] | USA | Outpatient | ARI | ≤7d | Fortnight | Yes | 25.4% | |||
| Cheng et al. [21] | Australia | 2012 | Inpatient | Admission | Not specified | H3 | No | Not specified | Yes | 83.2% |
| Sullivan et al. [22] | Australia | Outpatient | ILI | Not specified | Month | No | NA | |||
| Martinez-Baz et al. [10] | Narrava, Spain | 2012–2013 | Inpatient | ILI | ≤7d | B | Yes | Month | Yes | NA |
| Martinez-Baz et al. [10] | Narrava, Spain | Outpatient | ILI | ≤7d | Month | Yes | NA | |||
| Turner et al. [9] | Auckland, New Zealand | 2013 | Inpatient | SARI | ≤7d | H3 | Yes | Week | Yes | 64.5% |
| Turner et al. [9] | Auckland, New Zealand | Outpatient | ILI | ≤7d | Week | Yes | NA | |||
| Pierse et al. [23] | Auckland, New Zealand | 2014 | Inpatient | SARI | ≤7d | H1pdm | Yes | Timing of the intervention to peak of season | Yes | 51% |
| Pierse et al. [23] | Auckland, New Zealand | Outpatient | ILI | ≤7d | Timing of the intervention to peak of season | Yes | 26% |
Enrolled patients targeted for influenza vaccination. Cases were positive for influenza A(H3N2) virus.
Information retrieved either from studies or the WHO website.
Information retrieved either from studies or the WHO website.
72.8% was the percentage of subjects with chronic cardiovascular disease.
Fig. 1.

Flow chart of identification of eligible studies for comparing VE estimates between inpatient and outpatient settings using the test-negative design.
Table 2.
Comparison of study laboratory results, vaccination coverage and vaccine effectiveness between inpatient and outpatient settings from 25 pairs of estimates.a
| Study | Age group | Influenza type/subtype | No. of positive/negative | Difference of test-positive proportion (95% CI) | No. of vac/pos | Vaccine coverage (among test-positive) | No. of vac/neg | Vaccine coverage (among test-negative) | Difference of vaccination coverage (95% CI)b | Adjusted VE (95% CI) | ΔVE (95% CI) |
|---|---|---|---|---|---|---|---|---|---|---|---|
| Cheng et al. [12] | ≥18y | A or B | 199/398 | 10% (4%, 16%) | 57/199 | 29% | 213/398 | 54% | 30% (23%, 37%) | 32%(−9%, 57%) | −31% (−76%, 24%) |
| Levy et al.a [13] | 88/296 | 7/88 | 8% | 70/296 | 24% | 21% (13%, 29%) | 63% (12%, 84%) | ||||
| Kwonget al. [14] | 65+y | A or B | 569/1661 | −9%(−14%, −4%) | 238/569 | 42% | 934/1661 | 56% | 21% (14%, 28%) | 42% (29%, 53%) | 16% (−18%, 70%) |
| Skowronski et al. [15] | 50+y | 116/222 | 37/116 | 32% | 78/222 | 35% | 10% (1%, 19%) | 26% (−28%, 57%) | |||
| Talbot et al. [18] | ≥18y | A or B | 17/152 | −4% (−14%, 4%) | 6/17 | 35% | 97/152 | 64% | 17% (9%, 25%) | 71%(17%, 95%) | 24% (−64%, 52%) |
| Ohmit et al. [19] | 380/2235 | 122/380 | 32% | 1055/2235 | 47% | 3% (−20%, 26%) | 47% (31%, 59%) | ||||
| Talbot et al. [18] | ≥50y | A or B | 13/124 | −5%(−1%, 0%) | 5/13 | 39% | 89/124 | 72% | 10%(1%, 19%) | 77% (24%, 98%) | 28% (−87%, 61%) |
| Ohmit et al. [19] | 149/917 | 64/149 | 43% | 563/917 | 61% | −4% (−32%, 24%) | 49% (24%, 66%) | ||||
| Martinez-Baz et al. [10] | All ages | A or B | 53/133 | −32%(−40%, −24%) | 11/53 | 21% | 55/133 | 41% | 3% (−8%, 14%) | 74% (33%, 90%) | 19% (−28%, 75%) |
| Martinez-Baz et al. [10] | 317/205 | 14/317 | 4% | 78/205 | 38% | 16% (5%, 27%) | 55% (1%, 80%) | ||||
| Turner et al. [9] | All ages | A or B | 224/818 | −11%(−14%, −8%) | 82/224 | 37% | 372/818 | 46% | 28% (24%, 32%) | 52% (32%, 66%) | −4% (−28%, 21%) |
| Turner et al. [9] | 482/1013 | 44/482 | 9% | 177/1013 | 18% | 28% (21%, 35%) | 56% (34%, 70%) | ||||
| Turner et al. [9] | 6m-17y | A or B | 51/306 | −17%(−22%, −12%) | 2/51 | 4% | 40/306 | 13% | 5% (1%, 9%) | 78% (2%, 95%) | 22% (−55%, 73%) |
| Turner et al. [9] | 215/476 | 10/215 | 5% | 37/215 | 8% | −1%(−7%, 5%) | 56% (6%, 79%) | ||||
| Turner et al. [9] | 18-64y | A or B | 102/285 | −7%(−13%, −1%) | 26/102 | 26% | 145/285 | 51% | 30% (23%, 37%) | 61% (34%, 77%) | 6% (−26%, 40%) |
| Turner et al. [9] | 248/489 | 24/248 | 10% | 101/489 | 21% | 16% (7%, 25%) | 55% (24%, 73%) | ||||
| Turner et al. [9] | ≥65y | A or B | 71/227 | −5%(−17%, 7%) | 54/71 | 76% | 187/227 | 82% | 1% (−11%, 13%) | 34% (−25%, 66%) | −42% (−104%, 24%) |
| Turner et al. [9] | 19/48 | 10/19 | 53% | 39/48 | 81% | 24% (−1%, 49%) | 76% (15% 93%) | ||||
| Pierse et al. [23] | All ages | A or B | 304/735 | −12%(−16%, −8%) | 90/304 | 30% | 267/735 | 36% | 15% (10%, 20%) | 42% (16%, 60%) | −14% (−43%, 13%) |
| Pierse et al. [23] | 477/677 | 55/477 | 12% | 144/677 | 21% | 18% (12%, 24%) | 56% (35%, 70%) | ||||
| Pierse et al. [23] | 6m-17y | A or B | 84/347 | −18%(−24%, −12%) | 9/84 | 11% | 31/347 | 9% | −3% (−8%, 2%) | −30%(−212%, 46%) | −110% (−290%, −27%) |
| Pierse et al. [23] | 174/284 | 5/174 | 3% | 35/284 | 12% | 8%(1%, 15%) | 80% (48%, 93%) | ||||
| Pierse et al. [23] | 18-64y | A or B | 169/214 | −1%(−7%, 5%) | 41/169 | 24% | 95/214 | 44% | 23%(15%, 31%) | 55% (27%, 73%) | 8% (−27%, 43%) |
| Pierse et al. [23] | 285/349 | 35/285 | 12% | 74/349 | 21% | 12% (4%, 20%) | 47% (16%, 66%) | ||||
| Pierse et al. [23] | ≥65y | A or B | 51/174 | −6%(−19%, 7%) | 40/51 | 78% | 141/174 | 81% | 2% (−11%, 15%) | 21% (−82%, 66%) | 119%(−76%, 977%) |
| Pierse et al. [23] | 18/44 | 15/18 | 83% | 35/44 | 80% | −5% (−26%, 16%) | −98% (−977%, 63%) | ||||
| Cheng et al. [21] | All ages | A or B | 963/1216 | 2%(−1%, 5%) | 437/963 | 45% | 689/1216 | 57% | 30% (26%, 34%) | 41%(28%, 51%) | 18% (−6%, 47%) |
| Sullivan et al. [22] | 593/821 | 116/593 | 20% | 218/821 | 27% | 26% (22%, 30%) | 23% (−4%, 43%) | ||||
| Cheng et al. [24] | ≥18y | H1N1 | 163/398 | −2% (−9%, 5%) | 40/163 | 25% | 213/398 | 54% | 39%(31%, 47%) | 49% (13%, 70%) | −29% (−67%, 22%) |
| Fielding et al. [20] | 91/123 | 4/91 | 5% | 21/123 | 13% | 20% (12%, 28%) | 78% (29%, 93%) | ||||
| Turner et al. [9] | All ages | H1N1 | 13/818 | −1%(−2%, 0%) | 5/13 | 39% | 372/818 | 46% | 28% (24%, 32%) | 48% (−74%, 85%) | − 1% (−128%, 136%) |
| Turner et al. [9] | 30/1013 | 3/30 | 10% | 177/1013 | 18% | 29% (0%, 58%) | 49% (−90%, 86%) | ||||
| Pierse et al. [23] | All ages | H1N1 | 170/735 | −14%(−18%, −1%) | 33/170 | 19% | 267/735 | 36% | 15% (10%, 20%) | 62% (38%, 77%) | 3% (−25%, 30%) |
| Pierse et al. [23] | 324/677 | 32/324 | 10% | 144/677 | 21% | 10% (3%, 17%) | 59% (36%, 74%) | ||||
| Puig-Barberà et al. [16] | ≥18y | H3N2 | 544/1370 | −38%(−44%, −32%) | 314/544 | 58% | 855/1370 | 62% | 20% (10%, 30%) | 31% (11%, 47%) | −23% (−53%, 19%) |
| Jimenez-Jorge et al. [17] | 204/103 | 84/204 | 41% | 44/103 | 43% | 16% (8%, 24%) | 54% (13%, 75%) | ||||
| Turner et al. [9] | All ages | H3N2 | 119/818 | 2%(−1%, 5%) | 51/119 | 43% | 372/818 | 46% | 28% (24%, 32%) | 34%(−2%, 57%) | −27% (−66%, 9%) |
| Turner et al. [9] | 116/1013 | 20/116 | 17% | 177/1013 | 18% | 26%(15%, 37%) | 61% (32%, 77%) | ||||
| Pierse et al. [23] | All ages | H3N2 | 53/735 | −1%(−4%, 2%) | 27/53 | 51% | 267/735 | 36% | 15% (10%, 20%) | −34%(−174%, 35%) | −24% (−176%, 131%) |
| Pierse et al. [23] | 53/677 | 12/53 | 23% | 144/677 | 21% | 28% (10%, 46%) | − 10%(−152%, 52%) | ||||
| Turner et al. [9] | All ages | A | 163/818 | −6% (−9%, −3%) | 68/163 | 42% | 372/818 | 46% | 28% (24%, 32%) | 39% (10%, 58%) | −19% (−51%, 13%) |
| Turner et al. [9] | 290/1013 | 28/290 | 10% | 177/1013 | 18% | 32% (24%, 40%) | 58% (32%, 74%) | ||||
| Pierse et al. [23] | All ages | A | 275/735 | − 10% (−14%, −6%) | 78/275 | 28% | 267/735 | 36% | 15% (10%, 20%) | 42%(15%, 61%) | −11% (−43%, 19%) |
| Pierse et al. [23] | 396/677 | 47/396 | 12% | 144/677 | 21% | 16% (10%, 22%) | 53% (30%, 69%) | ||||
| Turner et al. [9] | All ages | B | 62/818 | −9%(−12%, −6%) | 14/62 | 23% | 372/818 | 46% | 28% (24%, 32%) | 76% (54%, 87%) | 22% (−7%, 60%) |
| Turner et al. [9] | 196/1013 | 18/196 | 8% | 177/1013 | 18% | 14% (3%, 25%) | 54% (19%, 75%) | ||||
| Martinez-Baz et al. [10] | All ages | B | 32/114 | −33%(−41%, −25%) | 5/32 | 16% | 48/114 | 42% | 32%(22%, 42%) | 87% (52%, 96%) | 31% (−9%, 90%) |
| Martinez-Baz et al. [10] | 231/194 | 11/231 | 5% | 20/194 | 10% | 11% (−2%, 24%) | 56%(−5%, 81%) | ||||
| Pierse et al. [23] | All ages | B | 29/735 | −7%(−10, −4%) | 12/29 | 41% | 267/735 | 36% | 15% (10%, 20%) | 44% (−44%, 78%) | −21%(−109%, 36%) |
| Perse et al. [23] | 81/677 | 8/81 | 10% | 144/677 | 21% | 31% (12%, 50%) | 65%(19%, 85%) |
Inpatient results were listed first in each pair.
Difference of vaccination coverage among test-negative were listed first, and among test-positive were listed second in each pair.
The 14 studies reported VE estimates in five influenza seasons from 2010 to 2014 (Table 1). In some cases, the geographic locations from which patients were recruited were not exactly the same. For example, of the study triplet from Australia, inpatient estimates at a national level were compared with outpatient estimates at a regional level [12,13,20]. The periods during which patients were recruited were closely aligned. With the exception of the three self-paired studies, all study pairs used a different clinical case definition, included different variables in their statistical model, and specified their variables differently (Table 1) [9,10,23]. Intervals from illness onset to presentation varied between settings, with most outpatient studies restricted to 7 days since onset, while four among eight inpatient studies did not have a restriction [14,16,21,24].
Among 25 pairs of VE estimates, 14 estimates were against all influenza while the other 11 were for particular influenza types/subtypes (Figs. 1 and 2). All pairs were matched based on having the same age range of patients except for one pair in Canada (Table 2) [14,15]. Fourteen pairs provided VE estimates for patients of all ages [9,10,21–23], two pairs on children eligible for influenza vaccine [9,23], six pairs focused on adults [9,12,13,16–20,23], and four pairs were restricted to elderly adults aged ≥50 or ≥65 years old (Fig. 1, Table 2) [9,14,15,18,19,23]. Although most (n = 24) age ranges were the same, the mean/median age included in each study was rarely reported, so we could not ascertain whether there was a substantial difference in the age distributions. The proportions of patients with high risk conditions were always higher among inpatient settings when comparisons were possible. In one case, in the pair of studies conducted in Spain in the 2011–2012 season, only patients in a target group for vaccination were recruited for the outpatient study [14,15]. Among 14 pairs comparing influenza overall, the proportion of patients testing positive for any influenza virus ranged from 9.5% to 33.3% in inpatient settings, and from 14.0% to 60.7% in outpatient settings. The proportion of any influenza positive cases was higher in outpatient settings in most pairs (n = 12; Table 2), while one pair from Australia reported significantly lower influenza positivity among outpatients [12,13]. In contrast, vaccination coverage obtained from either influenza-positive cases or influenza-negative controls was generally higher among inpatients. Among influenza-negative controls (n = 14), vaccination coverage in the inpatient control group was more than 20 percentage points higher in 6 pairs than among the corresponding outpatient control group [9,12–17,21–23].
Fig. 2.
Comparison of VE estimates against influenza overall or by type/subtype between 25 matched pairs.
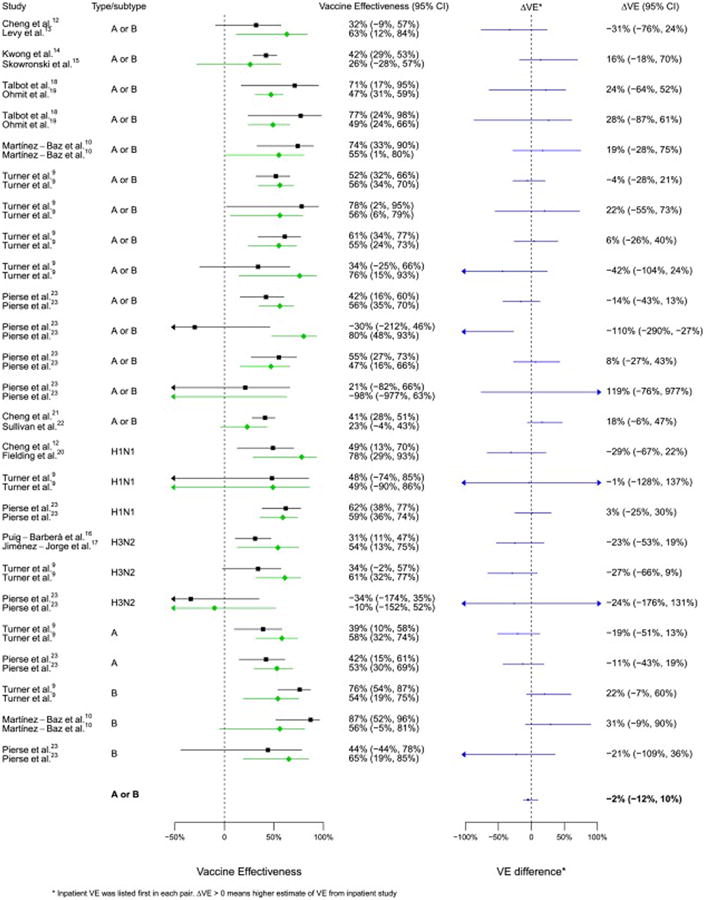
VE estimates in both settings demonstrated a modest to high effectiveness of influenza vaccine (Table 2, Fig. 2). Using a paired student t-test to compare 25 pairs of VE estimates, we found that there was no significant difference in VE estimates between inpatient and outpatient setting (p = 0.840) and no significant difference in VE against influenza A or B (p = 0.755). Within each pair, confidence intervals overlapped with ΔVE across zero except one pair from New Zealand estimating VE for children aged 6 months to 17 years (Fig. 2). Point estimates of ΔVE against any influenza virus ranged from −110% to 119%, and ranged from −29% to 31% against influenza by type/subtype. In meta-regression, we removed estimates by age group when overall estimates available, restricted to VE estimates against any influenza virus, and I2 and Cochran's Q test implied no heterogeneity. Pooled ΔVE from seven pairs was −2% (−12%, 10%), consistent with no substantial differences between VE estimates in hospital-based studies or outpatient studies (Fig. 2). The number of pairs was not enough to conduct a meta-regression to identify whether certain study design features were associated with positive or negative ΔVE. However, univariate analyses suggested there were no clear patterns. For example, studies which used differing age ranges, different statistical models, different variable specification, different restriction criteria or a different study period were balanced by ΔVE (Table 2). Pooled ΔVE was −5% (95% CI: −28%, 18%) against H1N1, −21% (95% CI: −45%, 4%) against H3N2, and 16% (95% CI: −7%, 39%) against influenza B, with three pairs pooled from each type/subtype. When stratified by country, we were able to estimate pooled ΔVE from Australia, Spain and New Zealand. For each country, the confidence interval of the pooled ΔVE crossed zero (Australia: 7% (95% CI: −12%, 30%); Spain: −18% (95% CI: −44%, 13%); New Zealand: −8% (95% CI: −27%, 10%)). No country-specific patterns were observed, but the number of pairs was small.
4. Discussion
From 120 articles assessing influenza VE using the test-negative design, we identified 14 publications with suitable information for paired comparison of VE estimates between inpatient and outpatient settings. Based on 25 pairs of VE estimates for 5 countries from 2010 to 2013, despite some absolute differences within many pairs, we found no evidence of substantial statistical difference in the VE estimates in the inpatient study and the outpatient study, with pooled ΔVE = −2% (95%CI: −12%, 10%).
Studies included varied in clinical case definitions, statistical models, variable specification and exclusion criteria. Nevertheless, the tendency for ΔVE to be positive or negative was not clearly associated with any differences in design features among studies. In outpatient settings, patients with medically attended influenzalike illness (ILI) or ARI were recruited, while in inpatient settings, patients could be hospitalized with severe acute respiratory illness (SARI) or any condition potentially related to influenza, with or without ARI/ILI and with varying time frames since symptoms onset. These variations in clinical case definition in inpatient populations may mean that among the hospitalization studies included, the patient populations were quite different and may have different distributions of confounding factors between test-positive and test-negative patients. It would be interesting to continue this comparison within strata using standardized clinical case definitions for inpatients. Such studies should also account for relevant confounding factors, which were not always done in the studies included here.
We found that influenza positivity was generally lower among hospitalized patients. One potential reason is that inpatient studies may include proportionately more false test-negatives due to longer delays between illness onset and admission. As reported by a meta-analysis, the average duration of viral shedding was about 5 days since illness onset [6], while only three of eight inpatient studies restricted interval since symptoms onset to 7 days. This also may be partly affected by the age mix of patients within each matched pair. Although estimates were matched based on the same or a similar age group, the age distribution within each study was unclear. Thus, there may have been heterogeneity in viral load and shedding, and proportion influenza-positive [6,25].
In contrast, vaccination coverage among influenza-positive cases and influenza-negative controls was generally higher among inpatients. This is likely indicative of high risk status because hospitalized patients have severe disease and may therefore be more likely to be in a group indicated for vaccination. In the countries from which the included studies were derived, vaccination was provided free-of-charge to the elderly, and in most of these countries was also provided to people with high-risk conditions.
Except for one pair of VE estimates for children from New Zealand, we did not find any evidence of heterogeneity between VE estimates for all types/subtypes or in analyses stratified by type/subtype against hospitalization or outpatient consultations among each of the pairs. In the New Zealand study, the difference might be associated with residual confounding, and the authors of that article could not explain the observation [23]. Our findings are consistent with previous studies examining a broad range of assumptions of test-negative studies by modeling methods [5], and indicate that the test-negative design provides similar estimates of influenza VE in inpatient settings compared to the estimates that can be obtained from test-negative studies in outpatient settings (Fig. 2). Nevertheless, the tests used to detect heterogeneity may not have had high sensitivity with so few studies [26].
Inactivated influenza vaccines were the most frequently used types of vaccine in the studies reported here. Our findings are consistent with the view that inactivated influenza vaccines provide moderate protection against infection but do not provide any additional protection against severe disease requiring hospitalization if breakthrough infection (vaccine failure) occurs [27,28].
This study was limited by the few studies available that could be paired. While test-negative studies have been done in many other locations in outpatient setting, few studies have been reported in inpatient settings. A further barrier to effective matching was the use of slightly different age ranges for estimates. Where possible inpatient and outpatient VE estimates should be reported using comparable age groups. A further limitation arose from the use of inexact matching on geographical areas. In small countries, strain circulation may not differ very much among regions. However, for large countries like Australia and Canada, the influenza seasons may differ somewhat across the country. Thus, matching a state or province estimate with a country-wide estimate may not be appropriate.
In conclusion, we did not observe substantial statistical heterogeneity between VE estimates in inpatient settings and outpatient settings based on 25 pairs of VE estimates against all influenza or by type/subtype from 14 published test-negative studies. After matching by season, geographic region and age group, VE estimates obtained from inpatient settings were not consistently higher than those from outpatient settings. Our study indicates that the application of the test-negative design in hospital settings tends to give similar estimates of VE compared to test-negative studies in outpatient settings (to within 10 percentage points). Further research involving direct comparisons of VE estimates from the two designs in the same populations and years would be valuable.
Acknowledgments
We would like to thank the authors of some of the original articles included in our review who agreed to provide additional information. We also thank Eric Lau and Nan Xia for technical support.
BJC has received research funding from MedImmune Inc. and Sanofi Pasteur, and consults for Crucell NV.
Funding: This project was supported by a commissioned grant from the Health and Medical Research Fund, Food and Health Bureau, Government of the Hong Kong Special Administrative Region (grant no. HK-13-04-04), the Harvard Center for Communicable Disease Dynamics from the National Institute of General Medical Sciences (grant no. U54 GM088558), and a grant from the Research Grants Council of the Hong Kong Special Administrative Region, China (Project No. T11-705/14N), The WHO Collaborating Centre for Reference and Research on Influenza is funded by the Australian Government Department of Health.
Footnotes
Conflicts of interest: The authors report no other potential conflicts of interest.
References
- 1.Neuzil KM, Mellen BG, Wright PF, Mitchel EF, Jr, Griffin MR. The effect of influenza on hospitalizations, outpatient visits, and courses of antibiotics in children. N Engl J Med. 2000;342:225–31. doi: 10.1056/NEJM200001273420401. [DOI] [PubMed] [Google Scholar]
- 2.Emukule GO, Khagayi S, McMorrow ML, Ochola R, Otieno N, Widdowson MA, et al. The burden of influenza and RSV among inpatients and outpatients in rural western Kenya, 2009–2012. PLOS ONE. 2014;9:e105543. doi: 10.1371/journal.pone.0105543. [DOI] [PMC free article] [PubMed] [Google Scholar]
- 3.Sullivan SG, Feng S, Cowling BJ. Potential of the test-negative design for measuring influenza vaccine effectiveness: a systematic review. Expert Rev Vaccines. 2014;13:1571–91. doi: 10.1586/14760584.2014.966695. [DOI] [PMC free article] [PubMed] [Google Scholar]
- 4.Jackson ML, Nelson JC. The test-negative design for estimating influenza vaccine effectiveness. Vaccine. 2013;31:2165–8. doi: 10.1016/j.vaccine.2013.02.053. [DOI] [PubMed] [Google Scholar]
- 5.Foppa IM, Haber M, Ferdinands JM, Shay DK. The case test-negative design for studies of the effectiveness of influenza vaccine. Vaccine. 2013;31:3104–9. doi: 10.1016/j.vaccine.2013.04.026. [DOI] [PubMed] [Google Scholar]
- 6.Carrat F, Vergu E, Ferguson NM, Lemaitre M, Cauchemez S, Leach S, et al. Time lines of infection and disease in human influenza: a review of volunteer challenge studies. Am J Epidemiol. 2008;167:775–85. doi: 10.1093/aje/kwm375. [DOI] [PubMed] [Google Scholar]
- 7.Gruver A, Hudson L, Sempowski G. Immunosenescence of ageing. J Pathol. 2007;211:144–56. doi: 10.1002/path.2104. [DOI] [PMC free article] [PubMed] [Google Scholar]
- 8.Guide CI Ottawa Centers for Disease Control and Prevention. Recommendations of the Advisory Committee on Immunization Practices (ACIP): use of vaccines and immune globulins in persons with altered immunocompetence. MMWR. (6th) 1993;42:1–18. [PubMed] [Google Scholar]
- 9.Turner N, Pierse N, Bissielo A, Huang Q, Radke S, Baker M, et al. Effectiveness of seasonal trivalent inactivated influenza vaccine in preventing influenza hospitalisations and primary care visits in Auckland, New Zealand, in 2013. Euro Surveill. 2014;19:20884. [PMC free article] [PubMed] [Google Scholar]
- 10.Martínez-Baz I, Navascués A, Pozo F, Chamorro J, Albeniz E, Casado I, et al. Influenza vaccine effectiveness in preventing inpatient and outpatient cases in a season dominated by vaccine-matched influenza B virus. Hum Vaccines Immunother. 2015;11:1626–33. doi: 10.1080/21645515.2015.1038002. [DOI] [PMC free article] [PubMed] [Google Scholar]
- 11.Carpenter J, Bithell J. Bootstrap confidence intervals: when, which, what? A practical guide for medical statisticians. Stat Med. 2000;19:1141–64. doi: 10.1002/(sici)1097-0258(20000515)19:9<1141::aid-sim479>3.0.co;2-f. [DOI] [PubMed] [Google Scholar]
- 12.Cheng AC, Kotsimbos T, Kelly HA, Irving LB, Bowler SD, Brown SG, et al. Effectiveness of H1N1/09 monovalent and trivalent influenza vaccines against hospitalization with laboratory-confirmed H1N1/09 influenza in Australia: a test-negative case control study. Vaccine. 2011;29:7320–5. doi: 10.1016/j.vaccine.2011.07.087. [DOI] [PubMed] [Google Scholar]
- 13.Levy A, Sullivan SG, Tempone SS, Wong KL, Regan AK, Dowse GK, et al. Influenza vaccine effectiveness estimates for Western Australia during a period of vaccine and virus strain stability, 2010 to 2012. Vaccine. 2014;32:6312–8. doi: 10.1016/j.vaccine.2014.08.066. [DOI] [PubMed] [Google Scholar]
- 14.Kwong JC, Campitelli MA, Gubbay JB, Peci A, Winter AL, Olsha R, et al. Vaccine effectiveness against laboratory-confirmed influenza hospitalizations among elderly adults during the 2010–2011 season. Clin Infect Dis. 2013 doi: 10.1093/cid/cit404. http://dx.doi.org/10.1093/cid/cit404. [DOI] [PMC free article] [PubMed]
- 15.Skowronski DM, Janjua NZ, De Serres G, Winter AL, Dickinson JA, Gardy JL, et al. A sentinel platform to evaluate influenza vaccine effectiveness and new variant circulation. Canada 2010–2011 season. Clin Infect Dis. 2012 doi: 10.1093/cid/cis431. http://dx.doi.org/10.1093/cid/cis431. [DOI] [PubMed]
- 16.Puig-Barberà J, García-de-Lomas J, Díez-Domingo J, Arnedo-Pena A, Ruiz-García M, Limón-Ramírez R, et al. Influenza vaccine effectiveness in preventing influenza A (H3N2)-related hospitalizations in adults targeted for vaccination by type of vaccine: a hospital-based test-negative study, 2011–2012 A (H3N2) predominant influenza season, Valencia, Spain. PLOS ONE. 2014;9:e112294. doi: 10.1371/journal.pone.0112294. [DOI] [PMC free article] [PubMed] [Google Scholar]
- 17.Jiménez-Jorge S, de Mateo S, Delgado-Sanz C, Pozo F, Casas I, Garcia-Cenoz M, et al. Effectiveness of influenza vaccine against laboratory-confirmed influenza, in the late 2011–2012 season in Spain, among population targeted for vaccination. BMC Infect Dis. 2013;13:441. doi: 10.1186/1471-2334-13-441. [DOI] [PMC free article] [PubMed] [Google Scholar]
- 18.Talbot HK, Zhu Y, Chen Q, Williams JV, Thompson MG, Griffin MR. Effectiveness of influenza vaccine for preventing laboratory-confirmed influenza hospitalizations in adults, 2011–2012 influenza season. Clin Infect Dis. 2013 doi: 10.1093/cid/cit124. http://dx.doi.org/10.1093/cid/cit124. [DOI] [PMC free article] [PubMed]
- 19.Ohmit SE, Thompson MG, Petrie JG, Thaker SN, Jackson ML, Belongia EA, et al. Influenza vaccine effectiveness in the 2011–2012 season: protection against each circulating virus and the effect of prior vaccination on estimates. Clin Infect Dis. 2014;58:319–27. doi: 10.1093/cid/cit736. [DOI] [PMC free article] [PubMed] [Google Scholar]
- 20.Fielding JE, Grant KA, Garcia K, Kelly HA. Effectiveness of seasonal influenza vaccine against pandemic (H1N1) 2009 virus, Australia, 2010. Emerg Infect Dis. 2011;17:1181. doi: 10.3201/eid1707.101959. [DOI] [PMC free article] [PubMed] [Google Scholar]
- 21.Cheng AC, Brown SG, Waterer GW, Holmes M, Senenayake S, Friedman ND, et al. Influenza epidemiology, vaccine coverage and vaccine effectiveness in sentinel Australian hospitals in 2012: the Influenza Complications Alert Network (FluCAN) Commun Dis Intell. 2013;213:17.3. [PubMed] [Google Scholar]
- 22.Sullivan SG, Chilver M, Higgins G, Cheng AC, Stocks NP. Influenza vaccine effectiveness in Australia: results from the Australian Sentinel Practices Research Network. Med J Aust. 2014;201:109–11. doi: 10.5694/mja14.00106. [DOI] [PubMed] [Google Scholar]
- 23.Pierse N, Kelly H, Thompson MG, Bissielo A, Radke S, Huang QS, et al. Influenza vaccine effectiveness for hospital and community patients using control groups with and without non-influenza respiratory viruses detected, Auckland, New Zealand 2014. Vaccine. 2015;34:503–9. doi: 10.1016/j.vaccine.2015.11.073. [DOI] [PubMed] [Google Scholar]
- 24.Cheng AC, Holmes M, Irving LB, Brown S, Waterer GW, Korman TM, et al. Influenza vaccine effectiveness against hospitalisation with confirmed influenza in the 2010–2011 seasons: a test-negative observational study. PLOS ONE. 2013;8:e68760. doi: 10.1371/journal.pone.0068760. [DOI] [PMC free article] [PubMed] [Google Scholar]
- 25.Lau LL, Ip DK, Nishiura H, Fang VJ, Chan KH, Peiris JM, et al. Heterogeneity in viral shedding among individuals with medically attended influenza A virus infection. J Infect Dis. 2013;207:1281–5. doi: 10.1093/infdis/jit034. [DOI] [PMC free article] [PubMed] [Google Scholar]
- 26.Greenland S. Quantitative methods in the review of epidemiologic literature. Epidemiol Rev. 1987;9:1–30. doi: 10.1093/oxfordjournals.epirev.a036298. [DOI] [PubMed] [Google Scholar]
- 27.Ng S, Ni MY, Fang VJ, Ip D, Chan KH, Leung GM, et al. Characteristics of vaccine failures in a randomized placebo-controlled trial of inactivated influenza vaccine in children. Pediatr Infect Dis J. 2014;33:e63–6. doi: 10.1097/INF.0000000000000064. [DOI] [PMC free article] [PubMed] [Google Scholar]
- 28.Arriola CS, Anderson EJ, Baumbach J, Bennett N, Bohm S, Hill M, et al. Does influenza vaccination modify influenza severity? Data on older adults hospitalized with influenza during the 2012–2013 season in the United States. J Infect Dis. 2015 doi: 10.1093/infdis/jiv200. http://dx.doi.org/10.1093/infdis/jiv200. [DOI] [PMC free article] [PubMed]