Abstract
Aims/hypothesis
Type 1 diabetes is caused by the immunological destruction of pancreatic beta cells. Preclinical and clinical data indicate that there are changes in beta cell function at different stages of the disease, but the fate of beta cells has not been closely studied. We studied how immune factors affect the function and epigenetics of beta cells during disease progression and identified possible triggers of these changes.
Methods
We studied FACS sorted beta cells and infiltrating lymphocytes from NOD mouse and human islets. Gene expression was measured by qRT-PCR and methylation of the insulin genes was investigated by high-throughput and Sanger sequencing. To understand the role of DNA methyltransferases, Dnmt3a was knocked down with siRNA. The effects of cytokines on methylation and expression of the insulin gene were studied in humans and mice.
Results
During disease progression in NOD mice, there was an inverse relationship between the proportion of infiltrating lymphocytes and the beta cell mass. In beta cells, methylation marks in the Ins1 and Ins2 genes changed over time. Insulin gene expression appears to be most closely regulated by the methylation of Ins1 exon 2 and Ins2 exon 1. Cytokine transcription increased with age in NOD mice, and these cytokines could induce methylation marks in the insulin DNA by inducing methyltransferases. Similar changes were induced by cytokines in human beta cells in vitro.
Conclusions/interpretation
Epigenetic modification of DNA by methylation in response to immunological stressors may be a mechanism that affects insulin gene expression during the progression of type 1 diabetes.
Keywords: Beta cell, Cytokines, DNA methylation, DNA methyltransferases, Dnmt3a, Infiltrating lymphocytes, Ins1, Ins2, Type 1 diabetes
Introduction
Clinical experience and preclinical studies indicate that immune cell regulation of beta cells is important for the progression of type 1 diabetes. After the clinical presentation of hyperglycaemia, there is some recovery of beta cell function, indicating that a functional component may impair insulin secretion at disease onset (in addition to loss of total beta cell mass as a consequence of autoimmune destruction) [1–3]. At the time of presentation with hyperglycaemia, degranulated beta cells may be found in the islets of NOD mice, although insulin granules can be recovered after anti-CD3 monoclonal antibody (mAb) immune therapy [4]. Crosstalk between immune and beta cells may also control disease progression. Despite the fact that autoantigens are present for several years after the initial sensitisation of beta cells, the disease progresses over a short period of time, suggesting that changes in beta cell function may be involved.
DNA methylation is an important regulatory mechanism in pancreatic organogenesis and for maintaining beta cell differentiation capacity. For example, the ability of beta cells to express insulin in response to glucose is acquired during postnatal life [5]. DNA methyltransferase 3A (DNMT3A) appears to play a central role in the acquisition of glucose stimulated insulin secretion by beta cells [6]. It is likely that DNA methylation is crucial for both beta cell maturation and function. DNMT3A initiates a metabolic programme that enables the coupling of insulin secretion to glucose levels.
Epigenetic changes may occur in response to environmental stressors. For example, the genes encoding superoxide dismutase and matrix metalloproteinase are epigenetically modified in a diabetic environment, and are thought to be responsible for regulating nuclear transcription factor and vascular endothelial growth factor (VEGF) in diabetic retinopathy [7]. The ‘metabolic memory’ that persists following glucose control of diabetes is also postulated to be due to epigenetic modifications in endothelial cells [8]. Ishikawa et al reported that long-term, high levels of glucose induce DNA methylation in INS-1 cells [9]. Several other studies have also shown epigenetic modifications in diabetes and after glucose treatment [10–13].
We postulated that epigenetic changes might occur in beta cells during the development of autoimmune diabetes, and that these changes might affect the function or other characteristics of beta cells. We focused on DNA methylation, which is a frequently biological method of fine-tuning gene expression [14]. Interestingly, recent studies into the dynamics of DNA methylation have revealed that this is a reversible modification, suggesting that it may contribute to the plasticity of genomic responses to seasonal cues in natural environments [15]. The contribution of epigenetic mechanisms such as DNA methylation to maintaining correct cellular function is highlighted by observations that their deregulation together with genetic alterations lead to the development of various diseases and to the establishment and progression of tumours [16].
We studied the cellular and molecular changes in islets and beta cells during the progression of diabetes in NOD mice. Autoimmunity is initiated in NOD mice between 3–4 weeks of age, followed by adaptive immune responses that are responsible for killing beta cells [17]. In a quantitative analysis in NOD mice, we showed a decline in beta cell numbers with increased infiltration of T cells into the islets of Langerhans with ageing. We found that CpG sites within the Ins1 and Ins2 genes, which appear to be related to insulin gene transcription, undergo methylation in the prediabetic period. We identified the expression of cytokines in the islets of prediabetic NOD mice that are able to induce DNMTs and insulin gene methylation associated with the control of insulin transcription. Thus, epigenetic modifications in response to immunological stressors may represent a mechanism that affects insulin gene expression during progression of autoimmune diabetes.
Methods
Mice
Female NOD, NOD/scid and B6 mice were obtained from the Jackson Laboratory (Bar Harbor, ME, USA) and maintained under pathogen-free conditions. All protocols were approved by the Yale Institutional Animal Care and Use Committee.
Human islets
Human islet samples were obtained from adult, non-diabetic organ donors from the Integrated Islet Distribution Program, as previously described [6].
Mouse islet isolation and beta cell staining and purification
Islets were hand-picked from NOD, NOD/scid and B6 mice of different ages (n=4–6/group), and single cell suspensions were prepared after collagenase digestion. Cells were stained with FluoZin-3 (Invitrogen, Waltham, MA, USA) and tetramethylrhodamine ethyl ester perchlorate (TMRE; Life Technologies, Carlsbad, CA, USA) as previously described [18] for beta cell purification, and with an anti-CD45 mAb (eBioscience, San Diego, CA, USA) for islet-infiltrating lymphocytes identification using a FACSAria II (BD, Franklin Lakes, NJ, USA). In some experiments, single islet cells were also stained with ant-insulin (R&D, Minneapolis, MN, USA) and anti-glucagon (Abcam, Cambridge, UK,) antibodies labelled with FITC.
Bisulphite sequencing
Genomic DNA (≥100 ng) was recovered from sorted beta cells, lymphocytes and serum, spleen, liver, kidney and lung tissues. High-throughput targeted methylation sequencing of Ins1 and Ins2 DNA was performed by Zymo Research (Irvine, CA, USA. www.zymoresearch.com).
Sanger sequencing of a 200 bp region in Ins1 exon 2 was used sequence cell clones. This region includes seven CpG sites and site-specific methylation patterns can be used to discriminate beta and non-beta cells (electronic supplementary material [ESM] Fig. 3). Bisulphite primers (ESM Table 1) and the pGEM-T vector (Promega, Fitchburg, WI, USA) were used for PCR amplification and cloning. Sanger sequencing was used to determine the DNA methylation status of approximately 80 positive clones (Keck Laboratory, Yale School of Medicine, http://medicine.yale.edu/keck).
Islet culture and siRNA transfection
A total of 200 human islets or 150 handpicked islets isolated from 4-week-old NOD mice were cultured with or without cytokine cocktails in DMEM (2.2 g/l glucose) (Gibco; ThermoFisher, Waltham, MA, USA) containing 10% FBS for 48 h. In some experiments, cells were transfected with siRNA targeting Dnmt3a (SMARTpool; Dharmacon, Lafayette, CO, USA) or control siRNA using Lipofectamine 2000 (Invitrogen,) for 24 h prior to cytokine treatment for 48 h [6]. Islets were then digested to obtain single cells and stained for beta cell sorting. DNA and RNA were purified for DNA methylation and gene transcription analysis, respectively.
Probes, primers and quantitative real-time RT-PCR
TaqMan probes for mouse Ins1, Ins2 and Actb were used to perform quantitative real-time RT-PCR (qRT-PCR) using a TaqMan Gene Expression Master Mix (ThermoFisher), and qRT-PCR was performed using a QuantiFast SYBR Green PCR Kit (Qiagen, Hilden, Germany). Primer pairs used in this study are listed in ESM Table 1. The Actb housekeeping gene was used to normalise the input RNA in all qRT-PCR assays. In some cases, insulin gene transcription was presented as ΔCt = Ct Actb − Ct Ins1 or Ins2.
Statistical analysis
Unless otherwise indicated, data are expressed as means ± SEM. The differences between experimental groups and time points were compared using unpaired and paired Student’s t tests (normally distributed data) and Mann–Whitney U tests (non-normally distributed data). Multiple groups were compared using one- or two-way ANOVA with Tukey post hoc analysis using GraphPad Prism 6 (La Jolla, CA, USA). Differences with a p value of <0.05 were considered statistically significant.
Results
Changes in beta cell number and function during diabetes progression in NOD mice
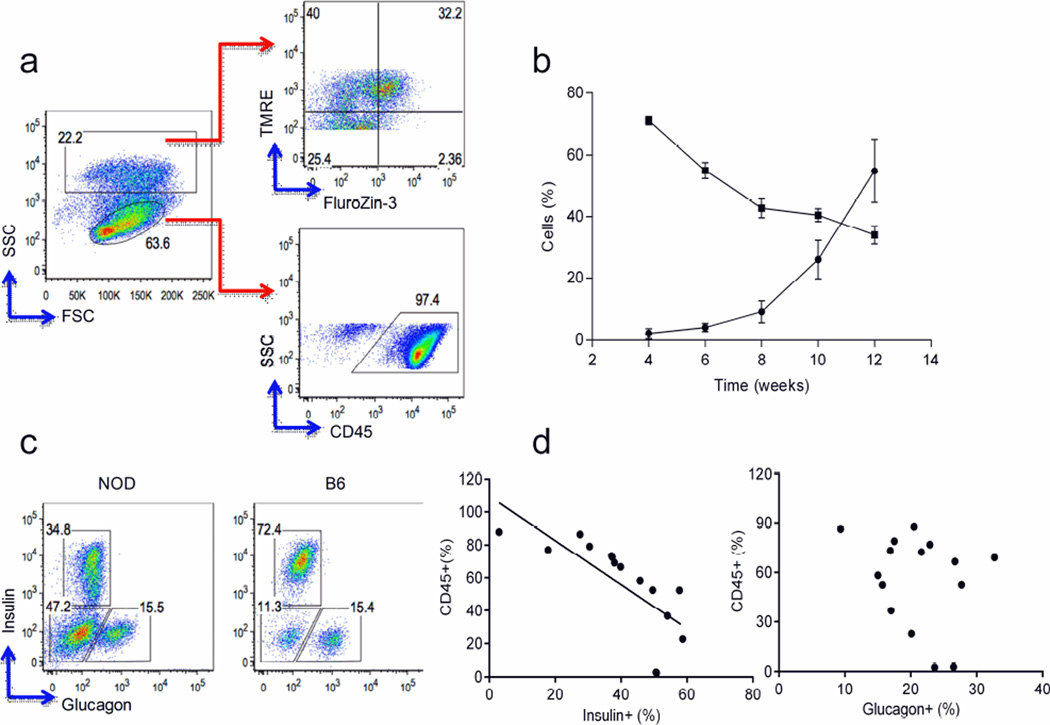
To identify changes in the cellular composition of islets over time, we analysed islets from NOD mice by FACS. We stained islet cells with FluoZin-3 (a zinc-selective, cell-permeable dye) to identify insulin-producing beta cells and with the TMRE mitochondrial membrane potential indicator to distinguish viable beta cells [18]. We also used anti-CD45 mAb staining to identify immune cells infiltrating the islets. Representative data from 12-week-old NOD mice are shown in Fig. 1a. Islet-infiltrating lymphocytes were detectable as early as 4 weeks of age and increased with increasing age. Over same period, the number of beta cells declined. By 12 weeks of age, approximately 60% of the total cells present in the islets were infiltrating lymphocytes and beta cells comprised approximately 30% of islet cells. As the proportion of lymphocytes increased, the proportion of beta cells declined (Fig. 1b). To determine whether there were also changes in alpha cells due to lymphocyte infiltration, we stained islet cells with anti-glucagon and anti-insulin antibodies. Representative FACS profiles from 12-week-old NOD and B6 mice are shown in Fig. 1c. With increasing age, in addition to a decrease in the total fraction of insulin-positive beta cells, we noticed an increase of islet cells that were negative for both insulin and glucagon in NOD mouse islets (Fig. 1c). The presence of CD45+ islet-infiltrating lymphocytes negatively correlated with the percentage of insulin-positive but not with the percentage of glucagon-positive cells (Pearson’s coefficient: insulin r2=0.5480, p=0.0016; glucagon, NS; Fig. 1d).
Fig. 1.
Analysis of beta cells and lymphocytes in islets from NOD mice. (a) Representative gating strategy for islet cells from 12-week-old NOD mice (see Methods). Data represent three experiments (n=9). FSC: forward scatter; SSC: side scatter. (b) The percentage of lymphocytes (circles) and beta cells (squares) at different time points (mean ± SEM, n=4–5 mice each). (c) FACS analysis of insulin and glucagon expression in CD45− cells in islets from 12-week-old NOD and B6 mice. Data represent three experiments (n=9). (d) Correlation between insulin- or glucagon-producing islet cells and CD45+ lymphocytes. Pearson’s r2: insulin, r2=0.5480, p=0.0016; glucagon, NS
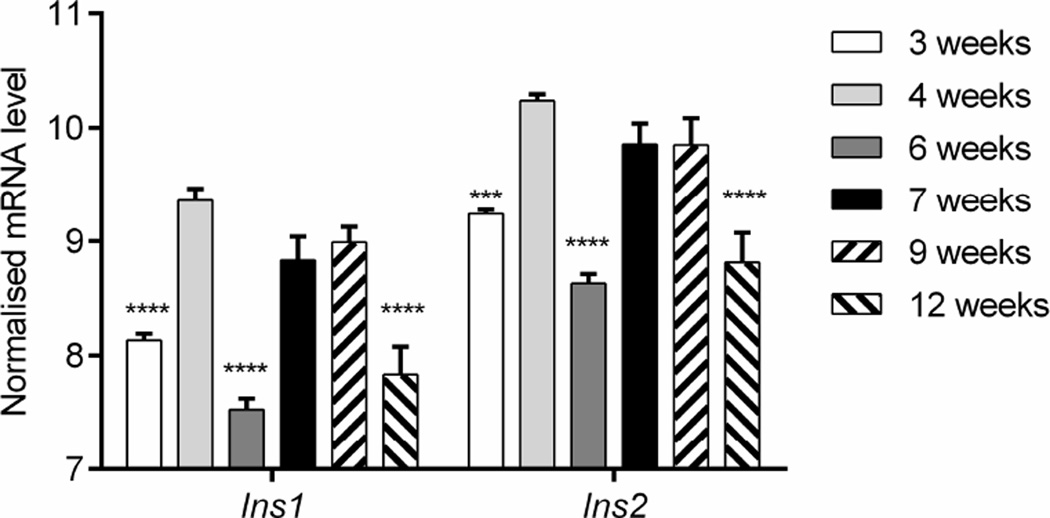
We measured Ins1 and Ins2 gene transcription by qRT-PCR in beta cells sorted from NOD mice at different ages. The Ins1 and Ins2 genes were transcribed at a ratio of approximately 1:2 at all time points measured, but transcription of both genes changed over time (one-way ANOVA: Ins1 p<0.001; Ins2 p<0.01; Fig. 2). Compared with 3 weeks of age, there was an increase in the transcription of both insulin genes in beta cells at 4 weeks of age (p<0.0001), most likely due to the rapid gain in body mass after weaning (Fig. 2). The transcription of both insulin genes fluctuated at between 6 and 7 weeks of age (p<0.0001), but increased to levels comparable to those at 4 week at 9 weeks, and then declined at 12 weeks (p<0.0001; Fig. 2), corresponding to the appearance of glucose intolerance [19]. These data indicate that, in addition to the anatomical loss of beta cells, there is decreased insulin gene transcription in the remaining beta cells.
Fig. 2.
Insulin gene transcription in beta cells from NOD mice over time. Beta cells from NOD mice of different ages were sorted. Ins1 and Ins2 gene transcription was analysed by qRT-PCR and normalised to Actb mRNA levels (ΔCt=Actb−Ins1/2). Data show the mean ± SEM of three experiments, each with 4–5 mice. One-way ANOVA: Ins1 p<0.001, Ins2 p<0.01. Post hoc comparison with 4-week-old mice: ***p<0.001, ****p<0.0001
The dynamics of insulin gene methylation in NOD mouse beta cells during diabetes progression
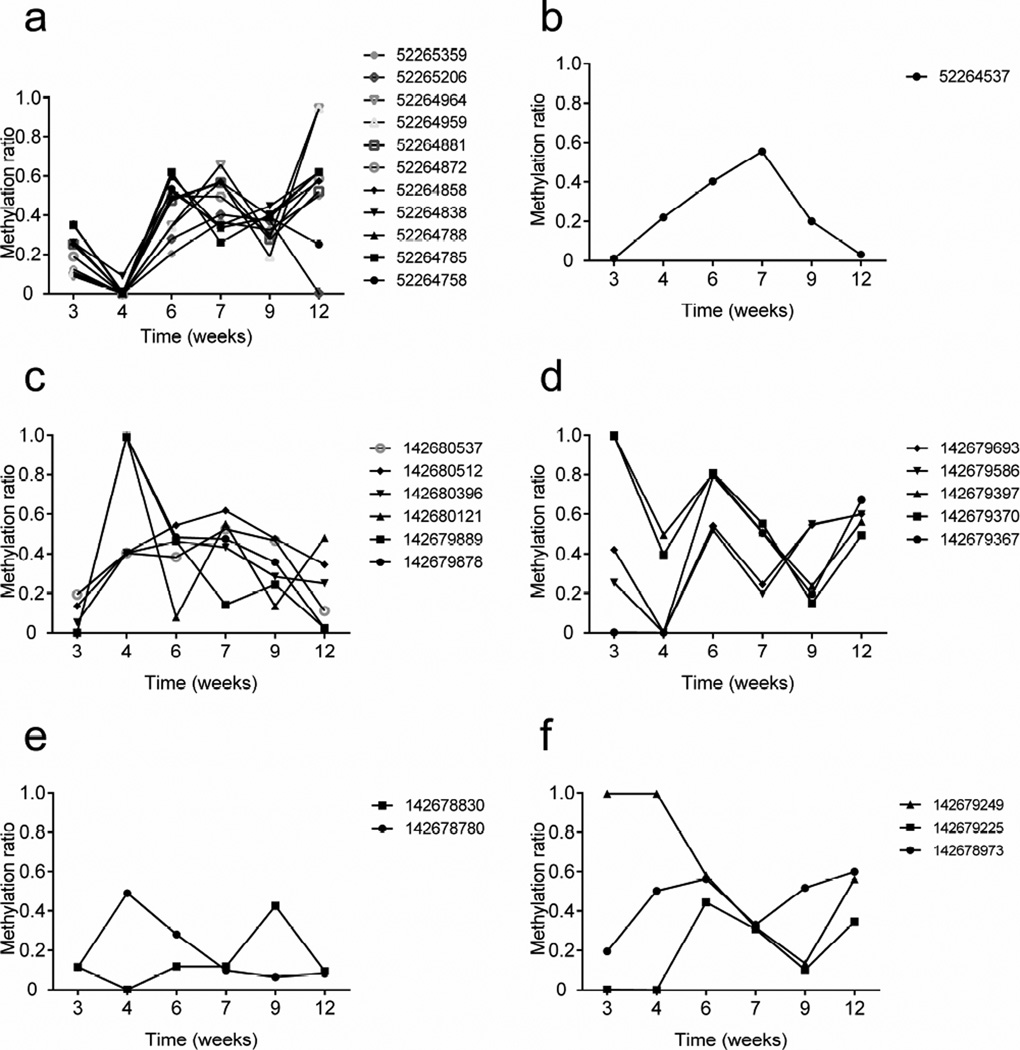
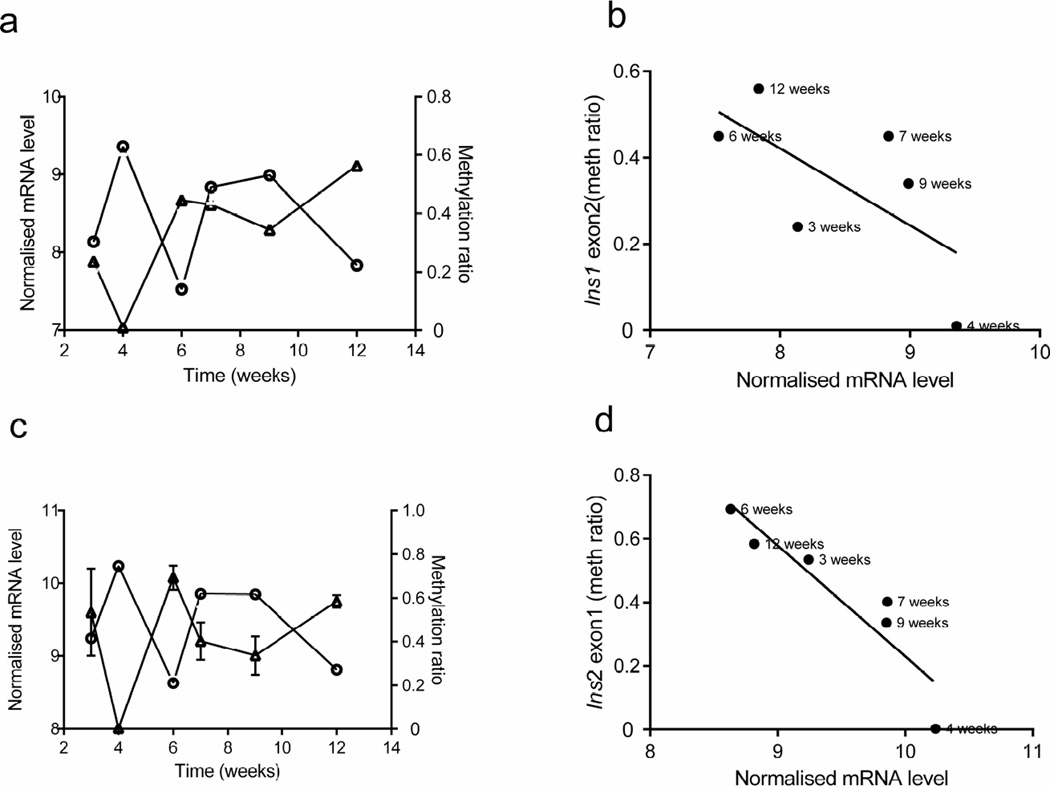
DNA was isolated from sorted beta cells (as shown in Fig. 1) and high-throughput targeted methylation sequencing of Ins1 and Ins2 DNA was performed. We first grouped CpG sites by gene regions in Ins1 and Ins2 (ESM Fig. 1; www.ensembl.org/index.html) and determined the methylation ratio of individual CpG site by age (Fig. 3). (NB There are no CpG sites in the Ins1 promoter and only one CpG site in the Ins1 intron.) There was a large variation in the frequency of methylated sites in both insulin genes over time. Moreover, the methylation status of individual site within the same region appeared to be random, except for sites within Ins1 exon 2 (Fig. 3a) and Ins2 exon 1 (Fig. 3d). Therefore, we focused our studies on these regions. We first determined whether methylation changes at any site or gene region were associated with insulin gene transcription (Fig. 4). Methylation of Ins1 exon 2 showed a modest inverse association with the Ins1 mRNA level (Pearson’s r2=0.43, p=0.1564; Fig. 4a, b). The methylation level of Ins2 exon 1 was significantly inversely related to Ins2 mRNA levels (r2=0.85, p=0.0089; Fig. 4c, d). Interestingly we did not identify a relationship between Ins2 promoter methylation and Ins2 mRNA levels (Fig. 3c and ESM Fig. 2).
Fig. 3.
Methylation of insulin genes in beta cells during diabetes progression in NOD mice. The methylation ratios for Ins1 (a) exon 2 and (b) intron 1–2 and of Ins2 (c) promoter, (d) exon 1, (e) exon 2 and (f) intron 1–2. Data were obtained from targeted high-throughput methylation sequencing of beta cell DNA pooled from 4–6 NOD mice of each age group. The average reads for each CpG site were 30,000–50,000
Fig. 4.
Correlation between insulin gene DNA methylation and transcription in beta cells from NOD mice over time. (a, c) The average methylation status of CpG sites within Ins1 exon 2 (a, triangles) and Ins2 exon 1 (c, triangles) in beta cells (as described in Fig. 3), together with Ins1 (a, circles) and Ins2 (c, circles) mRNA levels in the same cells (as described in Fig.2). (b, d) Correlations between the average methylation (meth) levels of Ins1 exon 2 and Ins2 exon 1 and the respective gene transcription Pearson’s correlation: (b) r2=0.43, p=0.1564; (d) r2=0.85, p=0.0089. Transcription data are the means ± SEM of 3 experiments with at least 4 mice in each age group
We also compared the methylation ratio of CpG sites in Ins1 exon 2 from beta cells with those of other tissues. We found significantly less methylation in beta cells isolated from 3-week-old NOD mice compared with the other tissues (ESM Fig. 3).
Induction of insulin gene methylation by proinflammatory cytokines in vitro
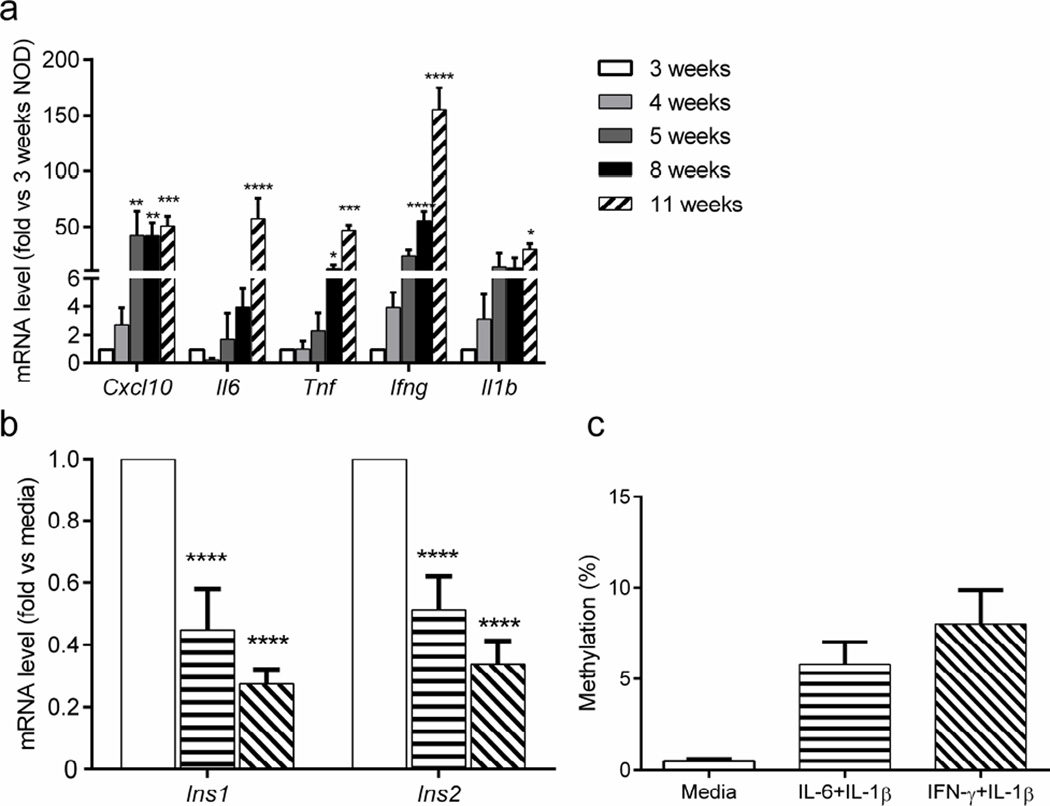
During the progression of type 1 diabetes in NOD mice, proinflammatory cytokines are expressed in the islets by infiltrating immune cells [3, 20, 21]. We hypothesised that soluble inflammatory mediators may contribute to the observed epigenetic changes. We first analysed the expression of proinflammatory cytokines by qRT-PCR in whole islets from NOD mice of various ages. Compared with islets from 3-week-old NOD mice, there were significant increases in Cxc110 mRNA (p<0.01) as early as 5 weeks of age and in Tnf mRNA (p<0.05) and Ifng mRNA (p<0.0001) at 8 weeks. By 11 weeks of age, Tnf mRNA (p<0.001) and I16 (p<0.0001) levels had increased further, and I11b mRNA (p<0.05) also showed a significant increase (Fig. 5a).
Fig. 5.
Cytokine expression in islets and their effects on insulin DNA methylation. (a) Cytokine gene transcription in islets from NOD mice was determined by qRT-PCR and presented as fold changes relative to levels in 3-week-old NOD mice. (b, c) Islets from 4-week-old NOD mice were cultured in medium without (white bars) or with either IL-6 plus IL-1β (horizontal stripes) or IFN-γ plus IL-1β (diagonal stripes) for 48 h. (b) Insulin gene transcription was analysed in sorted beta cells by qRT-PCR and normalised to transcription levels in beta cells from islets cultured in medium alone. (c) Methylation status of Ins1 was determined by cloning and sequencing Ins1 exon 2 (χ2 test, p<0.0001). Data are the means ± SEM of 3–4 experiments, with (a) 3–4 mice per time point or (b, c) 6 mice per group. (a, b) ANOVA: *p<0.01, **p<0.01, ***p<0.001, ****p<0.0001
To determine whether these islet-infiltrating cytokines directly affect insulin gene transcription and DNA methylation, we cultured islets from 4-week-old NOD mice with cytokines, and analysed insulin gene transcription and insulin DNA methylation in sorted beta cells. Previous studies have highlighted the pathological effects of IL-1β, IL-6 and IFN-γ in the destruction of human beta cells [22]. Our results showed reduced expression of Ins1 and Ins2 mRNA in beta cells cultured with IL-6 plus IL-1β or with IFN-γ plus IL-1β (Fig. 5b). Methylation of Ins1 exon 2 was significantly higher in beta cells from islets cultured with these cytokines (χ2 test, p<0.0001; Fig. 5c).
DNA methyltransferases are induced in beta cells during NOD mouse diabetes progression and by expressed cytokines
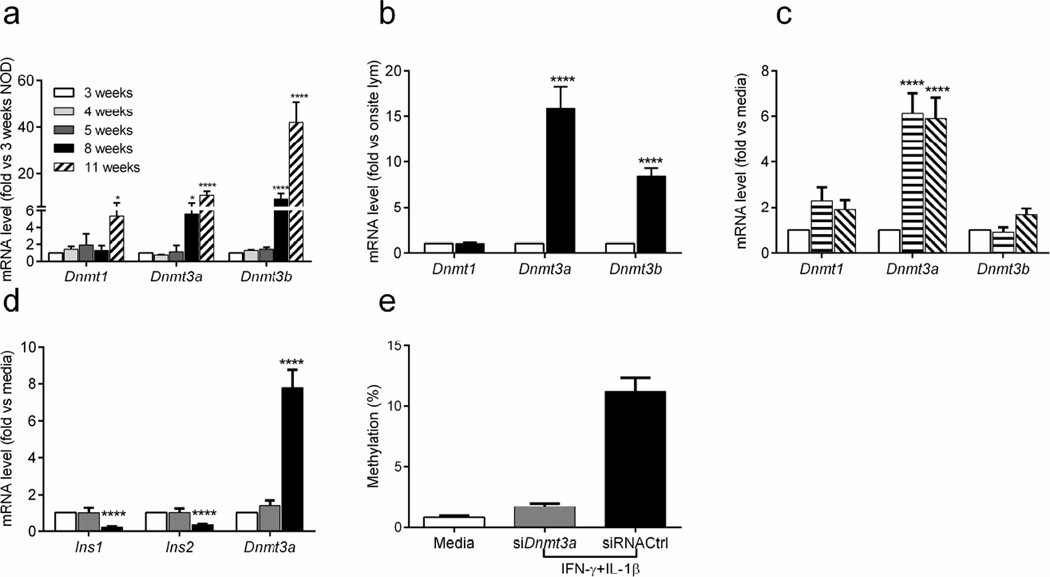
To determine whether cytokines induce methyltransferases that may methylate the insulin genes, we first analysed the transcription levels of Dnmt genes in islets from NOD mice of different ages, in beta cells and in islet infiltrating lymphocytes sorted from 6-week-old NOD mice. The expression of Dnmt1 increased over time in islets from NOD mice aged 3 weeks to 11 weeks (p<0.05). Dnmt3a and Dnmt3b mRNA were significantly increased at 8 weeks of age and increased further at 11 weeks (p<0.0001; Fig. 6a). In contrast, there was no significant increase in the levels of Dnmt3a or Dnmt3b transcripts in NOD/scid mice over time (ESM Fig. 4).
Fig. 6.
Expression of Dnmt genes in islets and beta cells. (a) The transcription of several Dnmt genes was measured in islets from NOD mice at the indicated ages and normalised to levels in islets from 3-week-old mice. (b) Beta cells and islet-infiltrating lymphocytes were sorted from islets of 6-week-old NOD mice. The levels of Dnmt gene transcription in beta cells (black bars) was normalised to levels in islet-infiltrating lymphocytes (white bars). Data are the means ± SEM of 3 experiments, each with 4 mice. (c) The expression of Dnmt genes was determined by qRT-PCR in beta cells from islets cultured in IL-6 plus IL-1β (horizontal stripes) or IFN-γ plus IL-1β (diagonal stripes). (d, e) Islets from 4-week-old NOD mice were transfected with siRNA against Dnmt3a (grey bars) or scrambled control siRNA (siControl; black bars) 24 h prior to cytokine treatment with IFN-γ plus IL-1β for 48 h. Levels of Ins1 and Ins2 expression and Dnmt3a mRNA in beta cells were then analysed by qRT-PCR. (d) Methylation of CpG sites in Ins2 exon 1 was determined by Sanger sequencing. (e) χ2 test, p<0.0001. (a–d) ANOVA with Tukey’s multiple comparison tests: *p<0.05, ****p<0.0001. (c, d) Data were normalised to beta cells from islets cultured in control medium. (d, e) Data are the means ± SEM from three experiments, each with eight mice
Beta cells were responsible for changes in Dnmt3a and Dnmt3b mRNA levels but not for changes in Dnmt1 mRNA levels because, the levels of these methyltransferase transcripts were much higher in sorted beta cells than in infiltrating lymphocytes (p<0.0001; Dnmt1, NS; Dnmt3a, p<0.0001; Dnmt3b, p<0.0001; Fig. 6b).
We also assessed the effects of cytokines on methyltransferase expression in vitro. Whole islets were cultured with cytokines for 48 h and then methyltransferase expression in sorted beta cells was measured by qRT-PCR: Dnmt3a expression was increased (p<0.0001) and there was a 1.58-fold induction of Dnmt3b mRNA when islets were cultured with IFN-γ plus IL-1β, but this difference was not significant (p=0.13; Fig. 6c).
To confirm the effect of cytokines on methyltransferases induction, we silenced Dnmt3a in beta cells with siRNA (Fig. 6d) and compared the effects of cytokines (IFN-γ plus IL-1β) on Ins2 exon 1 methylation and insulin gene expression to those of beta cells transfected with control siRNA. SiRNA targeting Dnmt3a reversed the effects of cytokines (IFN-γ plus IL-1β) on insulin DNA methylation (χ2 test, p<0.0001) and gene expression (p<0.0001; Fig. 6d, e), indicating that islet-infiltrating cytokines could induce DNA methyltransferases and thus insulin DNA methylation, and decrease insulin gene transcription.
Cytokine induction of DNMT mRNA in human beta cell in vitro
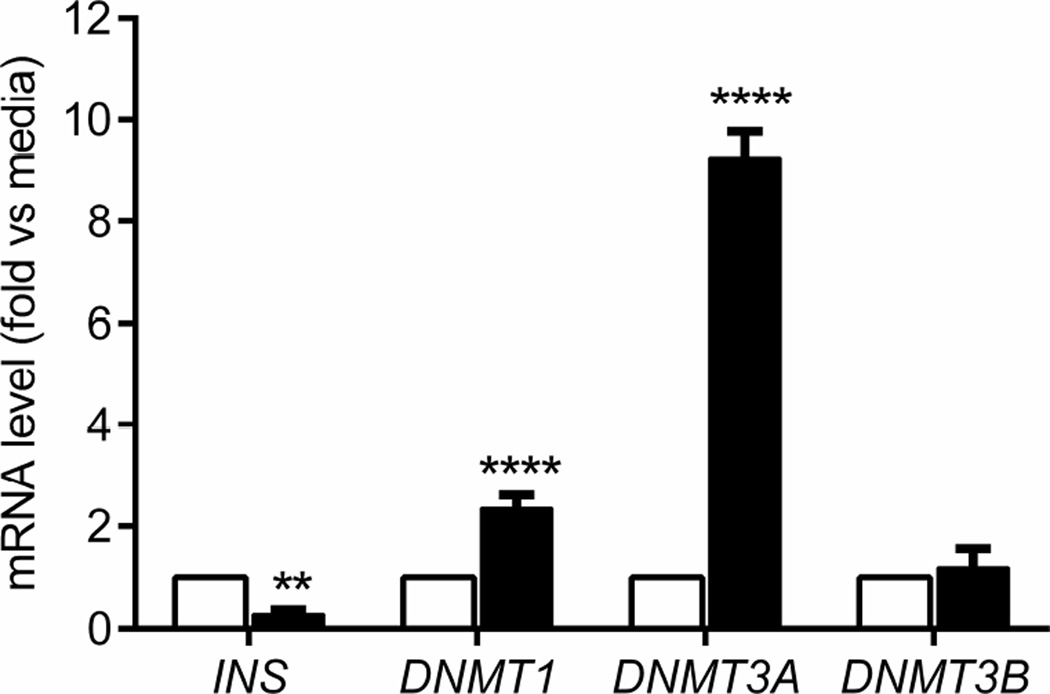
We next performed similar experiments to test the effects of cytokines on the expression of DNMT genes in human islets. We cultured islets from a non-diabetic donor with a cytokine cocktail (TNF-α, IFN-γ plus IL-1β) and measured the expression of DNMT genes by qRT-PCR. Both DNMT1 (p<0.0001) and DNMT3A (p<0.0001) mRNA levels were increased, while INS gene transcription (p<0.01) was decreased with this treatment (Fig. 7).
Fig. 7.
Expression of DNMT and INS genes in human beta cells. Human islets were cultured in medium without (white bars) or with TNF-α plus IFN-γ plus IL-1β (black bars) for 48 h and then gene transcription was analysed, as for mouse islets. Data are the means ± SEM from 4 experiments, each with a single islet donor. ANOVA: **p<0.01, ****p<0.0001
Discussion
We studied epigenetic and functional changes in the insulin genes during progression of diabetes in NOD mice. There is strong clinical evidence that both functional changes and loss of beta cell mass due to killing occur during the development of type 1 diabetes [23, 24]. Our studies showed a quantitative increase in infiltrating lymphocytes during diabetes progression and a corresponding decline in both the number and function of beta cells. Earlier studies from our and other groups in beta cells from BALB/c mice showed that CpG sites within the insulin genes were unmethylated, but these initial studies did not examine how the autoimmune response might change the epigenetic signature of the genes [5, 25]. We analysed the methylation patterns of CpG sites within the Ins1 and Ins2 genes by high-throughput sequencing and found changes in the methylation patterns of Ins1 exon 2 and Ins2 exon 1 that were inversely associated with gene transcription. We then addressed the basis of these changes, focusing initially on the soluble mediators found in islets during disease progression because these factors seemed most likely to account for the epigenetic changes. We found that IL-1β combined with IFN-γ or IL-6 reduced insulin gene transcription and induced methylation of CpG sites within a representative exon. This treatment also increased expression of the DNA methyltransferase genes, Dnmt3a and Dnmt3b. The expression of cytokines may be related to the decrease in insulin gene transcription and increase in insulin DNA methylation that we identified at age 6 weeks. Our studies have therefore identified a novel mechanism that may operate during progression of autoimmune diabetes and account for the functional changes that occur in beta cells.
A number of environmental factors may affect gene methylation, particularly in the promoter region. Studies from other experimental settings have suggested that insulin promoter DNA methylation correlates negatively with insulin gene expression in human pancreatic islets [5, 26]. Interestingly, we did not find a relationship between the methylation of CpG sites within the Ins2 promoter and Ins2 gene transcription in beta cells during diabetes progression in NOD mice. It is important to note that our findings were from primary beta cells from normoglycaemic NOD mice, indicating that changes in the glucose level were not responsible for the methylation changes. Brenet et al reported that methylation of DNA downstream of the transcription start site was more tightly linked to transcriptional silencing compared with methylation in the upstream promoter region [27]. In addition to methylation, other epigenetic mechanisms such as histone modifications may be involved in the control of insulin gene transcription [28].
A significant finding of our studies is that inflammatory cytokines found in the islets during diabetes progression could induce methylation of CpG sites in the insulin genes as result of increased DNMT expression. Obesity-induced, proinflammatory cytokines were reported to promote Dnmt1 expression [29]. IL-6 was reported to induce DNMT1 activity and mediates SOCS3 promoter hypermethylation in ulcerative colitis-related colorectal cancer [30, 31]. Likewise, TGF-β was reported to induce both the expression and activity of DNMT1, DNMT3A and DNMT3B; DNMT3A was shown to be required for acquisition of beta cell function in human and rodent cells [6, 32]. Our ex vivo studies of beta cells from NOD mice showed increased expression of Dnmt3a and Dnmt3b during disease progression, but our in vitro studies showed a significant increase in only Dnmt3a after cytokine addition. Most likely, the difference between these findings is due to the limited number of cytokines added to the cultured cells. There are likely to be many more mediators in the islets during disease progression that may affect the expression of DNA methyltransferases.
The similar changes seen in DNMT genes in human islets exposed to cytokines suggest that epigenetic changes may also occur in beta cells during progression of type 1 diabetes. We do not know whether these changes occur in vivo or whether they account for the transient changes in beta cell function seen in individuals at risk of developing type 1 diabetes. However, our studies have identified a potential limitation of analysing beta cell killing via measuring the levels of unmethylated insulin DNA in the circulation. Assays from our laboratory and those of others have relied on detecting unmethylated CpG sites in insulin DNA released from dying beta cells [5, 25, 33, 34]. However, methylation of CpG sites could alter detection of beta cell derived DNA in the serum.
In summary, we have shown methylation marks in the Ins1 and Ins2 genes that change during diabetes progression in NOD mice, and that these methylation marks appear to be caused by DNMTs that can be induced by cytokines. Our studies suggest that anti-inflammatory cytokine therapies may alter beta cell function even if they cannot curtail the ongoing cytolytic response that leads to the ultimate loss of beta cell mass.
Supplementary Material
Acknowledgments
We thank O. Henegariu, Yale University School of Medicine, for labelling the glucagon mAb with FITC for use in this study.
Funding
This study was supported by grant nos DP3 DK101122, R01 DK057846 and R42 DK095639) from the National Institutes of Health, grant no. 2014–142 from the JDRF and gifts from the Howalt family and Brehm Foundation.
Abbreviations
- DNMT
DNA methyltransferase
- TMRE
Tetramethylrhodamine ethyl ester perchlorate
Footnotes
Duality of interest statement
KCH has a patent application for an assay to detect beta cell killing in vivo. All other authors declare that there is no duality of interest associated with their contribution to this manuscript.
Contribution statement
JL, JR, KCH, PLC, SD and SU conceived and designed the study; JL, JR, PLC and SD acquired the data; JR and KCH analysed the data; JL, JR, KCH, PLC, SD interpreted the data; JR and KCH drafted the manuscript; JL, PLC, SD, and SU reviewed the manuscript; and SU revised it critically for important intellectual content. All authors revised the article and approved the final vision to be published. KCH is the guarantor of this work and, as such, had full access to all the data in the study and takes responsibility for the integrity of the data and the accuracy of the data analysis.
References
- 1.Herold KC, Vignali DA, Cooke A, Bluestone JA. Type 1 diabetes: translating mechanistic observations into effective clinical outcomes. Nature Reviews Immunology. 2013;13:243–256. doi: 10.1038/nri3422. [DOI] [PMC free article] [PubMed] [Google Scholar]
- 2.Atkinson MA, Eisenbarth GS, Michels AW. Type 1 diabetes. Lancet. 2014;383:69–82. doi: 10.1016/S0140-6736(13)60591-7. [DOI] [PMC free article] [PubMed] [Google Scholar]
- 3.Mathis D, Vence L, Benoist C. Beta-cell death during progression to diabetes. Nature. 2001;414:792–798. doi: 10.1038/414792a. [DOI] [PubMed] [Google Scholar]
- 4.Sherry NA, Chen W, Kushner JA, et al. Exendin-4 improves reversal of diabetes in NOD mice treated with anti-CD3 monoclonal antibody by enhancing recovery of beta-cells. Endocrinology. 2007;148:5136–5144. doi: 10.1210/en.2007-0358. [DOI] [PubMed] [Google Scholar]
- 5.Kuroda A, Rauch TA, Todorov I, et al. Insulin gene expression is regulated by DNA methylation. PLoS One. 2009;4:e6953. doi: 10.1371/journal.pone.0006953. [DOI] [PMC free article] [PubMed] [Google Scholar]
- 6.Dhawan S, Tschen SI, Zeng C, et al. DNA methylation directs functional maturation of pancreatic beta cells. The Journal of clinical investigation. 2015;125:2851–2860. doi: 10.1172/JCI79956. [DOI] [PMC free article] [PubMed] [Google Scholar]
- 7.Kowluru RA, Santos JM, Mishra M. Epigenetic modifications and diabetic retinopathy. Biomed Res Int. 2013;2013:635284. doi: 10.1155/2013/635284. [DOI] [PMC free article] [PubMed] [Google Scholar]
- 8.Takizawa F, Mizutani S, Ogawa Y, Sawada N. Glucose-independent persistence of PAI-1 gene expression and H3K4 tri-methylation in type 1 diabetic mouse endothelium: implication in metabolic memory. Biochemical and biophysical research communications. 2013;433:66–72. doi: 10.1016/j.bbrc.2013.02.064. [DOI] [PubMed] [Google Scholar]
- 9.Ishikawa K, Tsunekawa S, Ikeniwa M, et al. Long-term pancreatic beta cell exposure to high levels of glucose but not palmitate induces DNA methylation within the insulin gene promoter and represses transcriptional activity. PloS One. 2015;10:e0115350. doi: 10.1371/journal.pone.0115350. [DOI] [PMC free article] [PubMed] [Google Scholar]
- 10.Alonso LC, Yokoe T, Zhang P, et al. Glucose infusion in mice: a new model to induce beta-cell replication. Diabetes. 2007;56:1792–1801. doi: 10.2337/db06-1513. [DOI] [PMC free article] [PubMed] [Google Scholar]
- 11.El-Osta A, Brasacchio D, Yao D, et al. Transient high glucose causes persistent epigenetic changes and altered gene expression during subsequent normoglycemia. The Journal of experimental medicine. 2008;205:2409–2417. doi: 10.1084/jem.20081188. [DOI] [PMC free article] [PubMed] [Google Scholar]
- 12.Mitic T, Emanueli C. Diabetes-induced epigenetic signature in vascular cells. Endocr Metab Immune Disord Drug Targets. 2012;12:107–117. doi: 10.2174/187153012800493495. [DOI] [PubMed] [Google Scholar]
- 13.Feng B, Ruiz MA, Chakrabarti S. Oxidative-stress-induced epigenetic changes in chronic diabetic complications. Can J Physiol Pharmacol. 2013;91:213–220. doi: 10.1139/cjpp-2012-0251. [DOI] [PubMed] [Google Scholar]
- 14.Jaenisch R, Bird A. Epigenetic regulation of gene expression: how the genome integrates intrinsic and environmental signals. Nature Genetics. 2003;33(Suppl):245–254. doi: 10.1038/ng1089. [DOI] [PubMed] [Google Scholar]
- 15.Alvarado S, Fernald RD, Storey KB, Szyf M. The dynamic nature of DNA methylation: a role in response to social and seasonal variation. Integr Comp Biol. 2014;54:68–76. doi: 10.1093/icb/icu034. [DOI] [PMC free article] [PubMed] [Google Scholar]
- 16.Zardo G, Fazi F, Travaglini L, Nervi C. Dynamic and reversibility of heterochromatic gene silencing in human disease. Cell Res. 2005;15:679–690. doi: 10.1038/sj.cr.7290337. [DOI] [PubMed] [Google Scholar]
- 17.Diana J, Simoni Y, Furio L, et al. Crosstalk between neutrophils, B-1a cells and plasmacytoid dendritic cells initiates autoimmune diabetes. Nature medicine. 2013;19:65–73. doi: 10.1038/nm.3042. [DOI] [PubMed] [Google Scholar]
- 18.Jayaraman S. Assessment of beta cell viability. Current protocols in cytometry. 2011;55.6.27:6.27.1–6.27.16. doi: 10.1002/0471142956.cy0627s55. [DOI] [PubMed] [Google Scholar]
- 19.Sherry NA, Kushner JA, Glandt M, Kitamura T, Brillantes AM, Herold KC. Effects of autoimmunity and immune therapy on beta-cell turnover in type 1 diabetes. Diabetes. 2006;55:3238–3245. doi: 10.2337/db05-1034. [DOI] [PubMed] [Google Scholar]
- 20.Wachlin G, Augstein P, Schroder D, et al. IL-1beta, IFN-gamma and TNF-alpha increase vulnerability of pancreatic beta cells to autoimmune destruction. Journal of autoimmunity. 2003;20:303–312. doi: 10.1016/s0896-8411(03)00039-8. [DOI] [PubMed] [Google Scholar]
- 21.Lehuen A, Diana J, Zaccone P, Cooke A. Immune cell crosstalk in type 1 diabetes. Nature reviews Immunology. 2010;10:501–513. doi: 10.1038/nri2787. [DOI] [PubMed] [Google Scholar]
- 22.Lakey JR, Suarez-Pinzon WL, Strynadka K, et al. Peroxynitrite is a mediator of cytokine-induced destruction of human pancreatic islet beta cells. Lab Invest. 2001;81:1683–1692. doi: 10.1038/labinvest.3780381. [DOI] [PubMed] [Google Scholar]
- 23.Weir GC, Bonner-Weir S. Five stages of evolving beta-cell dysfunction during progression to diabetes. Diabetes. 2004;53(Suppl 3):S16–S21. doi: 10.2337/diabetes.53.suppl_3.s16. [DOI] [PubMed] [Google Scholar]
- 24.Weir GC, Bonner-Weir S. Islet beta cell mass in diabetes and how it relates to function, birth, and death. Annals of the New York Academy of Sciences. 2013;1281:92–105. doi: 10.1111/nyas.12031. [DOI] [PMC free article] [PubMed] [Google Scholar]
- 25.Akirav EM, Lebastchi J, Galvan EM, et al. Detection of beta cell death in diabetes using differentially methylated circulating DNA. Proc Natl Acad Sci U S A. 2011;108:19018–19023. doi: 10.1073/pnas.1111008108. [DOI] [PMC free article] [PubMed] [Google Scholar]
- 26.Yang BT, Dayeh TA, Kirkpatrick CL, et al. Insulin promoter DNA methylation correlates negatively with insulin gene expression and positively with HbA(1c) levels in human pancreatic islets. Diabetologia. 2011;54:360–367. doi: 10.1007/s00125-010-1967-6. [DOI] [PMC free article] [PubMed] [Google Scholar]
- 27.Brenet F, Moh M, Funk P, et al. DNA methylation of the first exon is tightly linked to transcriptional silencing. PloS one. 2011;6:e14524. doi: 10.1371/journal.pone.0014524. [DOI] [PMC free article] [PubMed] [Google Scholar]
- 28.Gilbert ER, Liu D. Epigenetics: the missing link to understanding beta-cell dysfunction in the pathogenesis of type 2 diabetes. Epigenetics. 2012;7:841–852. doi: 10.4161/epi.21238. [DOI] [PMC free article] [PubMed] [Google Scholar]
- 29.Kim AY, Park YJ, Pan X, et al. Obesity-induced DNA hypermethylation of the adiponectin gene mediates insulin resistance. Nature Communications. 2015;6:7585. doi: 10.1038/ncomms8585. [DOI] [PMC free article] [PubMed] [Google Scholar]
- 30.Liu CC, Lin JH, Hsu TW, et al. IL-6 enriched lung cancer stem-like cell population by inhibition of cell cycle regulators via DNMT1 upregulation. International journal of cancer Journal international du cancer. 2015;136:547–559. doi: 10.1002/ijc.29033. [DOI] [PubMed] [Google Scholar]
- 31.Li Y, Deuring J, Peppelenbosch MP, Kuipers EJ, de Haar C, van der Woude CJ. IL-6-induced DNMT1 activity mediates SOCS3 promoter hypermethylation in ulcerative colitis-related colorectal cancer. Carcinogenesis. 2012;33:1889–1896. doi: 10.1093/carcin/bgs214. [DOI] [PubMed] [Google Scholar]
- 32.Cardenas H, Vieth E, Lee J, et al. TGF-beta induces global changes in DNA methylation during the epithelial-to-mesenchymal transition in ovarian cancer cells. Epigenetics : official journal of the DNA Methylation Society. 2014;9:1461–1472. doi: 10.4161/15592294.2014.971608. [DOI] [PMC free article] [PubMed] [Google Scholar]
- 33.Husseiny MI, Kuroda A, Kaye AN, Nair I, Kandeel F, Ferreri K. Development of a quantitative methylation-specific polymerase chain reaction method for monitoring beta cell death in type 1 diabetes. PloS one. 2012;7:e47942. doi: 10.1371/journal.pone.0047942. [DOI] [PMC free article] [PubMed] [Google Scholar]
- 34.Husseiny MI, Kaye A, Zebadua E, Kandeel F, Ferreri K. Tissue-specific methylation of human insulin gene and PCR assay for monitoring beta cell death. PloS one. 2014;9:e94591. doi: 10.1371/journal.pone.0094591. [DOI] [PMC free article] [PubMed] [Google Scholar]
Associated Data
This section collects any data citations, data availability statements, or supplementary materials included in this article.


