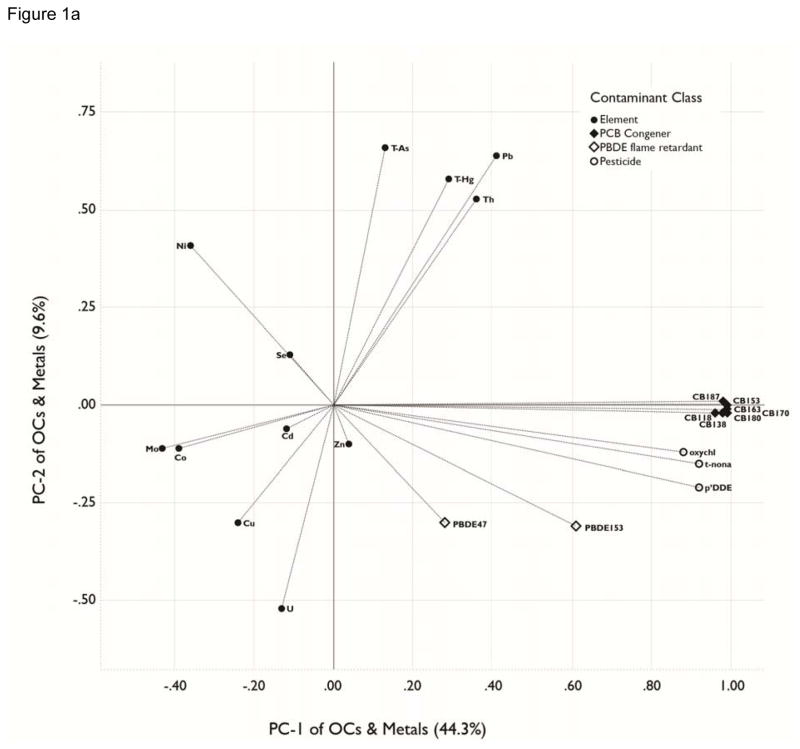
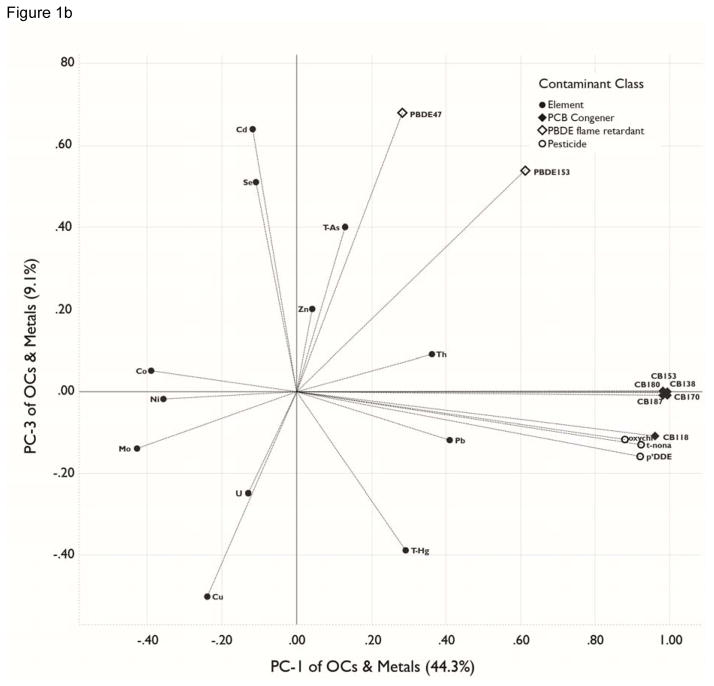
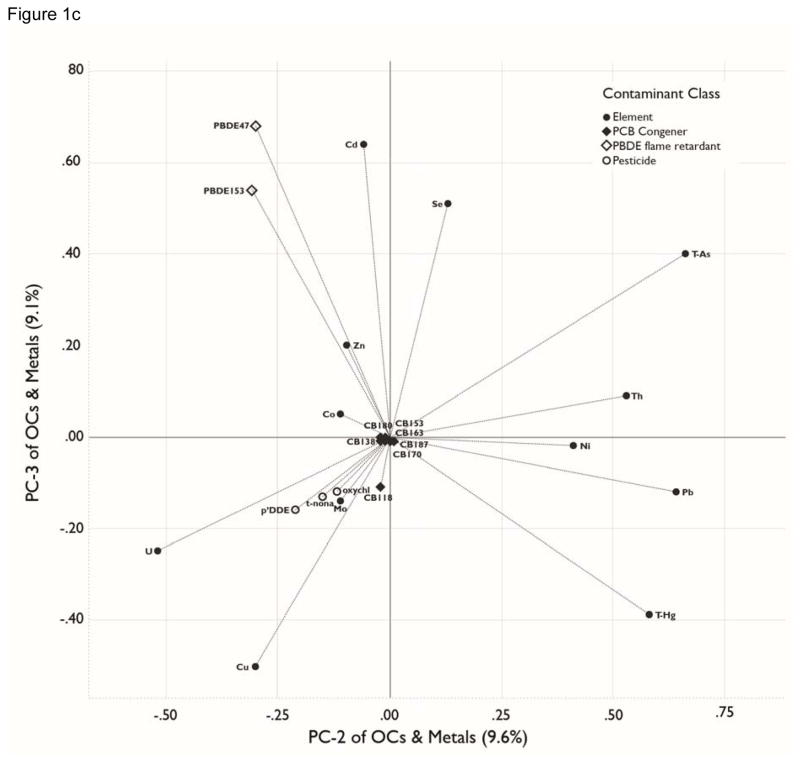
Figure 1.
a, b, c. Principal Components Analyses. Loadings for organohalogens and elements for the three largest principal components (PCs), which collectively account for 63.5% of the variance in the original matrix. The percentage of variation explained by each PC variable is presented in parenthesis in the axis label. Analytes included in the PCA were detectable in ≥70% of blood samples. See Table 4 for contaminant units. . All analytes were transformed by log10(x+1). . Figure 1a plots PC-1 loadings against PC-2 loadings. Figure 1b plots PC-1 against PC-3. Figure 1c plots PC-2 against PC-3.


