

Abstract
The goal of this work was to assess statistical power to detect treatment effects in Alzheimer’s disease (AD) clinical trials using magnetic resonance imaging (MRI)–derived brain biomarkers. We used unbiased tensor-based morphometry (TBM) to analyze n = 5,738 scans, from Alzheimer’s Disease Neuroimaging Initiative 2 participants scanned with both accelerated and nonaccelerated T1-weighted MRI at 3T. The study cohort included 198 healthy controls, 111 participants with significant memory complaint, 182 with early mild cognitive impairment (EMCI) and 177 late mild cognitive impairment (LMCI), and 155 AD patients, scanned at screening and 3, 6, 12, and 24 months. The statistical power to track brain change in TBM-based imaging biomarkers depends on the interscan interval, disease stage, and methods used to extract numerical summaries. To achieve reasonable sample size estimates for potential clinical trials, the minimal scan interval was 6 months for LMCI and AD and 12 months for EMCI. TBM-based imaging biomarkers were not sensitive to MRI scan acceleration, which gave results comparable with nonaccelerated sequences. ApoE status and baseline amyloid-beta positron emission tomography data improved statistical power. Among healthy, EMCI, and LMCI participants, sample size requirements were significantly lower in the amyloid+/ApoE4+ group than for the amyloid−/ApoE4− group. ApoE4 strongly predicted atrophy rates across brain regions most affected by AD, but the remaining 9 of the top 10 AD risk genes offered no added predictive value in this cohort.
Keywords: Alzheimer’s disease, Mild cognitive impairment, Imaging biomarker, Longitudinal, Enrichment, ApoE, Amyloid
1. Introduction
Alzheimer’s disease (AD) now affects an estimated 5.2 million people in the United States alone, and this number may double by 2030 and triple by 2050 (www.alz.org). In the past 3 decades, medical researchers and the pharmaceutical industry have teamed up to identify neuroimaging, clinical, or other measures of disease progression that may be precise and reproducible enough to evaluate treatment response. No currently available treatments are able to slow the progression of AD, although some genetic and lifestyle factors affect vascular disease, which contributes to age-related cognitive decline. There is an urgent need to determine imaging measures of brain degeneration that may be influenced by treatments.
AD drug trials have a high failure rate (Cummings et al., 2014). Imaging biomarkers play an essential role in evaluating potential therapies and aim to identify those at risk before symptoms appear, monitor disease progression, and evaluate treatments (Frisoni et al., 2010; Frisoni and Weiner, 2010; Jack et al., 2003, 2005; Weiner et al., 2010, 2012). A suite of candidate imaging biomarkers are being developed to provide clinically relevant information on the stages of AD pathophysiology (Jack et al., 2013), including amyloid imaging using positron emission tomography (PET) (Hardy and Selkoe, 2002; Jagust et al., 2010), tau imaging (Maruyama et al., 2013; Villemagne et al., 2014), and brain atrophy measured with structural magnetic resonance imaging (MRI) (Fox et al., 2000; Fox and Freeborough, 1997; Jack et al., 1998, 2004). The European Medicines Agency has recently approved hippocampal volumes as an enrichment strategy for trials in mild cognitive impairment (MCI) and prodromal AD (Hill et al., 2014). All these measures can detect accelerated brain changes in the preclinical disease stages, before symptoms appear.
High-resolution structural MRI is now commonly included in AD drug trials to monitor potential side effects (e.g., microhemorrhage and vasogenic edema) and to track brain atrophy—a macroscopic reflection of neuronal death, myelin reduction, and cellular atrophy (Chertkow and Black, 2007; Dickerson and Sperling, 2005; Fleisher et al., 2009; Jack et al., 2003; Salloway et al., 2014). Numerous MRI-derived biomarkers have been developed and tested (Baron et al., 2001; Carmichael et al., 2006; Chetelat et al., 2002; Chou et al., 2009; Fox et al., 2001; Freeborough and Fox, 1997; Holland et al., 2009; Hua et al., 2013; Jack et al., 1999; Morra et al., 2009; Reuter et al., 2012; Schuff et al., 2009; Thompson et al., 2004). Over the past decade, researchers have studied the issues of bias, improved the robustness of analysis protocols (lower failure rates), and boosted the power to detect clinically significant brain changes through machine learning approaches (Christensen and Johnson, 2001; Fox et al., 2011; Gutman et al., 2013b; Hua et al., 2013; Yushkevich et al., 2010). Structural imaging biomarkers generally measure changes in regional brain volume, supplementing the information obtained from neuropsychological and cognitive tests. Structural MRI may be especially helpful in evaluating drugs that aim to restore or repair brain tissue, such as stem cell therapy or growth factors. For trials targeting AD pathology by clearing amyloid plaques and tau tangles, brain volumetric measures serve as a surrogate marker but might not always reflect clinical improvement. Overall, structural MRI can facilitate drug trial enrichment, and lower the cost of trials, or increase power to detect disease progression and factors that affect it (Weiner et al., 2010, 2012, 2015).
Recently, we have been improving and validating an unbiased 3-dimensional (3D) brain mapping approach to accurately track atrophy in the aging brain, using data from Alzheimer’s Disease Neuroimaging Initiative 1 (ADNI-1) (Hua et al., 2013). We are now expanding the analysis to ADNI-2, which differs from ADNI-1 in focusing on people with earlier stages of MCI, scanned at 3T. A single numerical summary of brain atrophy score is derived from the 3D map to capture cumulative change in the temporal lobes (e.g., average change inside the temporal region of interest [temporal-ROI] or statistically defined ROI [stat-ROI]) (Hua et al., 2013) or over the whole brain (e.g., weighted average using linear discriminant analysis [LDA]) (Gutman et al., 2013b). We aimed to address the following topics with the ADNI-2 data: (1) the best approaches to extract numerical summaries from a 3D map; (2) the minimal scan interval required to robustly detect change with a reasonable sample size using MRI-based tensor-based morphometry (TBM) analysis; (3) effects of MRI scan acceleration on statistical power to track brain change (a follow-up of an earlier pilot study, Ching et al., 2015); (4) drug trial enrichment using additional information on ApoE4 status and baseline amyloid PET imaging; (5) AD risk genes and their impact on brain atrophy rates; and (6) the applicability of TBM to multiphase studies with different scanner field strengths.
2. Materials and methods
Data used in the preparation of this article were obtained from the ADNI database (adni.loni.usc.edu). The ADNI was launched in 2003 by the National Institute on Aging, the National Institute of Biomedical Imaging and Bioengineering, the Food and Drug Administration, private pharmaceutical companies, and nonprofit organizations, as a $60 million, 5-year public-private partnership. The primary goal of ADNI has been to test whether serial MRI, PET, other biological markers, and clinical and neuropsychological assessment can be combined to measure the progression of MCI and early AD. Determination of sensitive and specific markers of very early AD progression is intended to aid researchers and clinicians to develop new treatments and monitor their effectiveness and also lessen the time and cost of clinical trials.
The principal investigator of this initiative is Michael W. Weiner, MD, VA Medical Center and University of California, San Francisco. ADNI is the result of efforts of many co-investigators from a broad range of academic institutions and private corporations, and subjects have been recruited from >50 sites across the United States and Canada. The initial goal of ADNI was to recruit 800 subjects, but ADNI has been followed by ADNI-GO and ADNI-2. To date, these 3 protocols have recruited >1,500 adults, aged 55–90 years, to participate in the research, consisting of cognitively normal older individuals, people with early mild cognitive impairment (EMCI) or late mild cognitive impairment (LMCI), and people with early AD. The follow-up duration of each group is specified in the protocols for ADNI-1, ADNI-2, and ADNI-GO. Subjects originally recruited for ADNI-1 and ADNI-GO had the option to be followed in ADNI-2. For up-to-date information, see www.adni-info.org.
2.1. The ADNI-2 dataset
Data from all ADNI-2 newly enrolled participants were downloaded from the ADNI Image Data Archive (IDA, https://ida.loni.usc.edu/) on August 7, 2014. As ADNI-2 is ongoing and more scans are being added, the current analysis reflects a snapshot of the dataset available at the time of download. The initial dataset included 2,937 nonaccelerated and 2,925 accelerated 3T sagittal T1-weighted scans. We identified subjects with both an accelerated and nonaccelerated scans acquired in the same scan session and removed subjects/scans with a scanner change during serial scanning (n = 34), subjects without a clinical diagnosis (n = 2), or scans at the 3-year time point (n = 4). The final dataset included a total of n = 5,738 scans (Table 1), with an equal number of nonaccelerated and accelerated scans, acquired at screening and 3, 6, 12, and 24 months from the following participants: 198 healthy controls (CN) (age at screening visit: 73.4 ± 6.4 years, 105 female [F]/93 male [M]), 111 individuals with significant memory complaint (SMC) (age: 72.3 ± 5.5 years, 64 F/47 M), 182 individuals with EMCI (age: 70.9 ± 7.1 years, 83 F/99 M), 177 individuals with LMCI (age: 72.2 ± 7.8 years, 79 F/97 M/1 unknown sex, subject with unknown sex only has a screening visit), and 155 probable AD patients (age: 74.8 ± 8.1 years, 65 F/90 M) (Table 2). Generally fewer scans are available at later time points, partially because of the attrition, disease progression, and limitation on the available data. Very few scans are available for SMC participants at 6 months and later, which limits the power of the analysis for the SMC group. All participants in ADNI underwent clinical, neuropsychological, and cognitive evaluations at the time of scan acquisition. Written informed consent was obtained from all participants before experimental procedures were performed.
Table 1.
Scanning sessions in ADNI-2
| Group | Screening | 3-month | 6-month | 12-month | 24-month |
|---|---|---|---|---|---|
| CN | 198 | 164 | 162 | 155 | 120 |
| SMC | 111 | 53 | 10 | 20 | 0 |
| EMCI | 182 | 163 | 145 | 143 | 83 |
| LMCI | 177 | 146 | 149 | 136 | 77 |
| AD | 155 | 111 | 96 | 89 | 24 |
| Total | 823 | 637 | 562 | 543 | 304 |
Both accelerated and nonaccelerated scans were acquired in the same session.
Key: AD, Alzheimer’s disease; ADNI-2, Alzheimer’s Disease Neuroimaging Initiative 2; CN, healthy controls; EMCI, early mild cognitive impairment; LMCI, late mild cognitive impairment; SMC, significant memory complaint.
Table 2.
Demographics of participants at the screening visit
| Group | n | F/M | Age (SD) |
|---|---|---|---|
| CN | 198 | 105/93 | 73.4 (6.4) |
| SMC | 111 | 64/47 | 72.3 (5.5) |
| EMCI | 182 | 83/99 | 70.9 (7.1) |
| LMCI | 177 | 79/97/1 unknown sex | 72.2 (7.8) |
| AD | 155 | 65/90 | 74.8 (8.1) |
Key: Age, mean age; AD, Alzheimer’s disease; CN, healthy controls; EMCI, early mild cognitive impairment; F, female; LMCI, late mild cognitive impairment; M, male; n, number of participants; SMC, significant memory complaint; SD, standard deviation.
2.2. MRI scanning and image correction
Each subject received an accelerated T1-weighted scan immediately after a nonaccelerated scan—without leaving the scanner. High-resolution structural brain MRI scans were acquired at 55 ADNI sites using 3T MRI scanners (GE Healthcare, Philips Medical Systems, or Siemens). GE scanners use inversion recovery-fast spoiled gradient recalled (IR-SPGR) sequences and Philips and Siemens use magnetization-prepared rapid gradient echo (MP-RAGE) sequences. Accelerated scan times (5:12 to 5:34 minutes) are ~4 minutes shorter (~43% faster) than nonaccelerated scan times (9:06 to 9:26 minutes). Detailed MRI scanner protocols for accelerated and nonaccelerated T1-weighted sequences by vendor are available online (http://adni.loni.usc.edu/methods/documents/mriprotocols/). Scan quality was evaluated by the ADNI MRI quality control center at the Mayo Clinic to exclude “failed” scans because of motion, technical problems, or significant clinical abnormalities (e.g., hemispheric infarction). Image corrections were applied using a standard processing pipeline called “grinder,” which included 3D gradient unwarping for GE and Siemens scans (Jovicich et al., 2006), and “N3” bias field correction for all scans (Sled et al., 1998). The final corrected image was identified by entering the search term “mt*” in the field of MRI Series Description under Processed Image Information (an example series description: MT1; GradWarp; N3m).
2.3. Tensor-based morphometry
We employed TBM to analyze all available ADNI-2 scans at screening and 3, 6, 12, and 24 months. The basic steps of TBM involved linear registration, skull stripping, and nonlinear inverse consistent elastic intensity-based registration (Ashburner and Friston, 2003; Chung et al., 2001; Collins et al., 1994; Freeborough and Fox, 1998; Hua et al., 2013; Iglesias et al., 2011; Leow et al., 2005; Marsden and Hughes, 1994; Mazziotta et al., 2001; Riddle et al., 2004; Thompson et al., 2000; Toga, 1999; Yushkevich et al., 2010; for details, see Supplementary Material). We spatially normalized these longitudinal maps of tissue change across subjects by nonlinearly aligning all individual Jacobian maps to a minimal deformation target (MDT) made for the ADNI-1 study (Hua et al., 2013). This allows for regional comparisons and group statistical analyses across ANDI-1 and ADNI-2 analyses.
In the current and all previous TBM analyses, we processed 100% of the data passing the standard image quality control by Mayo Clinic and available for download from the ADNI IDA. No scans were excluded during the image analysis. The numerical summaries from the full initial dataset are available for download from the IDA.
2.4. Group average maps
To illustrate the average amount of atrophy at each follow-up time point relative to the screening visit, we computed the voxel-wise mean Jacobian map across subjects within each diagnostic group. These maps were color coded to show the average percentage of regional brain tissue loss and ventricular/cerebrospinal fluid (CSF) expansion, relative to the screening scan.
ADNI-2 participants are scanned at screening, 3 months from the screening MRI, and then within 2 weeks before or after the 6-month and subsequent annual visits. We used the expected scan interval or nominal scan interval in all the analyses. In the previous work, we found similar results in modeling the trend of brain atrophy using actual and expected scan intervals in the ADNI-1 study (Hua et al., 2013).
2.5. Statistical whole-brain analysis
We carried out whole-brain statistical analysis to compare accelerated versus nonaccelerated protocols and to test effects of the top 10 AD risk genes on rate of brain atrophy, after controlling for age, sex, and multiple comparisons. For details, see Supplementary data SI2.
2.6. Numerical summaries and power analysis
Power analyses in clinical trials typically use a single numerical summary from each participant at follow-up. There are different methods to extract the numerical summaries. Here we tested 3 approaches: (1) an average within an anatomically defined ROI (temporal-ROI), (2) an average within a statistically defined ROI based on a small training sample (stat-ROI, based on voxels with significant atrophic rates [p < 0.00001] within the temporal lobes, in a training set of 20 AD patients from ADNI-1 scanned at baseline and 12 months) (Hua et al., 2013), and (3) a weighted average using the LDA approach based on a large training sample (144 AD and 337 MCI from ADNI-1 scanned at baseline and 12 months) (Gutman et al., 2013b) (Fig. 1).
Fig. 1.
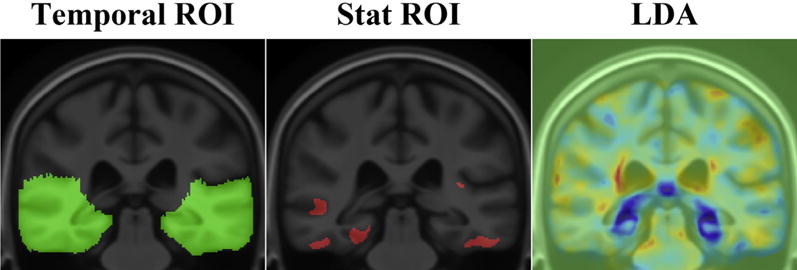
Approaches to compute numerical summaries. Numerical summaries are computed as an average inside the temporal lobes (temporal-ROI), inside the statistically defined ROI (stat-ROI), and as a weighted average using the linear discriminant analysis (LDA). The LDA map shows the weighting parameters trained on a large sample from Alzheimer’s Disease Neuroimaging Initiative 1. The concept of stat-ROI originated in fludeoxyglucose positron emission tomography analysis, advocated by Chen et al. (2010). Other methods exist to compute whole-brain atrophy rates, such as using the iterative principal component analysis (Chen et al., 2004).
A power analysis was defined by the ADNI Biostatistics Core to estimate the sample size required to detect a 25% reduction in the mean annual rate of atrophy, using a 2-sided test and standard significance level (α = 0.05) for a hypothetical 2-arm study (treatment vs. placebo). The estimated minimum sample size for each arm is computed from the formula subsequently. Briefly, β denotes the estimated change and σD refers to the standard deviation of the rate of atrophy across subjects:
Here zα is the value of the standard normal distribution for which P[Z < zα] = α, and α is set to its conventional value of 0.05 (Rosner, 1990). The sample size required to achieve 80% power was computed in this study, referred to as n80. As the observation time ranged from 3 to 24 months, instead of converting the cumulative change to an annual rate of atrophy, we computed the number of subjects required to detect a 25% reduction in the overall atrophy occurring over the interval. These sample size estimates define how many patients would need to be recruited for clinical trials with durations of 3, 6, 12, and 24 months, respectively. The 95% confidence interval for the n80 statistic was computed based on 10,000 bootstrapped resampling, with a bias corrected and accelerated percentile method (Davison and Hinkley, 1997; Efron and Tibshirani, 1993), computed in R using the boot package.
Numerical summaries derived from accelerated and nonaccelerated scans were compared using a paired 2-sample Student t test. The statistical threshold was corrected for multiple comparisons across 3 different methods to compute the numerical summaries, using Bonferroni correction (corrected p threshold <0.017).
To demonstrate the possible effect sizes after adjusting for healthy aging, we computed sample size estimates using the relative change (Supplementary Table 2). The power analysis was conducted by calculating sample size estimates using the variance parameters from the patient cohort, with the treatment effect defined as 25% of the difference between the mean rates of change in the patients and CN (Holland et al., 2012).
2.7. Drug trial enrichment using ApoE4 status and brain amyloid PET imaging
We tested a clinical trial enrichment approach using the 12-month stat-ROI numerical summaries derived from nonaccelerated scans. A total of 543 participants had MRI scans and numerical summaries at 12 months (Table 1). We excluded the following participants from the analysis: no ApoE information (n = 40), ApoE ε4/ε2 carriers (n = 9, because of the opposing effect of ε4 and ε2 alleles), no baseline amyloid PET (n = 5), and diagnosed as SMC (n = 20, the sample is too small to divide further). The final dataset included 491 participants, including 150 CN, 137 EMCI, 128 LMCI, and 76 AD. ApoE status was defined as ApoE4+ (ε4/ε4, ε4/ε3) versus ApoE4− (ε3/ε3, ε3/ε2, ε2/ε2). Brain amyloid summaries at screening were downloaded from the IDA and classified into amyloid+ (BL_SUVR_Summary ≥ 1.11) versus amyloid− (BL_SUVR_Summary < 1.11).
Statistical comparisons were made based on bootstrapped n80 estimates (n = 10,000 resampling). The null hypotheses were that there are no differences in sample size estimates (n80s) when stratifying the sample by ApoE4+ versus ApoE4−, amyloid+ versus amyloid−, or amyloid+/ApoE4+ versus amyloid−/ApoE4−. We computed bootstrapped mean n80 comparisons between the pairs of samples and provided a nonparametric estimate of the probability that the n80s are unequal (p values in Tables 5–7) (Gutman et al., 2013a).
Table 5.
Drug trial enrichment using ApoE status
| Group | ApoE4+
|
ApoE4−
|
p | ||||
|---|---|---|---|---|---|---|---|
| n | Mean (SD) | n80 (CI) | n | Mean (SD) | n80 (CI) | ||
| CN | 40 | 0.78 (0.72) | 212 (125, 422) | 110 | 0.81 (0.79) | 237 (156, 440) | 0.369 |
| EMCI | 60 | 1.18 (0.98) | 172 (116, 267) | 77 | 0.75 (0.96) | 408 (249, 770) | 0.007 |
| LMCI | 70 | 1.92 (1.22) | 102 (71, 149) | 58 | 1.04 (1.08) | 272 (167, 508) | 0.001 |
| AD | 54 | 2.39 (1.34) | 80 (51, 133) | 22 | 1.93 (1.14) | 87 (51, 160) | 0.442 |
Mean percentage of tissue atrophy (SD) and n80 (95% CI) for statistically defined region of interest numerical summaries are derived in CN, EMCI, LMCI, and AD groups over 12 months, ApoE4+ (ε4/ε3, ε4/ε4) and ApoE4− (ε3/ε3, ε3/ε2, ε2/ε2). n indicates the number of participants in the analysis. p Values estimate the evidence that the true 12-month n80 in ApoE4− group is equal to or greater than that of the ApoE4+ group (p < 0.05 marked in bold font).
Key: AD, Alzheimer’s disease; CI, confidence interval; CN, healthy controls; EMCI, early mild cognitive impairment; LMCI, late mild cognitive impairment; SD, standard deviation.
Table 7.
Drug trial enrichment based on using ApoE and brain amyloid at the screening visit
| Group | Amyloid+/ApoE4+
|
Amyloid−/ApoE4−
|
p | ||||
|---|---|---|---|---|---|---|---|
| n | Mean (SD) | n80 (CI) | n | Mean (SD) | n80 (CI) | ||
| CN | 18 | 1.14 (0.71) | 98 (53, 228) | 81 | 0.80 (0.77) | 232 (145, 499) | 0.024 |
| EMCI | 42 | 1.39 (0.99) | 128 (83, 209) | 52 | 0.61 (0.84) | 476 (245, 1,230) | 0.002 |
| LMCI | 64 | 2.04 (1.17) | 83 (59, 122) | 34 | 0.86 (0.89) | 274 (146, 642) | 0.002 |
| AD | 53 | 2.42 (1.33) | 76 (48, 127) | 7 | 1.41 (1.32) | 222 (105, 758) | 0.101 |
Mean percentage of tissue atrophy (SD) and n80 (95% CI) for statistically defined region of interest numerical summaries are derived in CN, SMC, EMCI, LMCI, and AD groups over 12 months. n indicates the number of participants in the analysis. p Values estimate the evidence that the true 12-month n80 in amyloid−/ApoE4− group is equal to or greater than that of the amyloid+/ApoE4+ group (p < 0.05 marked in bold font).
Key: AD, Alzheimer’s disease; CI, confidence interval; CN, healthy controls; EMCI, early mild cognitive impairment; LMCI, late mild cognitive impairment; SD, standard deviation.
3. Results
3.1. 3D maps of longitudinal brain change at 3, 6, 12, and 24 months
Color maps show average levels of cumulative brain change in CN, SMC, EMCI, LMCI, and AD groups, respectively, at each follow-up (Figs. 2–5). Changes were detectable at the very short scan intervals, for example, 3 months, showing prominent ventricular/CSF expansion and emerging temporal lobe atrophy in LMCI and AD (Fig. 2). The characteristic pattern of Alzheimer’s brain degeneration, with concentrated temporal lobe atrophy accompanied by extensive CSF expansion in the lateral ventricles, became more distinct at longer scan intervals at 6, 12, and 24 months (Figs. 3–5). Similarly, as the disease stage progressed from EMCI, LMCI, and to AD, a greater amount of degeneration was observed, and the pattern of AD became more distinct. CN showed a mild and evenly distributed pattern of brain atrophy, with no focal accumulation of tissue loss in the temporal lobes. The color scales were adjusted at different time points to illustrate the overall scale of change. There were no SMC participants at 24 months follow-up. Some of the most significant areas of volume loss are in the thalami bilaterally. Supporting this, some studies show strongly reduced volume in the thalamus in late-onset AD (de Jong et al., 2008) and at the presymptomatic stage of familial AD (Ryan et al., 2013).
Fig. 2.
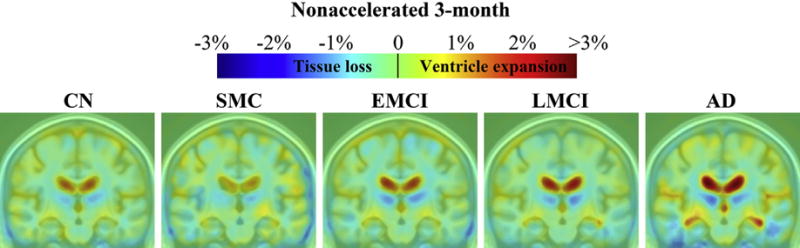
Three-dimensional maps show average brain change from screening to 3-month follow-up, in different diagnostic groups. Warmer (red) colors indicate ventricle/cerebrospinal fluid expansion, and cooler (blue) colors signify tissue loss. The absolute (not annual) change at 3 months was about 0%–1% for temporal lobe tissue loss and 1%–3% for ventricular expansion. Key: AD, Alzheimer’s disease; CN, healthy controls; EMCI, early mild cognitive impairment; LMCI, late mild cognitive impairment; SMC, significant memory complaint. (For interpretation of the references to color in this figure legend, the reader is referred to the Web version of this article.)
Fig. 5.
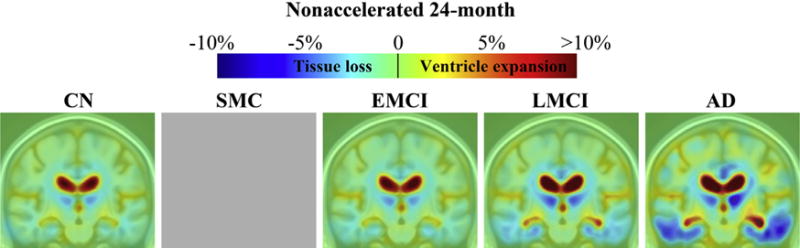
Three-dimensional maps show average brain change from screening to 24-month follow-up, in different diagnostic groups. Warmer (red) colors indicate ventricle/cerebrospinal fluid expansion, and cooler (blue) colors signify tissue loss. The absolute (not annual) change at 24 months was about 1%–7% for temporal lobe tissue loss and 5%–10% or more for ventricular expansion. Key: AD, Alzheimer’s disease; CN, healthy controls; EMCI, early mild cognitive impairment; LMCI, late mild cognitive impairment; SMC, significant memory complaint. (For interpretation of the references to color in this figure legend, the reader is referred to the Web version of this article.)
Fig. 3.
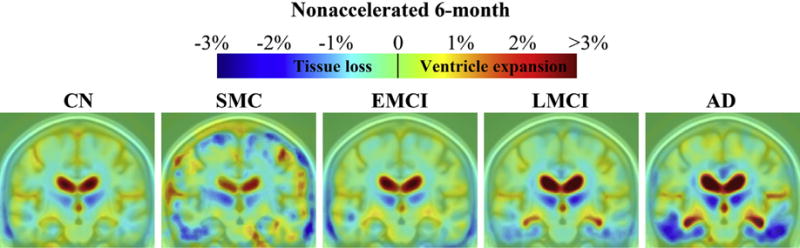
Three-dimensional maps show average brain change from screening to 6-month follow-up, in different diagnostic groups. Warmer (red) colors indicate ventricle/cerebrospinal fluid expansion, and cooler (blue) colors signify tissue loss. The absolute (not annual) change at 6 months was about 0.5%–2% for temporal lobe tissue loss and 1%–3% in ventricular expansion Key: AD, Alzheimer’s disease; CN, healthy controls; EMCI, early mild cognitive impairment; LMCI, late mild cognitive impairment; SMC, significant memory complaint. (For interpretation of the references to color in this figure legend, the reader is referred to the Web version of this article.)
Maps derived from accelerated scans were visually similar to nonaccelerated scans and are not shown here. We performed a whole-brain comparison between tissue change maps derived from accelerated versus nonaccelerated scans, using a voxel-wise paired t test. Similar to the pilot study, we observed regional differences in the thalamus and cerebellum at shorter scan intervals (3 months: critical p value = 0.0007; 6 months: critical p value = 0.001) and no difference at longer scan intervals (12 and 24 months).
3.2. Numerical summaries and power analysis
From the 3D maps of longitudinal brain change (Figs. 2–5), we extracted 3 types of numerical summaries based on temporal-ROI, stat-ROI, and LDA weighting. Stat-ROI numerical summaries demonstrated improved statistical power or smaller sample size estimates compared with temporal-ROI but LDA-based weighting performed best (Table 3).
Table 3.
Sample size estimates for nonaccelerated scans
| Group | n | Temporal-ROI
|
Stat-ROI
|
LDA
|
|||
|---|---|---|---|---|---|---|---|
| Mean (SD) | n80 (CI) | Mean (SD) | n80 (CI) | Mean (SD) | n80 (CI) | ||
| 3-month | |||||||
| CN | 164 | 0.14 (0.62) | 4,807 (1,803, 43,335) | 0.32 (0.70) | 1,229 (649, 3,264) | 0.09 (0.13) | 571 (368, 996) |
| SMC | 53 | 0.13 (0.54) | 4,288 (953, 1,517,483) | 0.27 (0.61) | 1,279 (572, 6,609) | 0.07 (0.11) | 633 (296, 2,303) |
| EMCI | 163 | 0.16 (0.64) | 4,002 (1,449, 33,950) | 0.41 (0.76) | 865 (513, 1,770) | 0.09 (0.12) | 409 (272, 671) |
| LMCI | 146 | 0.18 (0.58) | 2,514 (1,070, 11,537) | 0.39 (0.70) | 793 (473, 1,816) | 0.11 (0.13) | 374 (255, 611) |
| AD | 111 | 0.22 (0.57) | 1,630 (760, 6,455) | 0.52 (0.79) | 582 (350, 1,140) | 0.13 (0.13) | 285 (194, 467) |
| 6-month | |||||||
| CN | 162 | 0.17 (0.70) | 4,074 (1,531, 31,313) | 0.49 (0.78) | 643 (389, 1,306) | 0.15 (0.12) | 175 (121, 279) |
| SMC | 10 | 0.28 (0.82) | 2,185 (301, 6,742,127) | 0.38 (0.77) | 1,031 (217, 1,683,650) | 0.12 (0.18) | 535 (164, 446,749) |
| EMCI | 145 | 0.12 (0.65) | 7,852 (2,151, 355,793) | 0.44 (0.81) | 859 (525, 1,760) | 0.14 (0.14) | 244 (180, 344) |
| LMCI | 149 | 0.32 (0.62) | 964 (552, 2,254) | 0.86 (0.90) | 276 (190, 423) | 0.20 (0.15) | 137 (104, 184) |
| AD | 96 | 0.55 (0.73) | 438 (269, 851) | 1.40 (1.02) | 132 (91, 220) | 0.26 (0.18) | 118 (87, 171) |
| 12-month | |||||||
| CN | 155 | 0.33 (0.75) | 1,323 (751, 2,940) | 0.80 (0.79) | 241 (171, 379) | 0.22 (0.16) | 127 (94, 188) |
| SMC | 20 | 0.09 (0.60) | 11,598 (1,252, 197,296,613) | 0.60 (0.82) | 469 (200, 2,561) | 0.21 (0.16) | 149 (72, 411) |
| EMCI | 143 | 0.34 (0.75) | 1,232 (631, 3,521) | 0.92 (1.03) | 314 (220, 538) | 0.24 (0.18) | 141 (108, 189) |
| LMCI | 136 | 0.58 (0.80) | 485 (299, 986) | 1.54 (1.23) | 162 (124, 221) | 0.34 (0.18) | 72 (55, 95) |
| AD | 89 | 0.90 (0.79) | 194 (132, 312) | 2.30 (1.29) | 80 (58, 114) | 0.44 (0.19) | 48 (34, 71) |
| 24-month | |||||||
| CN | 120 | 0.47 (0.72) | 577 (368, 1,093) | 1.33 (0.94) | 127 (89, 195) | 0.38 (0.17) | 49 (36, 66) |
| SMC | 0 | N/A | N/A | N/A | N/A | N/A | N/A |
| EMCI | 83 | 0.58 (0.79) | 463 (276, 953) | 1.52 (1.17) | 150 (110, 211) | 0.41 (0.24) | 88 (65, 127) |
| LMCI | 77 | 1.04 (1.00) | 232 (157, 375) | 2.76 (1.87) | 116 (86, 161) | 0.59 (0.30) | 62 (45, 89) |
| AD | 24 | 1.79 (1.20) | 113 (70, 196) | 4.15 (2.37) | 82 (42, 184) | 0.74 (0.28) | 37 (17, 75) |
Mean percentage of tissue atrophy, SD, and n80 (95% CI) for numerical summaries derived in CN, SMC, EMCI, LMCI, and AD groups over 3, 6, 12, and 24 months. The change in the stat-ROI is higher than detected in the temporal-ROI. LDA-based summaries have the smallest mean change and lowest variability. LDA computes a weighted average; so, the mean change is not directly comparable with measures derived from temporal and stat-ROIs. n indicates the number of participants in the analysis. Gray shading indicates that the upper limit of 95% CI of n80 estimate is ≤600 (that we operationally defined as a feasible sample size), and black shading indicates that the upper limit of 95% CI of n80 estimate is ≤200 (a highly feasible sample size).
Key: AD, Alzheimer’s disease; CI, confidence interval; CN, healthy controls; EMCI, early mild cognitive impairment; LDA, linear discrimination analysis; LMCI, late mild cognitive impairment; N/A, not applicable; ROI, region of interest; SD, standard deviation; SMC, significant memory complaint; stat-ROI, statistically defined ROI.
The amount of cumulative atrophy and sample size estimates at 3, 6, 12, and 24 months were summarized in Table 3. At 3 months, the variability of change (standard deviation) greatly exceeded the mean atrophy, resulting in enormous sample size estimates. At 6 months, sample size estimates dropped to a more feasible level for LMCI and AD patients. With longer scan intervals, the mean levels of cumulative atrophy rise and the sample size estimates drop. For a 12-month trial, power analysis indicated that 241 CN, 314 EMCI, 162 LMCI, or 80 AD per arm were needed to power a hypothetical clinical trial using stat-ROI summaries, to detect a 25% slowing of rate of change, and only 127 CN, 141 EMCI, 72 LMCI, or 48 AD were needed if using the LDA-weighted summaries. For a 24-month trial, 127 CN, 150 EMCI, 116 LMCI, or 82 AD were needed to power a hypothetical clinical trials using stat-ROI summaries, and only 49 CN, 88 EMCI, 62 LMCI, or 37 AD were needed if using the LDA-weighted summaries.
Numerical summaries derived from accelerated scans were quantitatively similar (Supplementary Table 1). There was no difference between numerical summaries derived from accelerated scans and those from nonaccelerated scans, using paired 2-sample t tests (all p > 0.017, corrected for multiple comparisons, Table 4), in the current analysis. Although not statistically significant, the p values of stat-ROI numerical summaries at 12 months and LDA summaries at 24 months were close to the statistical threshold.
Table 4.
Effects of MRI scan acceleration on changes detected at 3-, 6-, 12-, and 24-momth follow-up scan intervals, in the combined group
| Scan interval | Temporal-ROI | Stat-ROI | LDA |
|---|---|---|---|
| 3-month | 0.996 | 0.905 | 0.320 |
| 6-month | 0.497 | 0.322 | 0.934 |
| 12-month | 0.229 | 0.021 | 0.293 |
| 24-month | 0.166 | 0.085 | 0.020 |
p Values from paired 2-sample t tests were used to compare numerical summaries derived from accelerated and nonaccelerated scans. No difference was detected between scan types in temporal-ROI, stat-ROI, or LDA weighting (all p > 0.017, corrected for multiple comparisons).
Key: LDA, linear discriminant analysis; MRI, magnetic resonance imaging; ROI, region of interest; stat-ROI, statistically defined ROI.
The sample size estimates after adjusting for healthy aging were computed using the variance parameters from the patient cohort and the treatment effect defined as 25% of the difference between the mean rates of change in the patients and CN (Supplementary Table S-2, also see Section 4). As expected, the n80s based on relative change are considerably larger compared with sample size estimates based on absolute change. Numerical summaries derived from stat-ROI and LDA measures generally give higher statistical power (lower sample size estimates) compared with temporal-ROI estimates, with the exception of the EMCI group. There were no reasonable sample size estimates for the EMCI group or at very short scan intervals (3 and 6 months). The aging-adjusted sample size estimates for the stat-ROI (n80s: 178 AD and 434 LMCI) and LDA (n80s: 155 AD and 478 LMCI) measures are competitive compared with existing methods that have been applied to the ADNI-1 sample, assuming a 24-month trial (Gutman et al., 2013a; Holland et al., 2012). For machine learning approaches such as LDA, 2-class LDA classification was shown to deliver higher statistical power compared with using a stat-ROI and surpassed results based on the relative change (Gutman et al., 2013a).
3.3. Drug trial enrichment using ApoE and brain amyloid imaging
We explored drug trial enrichment strategies using the ApoE status, and brain amyloid load, using 12-month stat-ROI numerical summaries derived from nonaccelerated MRI scans. Using the ApoE information alone, people who were ApoE4+ (ε4/ε3, ε4/ε4) showed faster decline and gave significantly lower sample size estimates compared with noncarriers, that is, ApoE4− (ε3/ε3, ε3/ε2, ε2/ε2), in EMCI and LMCI participants (Table 5 and Fig. 6A). Participants with ε4/ε2 were excluded because of the opposing effect of ε4 (damaging) and ε2 (protective) genotypes. Using the brain amyloid information only, sample size estimates were significantly smaller in amyloid+ EMCI and LMCI participants, and borderline significant in AD patients, compared with amyloid− patients (Table 6 and Fig. 6B). When ApoE and brain amyloid information was combined, the lowest sample size estimates (highest statistical power) were achieved in amyloid+/ApoE4+ across all diagnostic groups. n80s were significantly lower in amyloid+/ApoE4+ compared with amyloid−/ApoE4− in healthy, EMCI, and LMCI participants. Only 98 CN, 128 EMCI, 83 LMCI, and 76 AD were need for a 1-year trail in amyloid+/ApoE4+ versus 232 CN, 476 EMCI, 274 LMCI, and 222 AD in amyloide−/ApoE4− (Table 7 and Fig. 6C). Enrichment strategies can aid in the identification of high risk individuals in presymptomatic and early phases of the disease, that is, EMCI and LMCI, or even a small percentage of CN individuals. Participants who were classified amyloid+/ApoE4+ accounted for 12%, 31%, 50%, and 70% of the total subject pool in CN, EMCI, LMCI, and AD groups, respectively.
Fig. 6.
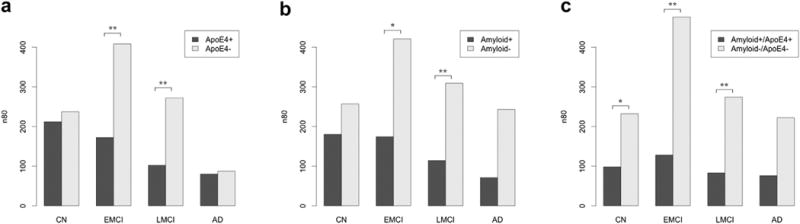
Sample size estimates (n80s) after trial enrichment (subject preselection) using ApoE status (A), brain amyloid load at the screening visit (B), and both combined (C). Statistical significance is based on a nonparametric estimate of the probability that the n80s are unequal between the pairs. *p < 0.05, **p < 0.01. After both screening methods are used, sample size requirements are around 100 subjects, regardless of diagnostic group.
Table 6.
Drug trial enrichment using brain amyloid load at the screening visit
| Group | Amyloid+
|
Amyloid−
|
p | ||||
|---|---|---|---|---|---|---|---|
| n | Mean (SD) | n80 (CI) | n | Mean (SD) | n80 (CI) | ||
| CN | 47 | 0.95 (0.80) | 180 (103, 496) | 103 | 0.74 (0.75) | 257 (167, 473) | 0.189 |
| EMCI | 67 | 1.26 (1.05) | 174 (113, 288) | 70 | 0.63 (0.81) | 421 (240, 857) | 0.012 |
| LMCI | 88 | 1.84 (1.24) | 114 (81, 169) | 40 | 0.82 (0.91) | 309 (171, 701) | 0.005 |
| AD | 68 | 2.37 (1.26) | 71 (49, 111) | 8 | 1.29 (1.27) | 243 (117, 751) | 0.061 |
Mean percentage of tissue atrophy (SD) and n80 (95% CI) for statistically defined region of interest numerical summaries are derived in CN, EMCI, LMCI, and AD groups over 12 months, amyloid+ [BL_SUVR_Summary ≥ 1.11] and amyloid− [BL_SUVR_Summary < 1.11]. n indicates the number of participants in the analysis. p Values estimate the evidence that the true 12-month n80 in amyloid− group is equal to or greater than that of the amyloid+ group (p < 0.05 marked in bold font).
Key: AD, Alzheimer’s disease; CI, confidence interval; CN, healthy controls; EMCI, early mild cognitive impairment; LMCI, late mild cognitive impairment; SD, standard deviation.
Compared with the nonenriched sample, p values were 0.011, 0.003, 0.001, and 0.379 in normal, EMCI, LMCI, and AD groups, respectively. These nonparametric p values estimate the evidence that the true 12-month n80 in the nonenriched group (everyone) is equal to or greater than that of the enriched group (amyloid+/ApoE4+). The enrichment effect is significant in normal, EMCI, and LMCI groups but not in the AD group. Similar effects are observed comparing subjects not qualified for enrichment criteria (amyloid+/ApoE4−, amyloid−/ApoE4+, amyloid−/ApoE4−) and the enrichment group (amyloid+/ApoE4+). The p values were 0.006, 0.0003, <0.00001, and 0.296 in normal, EMCI, LMCI, and AD groups, respectively.
3.4. Genetic risk for brain atrophy
We tested effects on brain atrophy rates of the top 10 AD risk genes in ADNI-1, ADNI-2, and the combined sample ADNI-1 and -2 at 12-month follow-up using nonaccelerated scans. Only ApoE4 showed a significant effect on brain atrophy rates, after controlling for age, sex, scan interval, and multiple comparisons in ADNI-1 (critical p value = 0.008), ADNI-2 (critical p value = 0.008), and ADNI-1 and -2 (critical p value = 0.015). In the combined analysis (ADNI-1 and -2), each copy of ε4 genotype was associated with ~1% greater atrophy in the temporal lobes and 1%–2% CSF expansion in the lateral ventricles (Fig. 7). As ApoE status is strongly linked to AD risk, we carried out an additional analysis controlling for diagnosis (coded as dummy variables for SMC, EMCI, LMCI, and AD). The ApoE4 effect remained significant after controlling for diagnosis and after correcting for multiple comparisons (critical p value = 0.005) in the combined sample.
Fig. 7.
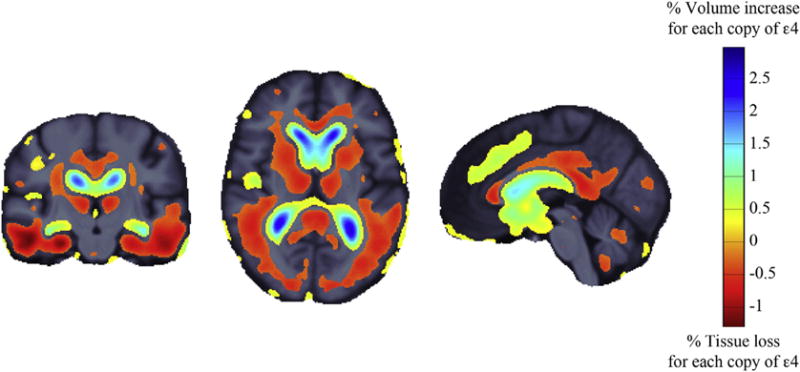
Three-dimensional maps show areas where longitudinal changes in brain volumes were significantly associated with the number of ApoE ε4 alleles. The regression coefficients (unstandardized beta values or “slopes”) are shown at each voxel that passed multiple comparison corrections (critical p value = 0.015), after controlling for age, sex, and scan interval. In the combined analysis (Alzheimer’s Disease Neuroimaging Initiative 1 and 2), each copy of ε4 allele was associated with ~1% greater atrophy in the temporal lobes and 1%–2% cerebrospinal fluid expansion in the lateral ventricles.
4. Discussions
We applied longitudinal TBM to analyze the ADNI-2 dataset. Together with the ADNI-1 TBM analysis, our analysis constitutes the largest longitudinal brain imaging study of aging and dementia. Building on our prior work, we tested which methods performed best for tracking brain changes and identified factors that further improved sample size requirements for drug trials. Overall, we recommend a TBM-based approach to MRI analysis, using a statistically defined region of interest or LDA weighting to define a target atrophy pattern. By preselecting people with baseline brain amyloid and ApoE4 genotypes, sample sizes for reasonably powered trials were around 100, regardless of diagnosis. Other risk genes than ApoE offered no detectable preselection benefit. Longer MRI scans (nonaccelerated scans) did not offer detectable advantages over accelerated scans, at least for this method in 1- to 2-year scan interval.
We have shown that TBM performs well in multiphase studies with different scanning protocols (1.5T in ADNI-1 vs. 3T in ADNI-2), as we tested it extensively in the ADNI-1 dataset, and now successfully applied it to ADNI-2 dataset and combined the analyses from ADNI-1 and -2. This simulates a scenario in real clinical trials involving multiple study sites and phases. Both analyses were aligned into the same minimal deformation target (anatomic) space, which enabled direct comparison of the 2 studies and pooling the data through “mega-analysis” at the voxel level. The 3D maps of longitudinal brain change and derived numerical summaries were comparable between ADNI-1 and -2. Both the stat-ROI and LDA weighting were trained using the ADNI-1 sample. ADNI-2 serves as an independent testing sample and shows comparable results. This suggests that the TBM method is likely transferrable into real clinical trials compatible with the ADNI design, without the need for additional training samples.
4.1. Finding the optimal trial duration
It is of great clinical interest to test the minimal scan interval required to detect changes, as longer trials tend to cost more and may suffer from high attrition rates. Although 3 months changes were detectable with TBM, the levels of variability greatly exceed the change, resulting in unreasonable (extremely large) sample size estimates. Shorter scan intervals might be achieved in the future with higher resolution imaging or with even better methods for tracking brain change. With longer scan intervals, the mean change grew faster than its standard deviation, resulting in a continuous drop in n80s, or higher statistical power to detect change. The 6-month interval was the minimal duration needed to detect reliable change, although 12 months offered the most robust results, across stat-ROI and LDA-based numerical summaries, after considering a trade-off between scan interval and effect size. Statistical effect is higher at longer scan interval (e.g., 24 months), whereas shorter trials with sufficient power (e.g., 12 months) are preferred because of concerns of cost and attrition.
4.2. Power of numerical summaries
Both stat-ROI and LDA are training-based approaches to define a region of interest in a scan, and they both outperformed an anatomically defined temporal-ROI. The stat-ROI was trained to select regions with the highest and most consistently detectable change in 20 AD patients, whereas the LDA weighting was trained on the full ADNI-1 AD and MCI sample (including 144 AD and 337 MCI) and directly optimizes the n80 estimates using information across the whole brain. Each method has pros and cons in terms of training sample requirements (expensive for drug trials), statistical power, and interpretability (Table 8). There is also a trade-off between statistical power and interpretability. Temporal lobe atrophy is the most interpretable measure, and it would be intuitively well received if it could be shown that a new drug slowed down temporal lobe atrophy. Even so, the sample size requirements for this are enormous within a typical scan interval of 12 and 24 months. On the other hand, LDA weighting offers the highest performance in statistical power, but it has more limited interpretability for clinical trials. LDA defines a whole-brain pattern of atrophy, which maximizes the effect size of the resulting atrophy measure. However, because of the highly correlated nature of Jacobians in neighboring voxels, neither the LDA weight maps nor the resulting numerical summary can be easily interpreted; please see (Haufe et al., 2014) on the interpretation of weight vectors of linear models in multivariate neuroimaging. For example, the mean LDA-based annual change is about 3–4 times smaller than the stat-ROI summaries. Thus, a new drug may or may not target LDA-derived atrophy patterns specifically. Stat-ROI offers a reasonable middle ground offering good statistical power while maintaining interpretability.
Table 8.
Pros and cons of numerical summaries of brain changes on MRI, derived from an anatomic atlas (e.g., a temporal ROI), statistical ROI, or LDA-based weighting
| Type of ROI | Pros | Cons |
|---|---|---|
| Anatomic ROI |
|
|
| Statistical ROI |
|
|
| LDA weighting |
|
|
Key: LDA, linear discriminant analysis; MRI, magnetic resonance imaging; ROI, region of interest.
We have shown earlier that TBM-derived imaging biomarkers are correlated with baseline and changes in cognitive measures (Hua et al., 2010). Future studies should also compare the 3 types of TBM numerical summaries for their associations with the change of cognitive measures, in the combined sample of ADNI-1 and -2.
4.3. Scan acceleration
Consistent with our pilot study in a smaller sample (n = 345 at 6 months and n = 156 at 12 months) (Ching et al., 2015) and a separate study using TBM-SyN measures (Vemuri et al., 2015), MRI scan acceleration had minimal effects on TBM-derived atrophic measures, as long as the scanning protocol is consistent throughout the study duration. Small regional differences were detected in the thalamus and cerebellar areas at short scan intervals (3 and 6 months) but disappeared at longer intervals (12 and 24 months). It is unknown why the effect is not detected when changes are more prominent, but change is much less reliably detected at very short scan intervals. Nevertheless, TBM studies focusing on the thalamus and cerebellar structures should conduct further analysis on the effects of scan acceleration or stick to one scanning protocol. For a detailed analysis on the effect of scan acceleration on TBM-derived brain atrophic measures, including an analysis by scanner vendor, please refer to Ching et al. (2015). There was no significant effect of scanner vendor, at least in the TBM analysis, which predicted the difference in accelerated and nonaccelerated numerical summaries.
4.4. Adjustment for healthy aging
We computed sample size estimates using the absolute change (main text, Tables 3 and 5–7), following the definition by the ADNI Biostatistics Core. There is some argument in favor of this, as it allows for the possibility that a treatment could slow some of the processes that contribute to normal aging, some of which overlap mechanistically with the biological processes promoting atrophy in the disease group. Even so, some researchers advocate the use of the relative change, or rate of change adjusted for healthy aging, to define the treatment effect (Holland et al., 2012); so, we present these measures as Supplementary Table 2. After adjusting for healthy aging, the sample size estimates were computed using the variance parameters from the patient cohort, and the treatment effect defined as 25% the difference between the mean rates of change in patients and CN. One major advantage of this approach is that it can partially cancel out any systematic methodological bias, avoiding unduly optimistic power estimates. There are several caveats related to applying this approach here. First, the standard deviations in the rate of change and sample sizes differ substantially between the available patient and control groups (e.g., at 24 months, the standard deviation of stat-ROI cumulative atrophy in AD is 2.5 times that in CN, based on data from 24 AD patients vs.120 CN). Second, many current MCI or AD trials do not enroll healthy subjects as controls. Last, age is the biggest risk factor for AD and many of the contributing biological processes are the same, for example, vascular degeneration. Therefore in theory, atrophy and cognitive decline in healthy aging may be treatable by some drugs that resist AD, although currently no existing drug is designed to specifically target normal aging. Nevertheless, a growing number of prevention trials now enroll healthy subjects and treat them (Eastman, 2012; Ross et al., 2012), in which case they would be considered as a “treatment group.”
In real clinical trials, a treatment group is typically compared with a placebo group to assess drug effects. Subtracting the placebo group mean could help to isolate treatment effects while reducing any sources of bias in power analyses. Of course, the best practice in imaging biomarker development is to address any methodological bias at the source, by improving algorithms or correcting steps that lead to bias, instead of trying to cancel out the effect in the enrolment design.
4.5. Drug trial enrichment strategy for early-stage trials
Newer AD drugs are being tested on presymptomatic participants (EMCI and LMCI) aiming to halt or slow down the decline before substantial damage has been done to the brain. MCI participant are highly diverse; thus, efficient drug trial enrichment strategies are needed to pilot the trials on subjects with the most rapid decline or highest risk of conversion to AD. Drug trial enrichment is achieved by using ApoE4 status, the major risk allele for AD (Hua et al., 2013; Roses, 1996; Roses and Saunders, 1994; Saunders et al., 1993; Schuff et al., 2009). Brain amyloid load detected by PET is another important indicator of early AD pathology, and it has been used to predict patients with imminent decline (Jack et al., 2010; Jagust et al., 2010). There has been evidence suggesting an interaction between ApoE4 and brain amyloid level (Lim et al., 2014; Mormino et al., 2014). We have shown that the combined information could further enrich the drug trials for pilot studies aimed to demonstrate drug efficacy in a targeted group and understand the mechanism of action.
4.6. AD risk genes and brain atrophy
In the search of risk genes affecting longitudinal brain change, ApoE was the single significant factor in our analysis. Other top AD risk genes may have an effect not detectable with the current sample or limited by the statistical power from a relatively short scan interval (1–2 years) because AD is a slow progressing disease. Even so, exploratory analysis is important in AD research. Once brain change in a large population has been mapped, we can carry out various exploratory analysis to derive novel imaging biomarkers with new approaches to capture disease-specific change and identify new drug trial enrichment strategies. TBM offers a robust platform for structural imaging biomarker analysis.
Supplementary Material
Fig. 4.
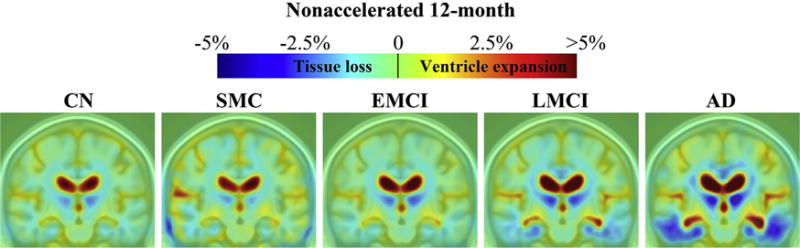
Three-dimensional maps show average brain change from screening to 12-month follow-up, in different diagnostic groups. Warmer (red) colors indicate ventricle/cerebrospinal fluid expansion, and cooler (blue) colors signify tissue loss. The absolute change at 12 months was about 1%–3% for temporal lobe tissue loss and 2%–5% or even more in ventricular expansion. Key: AD, Alzheimer’s disease; CN, healthy controls; EMCI, early mild cognitive impairment; LMCI, late mild cognitive impairment; SMC, significant memory complaint. (For interpretation of the references to color in this figure legend, the reader is referred to the Web version of this article.)
Acknowledgments
Data collection and sharing for this project were funded by the Alzheimer’s Disease Neuroimaging Initiative (ADNI) (National Institutes of Health [NIH] grant U01 AG024904) and DOD ADNI (Department of Defense award number W81XWH-12-2–0012). ADNI is funded by the National Institute on Aging, the National Institute of Biomedical Imaging and Bioengineering, and through generous contributions from the following: Alzheimer’s Association; Alzheimer’s Drug Discovery Foundation; Araclon Biotech; BioClinica, Inc; Biogen Idec, Inc; Bristol-Myers Squibb Company; Eisai, Inc; Elan Pharmaceuticals Inc; Eli Lilly and Company; Euro-Immun; F. Hoffmann-La Roche Ltd and its affiliated company Genentech, Inc; Fujirebio; GE Healthcare; IXICO Ltd; Janssen Alzheimer Immunotherapy Research & Development, LLC; Johnson & Johnson Pharmaceutical Research & Development LLC; Medpace, Inc; Merck & Co, Inc; Meso Scale Diagnostics, LLC; NeuroRx Research; Neurotrack Technologies; Novartis Pharmaceuticals Corporation; Pfizer, Inc; Piramal Imaging; Servier; Synarc, Inc; and Takeda Pharmaceutical Company. The Canadian Institutes of Health Research is providing funds to support ADNI clinical sites in Canada. Private sector contributions are facilitated by the Foundation for the National Institutes of Health (www.fnih.org). The grantee organization is the Northern California Institute for Research and Education, and the study is coordinated by the Alzheimer’s Disease Cooperative Study at the University of California, San Diego. ADNI data are disseminated by the Laboratory for Neuro Imaging at the University of Southern California. BG is partially supported by the Biomarkers across Neurodegenerative Diseases award, by the Michael J. Fox Foundation & the Alzheimer’s Association. This work was supported in part by a consortium grant (U54 EB 020403) to the ENIGMA Center (PI: Paul Thompson), from the NIH Institutes contributing to the Big Data to Knowledge (BD2K) Initiative.
Appendix A. Supplementary data
Supplementary data related to this article can be found, in the online version, at http://dx.doi.org/10.1016/j.neurobiolaging.2015.09.018.
Footnotes
Disclosure statement
The authors have no potential financial or personal conflicts of interest including relationships with other people or organizations within 3 years of beginning the work submitted that could inappropriately influence this work.
References
- Ashburner J, Friston KJ. Human brain function. Academic Press; London, UK: 2003. Morphometry. [Google Scholar]
- Baron JC, Chetelat G, Desgranges B, Perchey G, Landeau B, de la Sayette V, Eustache F. In vivo mapping of gray matter loss with voxel-based morphometry in mild Alzheimer’s disease. Neuroimage. 2001;14:298–309. doi: 10.1006/nimg.2001.0848. [DOI] [PubMed] [Google Scholar]
- Carmichael OT, Thompson PM, Dutton RA, Lu A, Lee SE, Lee JY, Kuller LH, Lopez OL, Aizenstein HJ, Meltzer CC, Liu Y, Toga AW, Becker JT. Mapping ventricular changes related to dementia and mild cognitive impairment in a large community-based cohort. IEEE International Symposium on Biomedical Imaging. 2006:315–318. [Google Scholar]
- Chen K, Langbaum JB, Fleisher AS, Ayutyanont N, Reschke C, Lee W, Liu X, Bandy D, Alexander GE, Thompson PM, Foster NL, Harvey DJ, de Leon MJ, Koeppe RA, Jagust WJ, Weiner MW, Reiman EM, Alzheimer’s Disease Neuroimaging Initiative Twelve-month metabolic declines in probable Alzheimer’s disease and amnestic mild cognitive impairment assessed using an empirically pre-defined statistical region-of-interest: findings from the Alzheimer’s Disease Neuroimaging Initiative. Neuroimage. 2010;51:654–664. doi: 10.1016/j.neuroimage.2010.02.064. [DOI] [PMC free article] [PubMed] [Google Scholar]
- Chen K, Reiman EM, Alexander GE, Bandy D, Renaut R, Crum WR, Fox NC, Rossor MN. An automated algorithm for the computation of brain volume change from sequential MRIs using an iterative principal component analysis and its evaluation for the assessment of whole-brain atrophy rates in patients with probable Alzheimer’s disease. Neuroimage. 2004;22:134–143. doi: 10.1016/j.neuroimage.2004.01.002. [DOI] [PubMed] [Google Scholar]
- Chertkow H, Black S. Imaging biomarkers and their role in dementia clinical trials. Can J Neurol Sci. 2007;34(Suppl 1):S77–S83. doi: 10.1017/s031716710000562x. [DOI] [PubMed] [Google Scholar]
- Chetelat G, Desgranges B, De La Sayette V, Viader F, Eustache F, Baron JC. Mapping gray matter loss with voxel-based morphometry in mild cognitive impairment. Neuroreport. 2002;13:1939–1943. doi: 10.1097/00001756-200210280-00022. [DOI] [PubMed] [Google Scholar]
- Ching CR, Hua X, Hibar DP, Ward CP, Gunter JL, Bernstein MA, Jack CR, Jr, Weiner MW, Thompson PM, Alzheimer’s Disease Neuroimaging Initiative Does MRI scan acceleration affect power to track brain change? Neurobiol Aging. 2015;36(Suppl 1):S167–S177. doi: 10.1016/j.neurobiolaging.2014.05.039. [DOI] [PMC free article] [PubMed] [Google Scholar]
- Chou YY, Leporé N, Avedissian C, Madsen SK, Hua X, Jack CR, Jr, Weiner MW, Toga AW, Thompson PM. Mapping ventricular expansion and its clinical correlates in Alzheimer’s disease and mild cognitive impairment using multi-atlas fluid image alignment. SPIE Medical Imaging; February 7–12 2009; Lake Buena Vista, Florida. 2009. [Google Scholar]
- Christensen GE, Johnson HJ. Consistent image registration. IEEE Trans Med Imaging. 2001;20:568–582. doi: 10.1109/42.932742. [DOI] [PubMed] [Google Scholar]
- Chung MK, Worsley KJ, Paus T, Cherif C, Collins DL, Giedd JN, Rapoport JL, Evans AC. A unified statistical approach to deformation-based morphometry. Neuroimage. 2001;14:595–606. doi: 10.1006/nimg.2001.0862. [DOI] [PubMed] [Google Scholar]
- Collins DL, Neelin P, Peters TM, Evans AC. Automatic 3D intersubject registration of MR volumetric data in standardized Talairach space. J Comput Asst Tomogr. 1994;18:192–205. [PubMed] [Google Scholar]
- Cummings JL, Morstorf T, Zhong K. Alzheimer’s disease drug-development pipeline: few candidates, frequent failures. Alzheimer’s Res Ther. 2014;6:37. doi: 10.1186/alzrt269. [DOI] [PMC free article] [PubMed] [Google Scholar]
- Davison AC, Hinkley DV. Bootstrap methods and their application. Cambridge University Press; Cambridge, UK: 1997. [Google Scholar]
- de Jong LW, van der Hiele K, Veer IM, Houwing JJ, Westendorp RG, Bollen EL, de Bruin PW, Middelkoop HA, van Buchem MA, van der Grond J. Strongly reduced volumes of putamen and thalamus in Alzheimer’s disease: an MRI study. Brain. 2008;131(Pt 12):3277–3285. doi: 10.1093/brain/awn278. [DOI] [PMC free article] [PubMed] [Google Scholar]
- Dickerson BC, Sperling RA. Neuroimaging biomarkers for clinical trials of disease-modifying therapies in Alzheimer’s disease. NeuroRx. 2005;2:348–360. doi: 10.1602/neurorx.2.2.348. [DOI] [PMC free article] [PubMed] [Google Scholar]
- Eastman P. Plans under way for Alzheimer’s prevention trial. Neurol Today. 2012;12:1–14. [Google Scholar]
- Efron B, Tibshirani RJ. An introduction to the bootstrap. Chapman & Hall; New York: 1993. [Google Scholar]
- Fleisher AS, Donohue M, Chen K, Brewer JB, Aisen PS. Applications of neuroimaging to disease-modification trials in Alzheimer’s disease. Behav Neurol. 2009;21:129–136. doi: 10.3233/BEN-2009-0241. [DOI] [PMC free article] [PubMed] [Google Scholar]
- Fox NC, Cousens S, Scahill R, Harvey RJ, Rossor MN. Using serial registered brain magnetic resonance imaging to measure disease progression in Alzheimer disease: power calculations and estimates of sample size to detect treatment effects. Arch Neurol. 2000;57:339–344. doi: 10.1001/archneur.57.3.339. [DOI] [PubMed] [Google Scholar]
- Fox NC, Crum WR, Scahill RI, Stevens JM, Janssen JC, Rossor MN. Imaging of onset and progression of Alzheimer’s disease with voxel-compression mapping of serial magnetic resonance images. Lancet. 2001;358:201–205. doi: 10.1016/S0140-6736(01)05408-3. [DOI] [PubMed] [Google Scholar]
- Fox NC, Freeborough PA. Brain atrophy progression measured from registered serial MRI: validation and application to Alzheimer’s disease. J Magn Reson Imaging. 1997;7:1069–1075. doi: 10.1002/jmri.1880070620. [DOI] [PubMed] [Google Scholar]
- Fox NC, Ridgway GR, Schott JM. Algorithms, atrophy and Alzheimer’s disease: cautionary tales for clinical trials. Neuroimage. 2011;57:15–18. doi: 10.1016/j.neuroimage.2011.01.077. [DOI] [PubMed] [Google Scholar]
- Freeborough PA, Fox NC. The boundary shift integral: an accurate and robust measure of cerebral volume changes from registered repeat MRI. IEEE Trans Med Imaging. 1997;16:623–629. doi: 10.1109/42.640753. [DOI] [PubMed] [Google Scholar]
- Freeborough PA, Fox NC. Modeling brain deformations in Alzheimer disease by fluid registration of serial 3D MR images. J Comput Assist Tomogr. 1998;22:838–843. doi: 10.1097/00004728-199809000-00031. [DOI] [PubMed] [Google Scholar]
- Frisoni GB, Fox NC, Jack CR, Jr, Scheltens P, Thompson PM. The clinical use of structural MRI in Alzheimer disease. Nat Rev Neurol. 2010;6:1–11. doi: 10.1038/nrneurol.2009.215. [DOI] [PMC free article] [PubMed] [Google Scholar]
- Frisoni GB, Weiner MW. Alzheimer’s disease neuroimaging initiative special issue. Neurobiol Aging. 2010;31:1259–1262. doi: 10.1016/j.neurobiolaging.2010.05.006. [DOI] [PubMed] [Google Scholar]
- Gutman BA, Hua X, Rajagopalan P, Chou YY, Wang Y, Yanovsky I, Toga AW, Jack CR, Jr, Weiner MW, Thompson PM. Maximizing power to track Alzheimer’s disease and MCI progression by LDA-based weighting of longitudinal ventricular surface features. Neuroimage. 2013a;70:386–401. doi: 10.1016/j.neuroimage.2012.12.052. [DOI] [PMC free article] [PubMed] [Google Scholar]
- Gutman BA, Wang Y, Yanovsky I, Hua X, Toga AW, Jack CR, Jr, Weiner MW, Thompson PM. Empowering imaging biomarkers of Alzheimer’s disease. Neurobiol Aging. 2013b;36(Suppl 1):S69–S80. doi: 10.1016/j.neurobiolaging.2014.05.038. [DOI] [PMC free article] [PubMed] [Google Scholar]
- Hardy J, Selkoe DJ. The amyloid hypothesis of Alzheimer’s disease: progress and problems on the road to therapeutics. Science. 2002;297:353–356. doi: 10.1126/science.1072994. [DOI] [PubMed] [Google Scholar]
- Haufe S, Meinecke F, Gorgen K, Dahne S, Haynes JD, Blankertz B, Biessmann F. On the interpretation of weight vectors of linear models in multivariate neuroimaging. Neuroimage. 2014;87:96–110. doi: 10.1016/j.neuroimage.2013.10.067. [DOI] [PubMed] [Google Scholar]
- Hill DL, Schwarz AJ, Isaac M, Pani L, Vamvakas S, Hemmings R, Carrillo MC, Yu P, Sun J, Beckett L, Boccardi M, Brewer J, Brumfield M, Cantillon M, Cole PE, Fox N, Frisoni GB, Jack C, Kelleher T, Luo F, Novak G, Maguire P, Meibach R, Patterson P, Bain L, Sampaio C, Raunig D, Soares H, Suhy J, Wang H, Wolz R, Stephenson D. Coalition against Major Diseases/European Medicines Agency biomarker qualification of hippocampal volume for enrichment of clinical trials in predementia stages of Alzheimer’s disease. Alzheimers Dement. 2014;10:421 e3–429 e3. doi: 10.1016/j.jalz.2013.07.003. [DOI] [PubMed] [Google Scholar]
- Holland D, Brewer JB, Hagler DJ, Fennema-Notestine C, Dale AM. Subregional neuroanatomical change as a biomarker for Alzheimer’s disease. Proc Natl Acad Sci U S A. 2009;106:20954–20959. doi: 10.1073/pnas.0906053106. [DOI] [PMC free article] [PubMed] [Google Scholar]
- Holland D, McEvoy LK, Dale AM. Unbiased comparison of sample size estimates from longitudinal structural measures in ADNI. Hum Brain Mapp. 2012;33:2586–2602. doi: 10.1002/hbm.21386. [DOI] [PMC free article] [PubMed] [Google Scholar]
- Hua X, Hibar DP, Ching CR, Boyle CP, Rajagopalan P, Gutman BA, Leow AD, Toga AW, Jack CR, Jr, Harvey D, Weiner MW, Thompson PM. Unbiased tensor-based morphometry: improved robustness and sample size estimates for Alzheimer’s disease clinical trials. Neuroimage. 2013;66:648–661. doi: 10.1016/j.neuroimage.2012.10.086. [DOI] [PMC free article] [PubMed] [Google Scholar]
- Hua X, Hibar DP, Lee S, Toga AW, Jack CR, Jr, Weiner MW, Thompson PM, Alzheimer’s Disease Neuroimaging Initiative Sex and age differences in atrophic rates: an ADNI study with n=1368 MRI scans. Neurobiol Aging. 2010;31:1463–1480. doi: 10.1016/j.neurobiolaging.2010.04.033. [DOI] [PMC free article] [PubMed] [Google Scholar]
- Iglesias JE, Liu CY, Thompson PM, Tu Z. Robust brain extraction across datasets and comparison with publicly available methods. IEEE Trans Med Imaging. 2011;30:1617–1634. doi: 10.1109/TMI.2011.2138152. [DOI] [PubMed] [Google Scholar]
- Jack CR, Jr, Knopman DS, Jagust WJ, Petersen RC, Weiner MW, Aisen PS, Shaw LM, Vemuri P, Wiste HJ, Weigand SD, Lesnick TG, Pankratz VS, Donohue MC, Trojanowski JQ. Tracking pathophysiological processes in Alzheimer’s disease: an updated hypothetical model of dynamic biomarkers. Lancet Neurol. 2013;12:207–216. doi: 10.1016/S1474-4422(12)70291-0. [DOI] [PMC free article] [PubMed] [Google Scholar]
- Jack CR, Jr, Petersen RC, Xu Y, O’Brien PC, Smith GE, Ivnik RJ, Tangalos EG, Kokmen E. Rate of medial temporal lobe atrophy in typical aging and Alzheimer’s disease. Neurology. 1998;51:993–999. doi: 10.1212/wnl.51.4.993. [DOI] [PMC free article] [PubMed] [Google Scholar]
- Jack CR, Jr, Petersen RC, Xu YC, O’Brien PC, Smith GE, Ivnik RJ, Boeve BF, Waring SC, Tangalos EG, Kokmen E. Prediction of AD with MRI-based hippocampal volume in mild cognitive impairment. Neurology. 1999;52:1397–1403. doi: 10.1212/wnl.52.7.1397. [DOI] [PMC free article] [PubMed] [Google Scholar]
- Jack CR, Jr, Shiung MM, Gunter JL, O’Brien PC, Weigand SD, Knopman DS, Boeve BF, Ivnik RJ, Smith GE, Cha RH, Tangalos EG, Petersen RC. Comparison of different MRI brain atrophy rate measures with clinical disease progression in AD. Neurology. 2004;62:591–600. doi: 10.1212/01.wnl.0000110315.26026.ef. [DOI] [PMC free article] [PubMed] [Google Scholar]
- Jack CR, Jr, Shiung MM, Weigand SD, O’Brien PC, Gunter JL, Boeve BF, Knopman DS, Smith GE, Ivnik RJ, Tangalos EG, Petersen RC. Brain atrophy rates predict subsequent clinical conversion in normal elderly and amnestic MCI. Neurology. 2005;65:1227–1231. doi: 10.1212/01.wnl.0000180958.22678.91. [DOI] [PMC free article] [PubMed] [Google Scholar]
- Jack CR, Jr, Slomkowski M, Gracon S, Hoover TM, Felmlee JP, Stewart K, Xu Y, Shiung M, O’Brien PC, Cha R, Knopman D, Petersen RC. MRI as a biomarker of disease progression in a therapeutic trial of milameline for AD. Neurology. 2003;60:253–260. doi: 10.1212/01.wnl.0000042480.86872.03. [DOI] [PMC free article] [PubMed] [Google Scholar]
- Jack CR, Jr, Wiste HJ, Vemuri P, Weigand SD, Senjem ML, Zeng G, Bernstein MA, Gunter JL, Pankratz VS, Aisen PS, Weiner MW, Petersen RC, Shaw LM, Trojanowski JQ, Knopman DS. Brain beta-amyloid measures and magnetic resonance imaging atrophy both predict time-to-progression from mild cognitive impairment to Alzheimer’s disease. Brain. 2010;133:3336–3348. doi: 10.1093/brain/awq277. [DOI] [PMC free article] [PubMed] [Google Scholar]
- Jagust WJ, Bandy D, Chen K, Foster NL, Landau SM, Mathis CA, Price JC, Reiman EM, Skovronsky D, Koeppe RA. Alzheimer’s Disease Neuroimaging Initiative, 2010. The Alzheimer’s Disease Neuroimaging Initiative positron emission tomography core. Alzheimers Dement. 6:221–229. doi: 10.1016/j.jalz.2010.03.003. [DOI] [PMC free article] [PubMed] [Google Scholar]
- Jovicich J, Czanner S, Greve D, Haley E, van der Kouwe A, Gollub R, Kennedy D, Schmitt F, Brown G, Macfall J, Fischl B, Dale A. Reliability in multi-site structural MRI studies: effects of gradient non-linearity correction on phantom and human data. Neuroimage. 2006;30:436–443. doi: 10.1016/j.neuroimage.2005.09.046. [DOI] [PubMed] [Google Scholar]
- Leow A, Huang SC, Geng A, Becker JT, Davis S, Toga AW, Thompson PM. Inverse consistent mapping in 3D deformable image registration: its construction and statistical properties. Inf Process Med Imaging. 2005;19:493–503. doi: 10.1007/11505730_41. [DOI] [PubMed] [Google Scholar]
- Lim YY, Villemagne VL, Laws SM, Pietrzak RH, Snyder PJ, Ames D, Ellis KA, Harrington K, Rembach A, Martins RN, Rowe CC, Masters CL, Maruff P. APOE and BDNF polymorphisms moderate amyloid beta-related cognitive decline in preclinical Alzheimer’s disease. Mol Psychiatry. 2014 doi: 10.1038/mp.2014.123. [DOI] [PMC free article] [PubMed] [Google Scholar]
- Marsden J, Hughes T. Mathematical foundations of elasticity. Dover Publications; New York: 1994. [Google Scholar]
- Maruyama M, Shimada H, Suhara T, Shinotoh H, Ji B, Maeda J, Zhang MR, Trojanowski JQ, Lee VM, Ono M, Masamoto K, Takano H, Sahara N, Iwata N, Okamura N, Furumoto S, Kudo Y, Chang Q, Saido TC, Takashima A, Lewis J, Jang MK, Aoki I, Ito H, Higuchi M. Imaging of tau pathology in a tauopathy mouse model and in Alzheimer patients compared to normal controls. Neuron. 2013;79:1094–1108. doi: 10.1016/j.neuron.2013.07.037. [DOI] [PMC free article] [PubMed] [Google Scholar]
- Mazziotta J, Toga A, Evans A, Fox P, Lancaster J, Zilles K, Woods R, Paus T, Simpson G, Pike B, Holmes C, Collins L, Thompson P, MacDonald D, Iacoboni M, Schormann T, Amunts K, Palomero-Gallagher N, Geyer S, Parsons L, Narr K, Kabani N, Le Goualher G, Boomsma D, Cannon T, Kawashima R, Mazoyer B. A probabilistic atlas and reference system for the human brain: International Consortium for Brain Mapping (ICBM) Philos Trans R Soc Lond B Biol Sci. 2001;356:1293–1322. doi: 10.1098/rstb.2001.0915. [DOI] [PMC free article] [PubMed] [Google Scholar]
- Mormino EC, Betensky RA, Hedden T, Schultz AP, Ward A, Huijbers W, Rentz DM, Johnson KA, Sperling RA, Alzheimer’s Disease Neuroimaging, Initiative Australian Imaging, Biomarkers and Lifestyle Flagship Study of Ageing, Harvard Aging Brain Study Amyloid and APOE epsilon4 interact to influence short-term decline in preclinical Alzheimer disease. Neurology. 2014;82:1760–1767. doi: 10.1212/WNL.0000000000000431. [DOI] [PMC free article] [PubMed] [Google Scholar]
- Morra JH, Tu Z, Apostolova LG, Green AE, Avedissian C, Madsen SK, Parikshak N, Toga AW, Jack CR, Jr, Schuff N, Weiner MW, Thompson PM. Automated mapping of hippocampal atrophy in 1-year repeat MRI data from 490 subjects with Alzheimer’s disease, mild cognitive impairment, and elderly controls. Neuroimage. 2009;45(1 Suppl):S3–S15. doi: 10.1016/j.neuroimage.2008.10.043. [DOI] [PMC free article] [PubMed] [Google Scholar]
- Reuter M, Schmansky NJ, Rosas HD, Fischl B. Within-subject template estimation for unbiased longitudinal image analysis. Neuroimage. 2012;61:1402–1418. doi: 10.1016/j.neuroimage.2012.02.084. [DOI] [PMC free article] [PubMed] [Google Scholar]
- Riddle WR, Li R, Fitzpatrick JM, DonLevy SC, Dawant BM, Price RR. Characterizing changes in MR images with color-coded Jacobians. Magn Reson Imaging. 2004;22:769–777. doi: 10.1016/j.mri.2004.01.078. [DOI] [PubMed] [Google Scholar]
- Roses AD. Apolipoprotein E alleles as risk factors in Alzheimer’s disease. Annu Rev Med. 1996;47:387–400. doi: 10.1146/annurev.med.47.1.387. [DOI] [PubMed] [Google Scholar]
- Roses AD, Saunders AM. APOE is a major susceptibility gene for Alzheimer’s disease. Curr Opin Biotechnol. 1994;5:663–667. doi: 10.1016/0958-1669(94)90091-4. [DOI] [PubMed] [Google Scholar]
- Rosner B. Fundamentals of biostatistics. PWS-Kent Publishing Company; Boston, MA: 1990. [Google Scholar]
- Ross J, Thompson PM, Tariot P, Reiman EM, Schneider L, Frigerio E, Fiorentini F, Giardino L, Calzà L, Norris D, Cicirello H, Casula D, Imbimbo BP. Primary and secondary prevention trials in subjects at risk of developing Alzheimer’s disease: the GEPARD-AD (genetically enriched population at risk of developing Alzheimer’s disease) studies. CTAD Conference; Monte Carlo, Monaco. 2012. [Google Scholar]
- Ryan NS, Keihaninejad S, Shakespeare TJ, Lehmann M, Crutch SJ, Malone IB, Thornton JS, Mancini L, Hyare H, Yousry T, Ridgway GR, Zhang H, Modat M, Alexander DC, Rossor MN, Ourselin S, Fox NC. Magnetic resonance imaging evidence for presymptomatic change in thalamus and caudate in familial Alzheimer’s disease. Brain. 2013;136(Pt 5):1399–1414. doi: 10.1093/brain/awt065. [DOI] [PMC free article] [PubMed] [Google Scholar]
- Salloway S, Sperling R, Fox NC, Blennow K, Klunk W, Raskind M, Sabbagh M, Honig LS, Porsteinsson AP, Ferris S, Reichert M, Ketter N, Nejadnik B, Guenzler V, Miloslavsky M, Wang D, Lu Y, Lull J, Tudor IC, Liu E, Grundman M, Yuen E, Black R, Brashear HR, Bapineuzumab Clinical Trial Investigators Two phase 3 trials of bapineuzumab in mild-to-moderate Alzheimer’s disease. New Engl J Med. 2014;370:322–333. doi: 10.1056/NEJMoa1304839. [DOI] [PMC free article] [PubMed] [Google Scholar]
- Saunders AM, Schmader K, Breitner JC, Benson MD, Brown WT, Goldfarb L, Goldgaber D, Manwaring MG, Szymanski MH, McCown N, Dole KC, Schmechel DE, Strittmatter WJ, Pericak-Vance MA, Roses AD. Apolipoprotein E epsilon 4 allele distributions in late-onset Alzheimer’s disease and in other amyloid-forming diseases. Lancet. 1993;342:710–711. doi: 10.1016/0140-6736(93)91709-u. [DOI] [PubMed] [Google Scholar]
- Schuff N, Woerner N, Boreta L, Kornfield T, Shaw LM, Trojanowski JQ, Thompson PM, Jack CR, Jr, Weiner MW. MRI of hippocampal volume loss in early Alzheimer’s disease in relation to ApoE genotype and biomarkers. Brain. 2009;132:1067–1077. doi: 10.1093/brain/awp007. [DOI] [PMC free article] [PubMed] [Google Scholar]
- Sled JG, Zijdenbos AP, Evans AC. A nonparametric method for automatic correction of intensity nonuniformity in MRI data. IEEE Trans Med Imaging. 1998;17:87–97. doi: 10.1109/42.668698. [DOI] [PubMed] [Google Scholar]
- Thompson PM, Giedd JN, Woods RP, MacDonald D, Evans AC, Toga AW. Growth patterns in the developing brain detected by using continuum mechanical tensor maps. Nature. 2000;404:190–193. doi: 10.1038/35004593. [DOI] [PubMed] [Google Scholar]
- Thompson PM, Hayashi KM, De Zubicaray GI, Janke AL, Rose SE, Semple J, Hong MS, Herman DH, Gravano D, Doddrell DM, Toga AW. Mapping hippocampal and ventricular change in Alzheimer disease. Neuroimage. 2004;22:1754–1766. doi: 10.1016/j.neuroimage.2004.03.040. [DOI] [PubMed] [Google Scholar]
- Toga AW. Brain Warping. First. Academic Press; San Diego, CA: 1999. [Google Scholar]
- Vemuri P, Senjem ML, Gunter JL, Lundt ES, Tosakulwong N, Weigand SD, Borowski BJ, Bernstein MA, Zuk SM, Lowe VJ, Knopman DS, Petersen RC, Fox NC, Thompson PM, Weiner MW, Jack CR, Jr, Alzheimer’s Disease Neuroimaging Initiative Accelerated vs. unaccelerated serial MRI based TBM-SyN measurements for clinical trials in Alzheimer’s disease. Neuroimage. 2015;113:61–69. doi: 10.1016/j.neuroimage.2015.03.026. [DOI] [PMC free article] [PubMed] [Google Scholar]
- Villemagne VL, Furumoto S, Fodero-Tavoletti MT, Mulligan RS, Hodges J, Harada R, Yates P, Piguet O, Pejoska S, Dore V, Yanai K, Masters CL, Kudo Y, Rowe CC, Okamura N. In vivo evaluation of a novel tau imaging tracer for Alzheimer’s disease. Eur J Nucl Med Mol Imaging. 2014;41:816–826. doi: 10.1007/s00259-013-2681-7. [DOI] [PubMed] [Google Scholar]
- Weiner MW, Aisen PS, Jack CR, Jr, Jagust WJ, Trojanowski JQ, Shaw L, Saykin AJ, Morris JC, Cairns N, Beckett LA, Toga A, Green R, Walter S, Soares H, Snyder P, Siemers E, Potter W, Cole PE, Schmidt M. The Alzheimer’s disease neuroimaging initiative: progress report and future plans. Alzheimers Dement. 2010;6:202 e7–211 e7. doi: 10.1016/j.jalz.2010.03.007. [DOI] [PMC free article] [PubMed] [Google Scholar]
- Weiner MW, Veitch DP, Aisen PS, Beckett LA, Cairns NJ, Cedarbaum J, Donohue MC, Green RC, Harvey D, Jack CR, Jr, Jagust W, Morris JC, Petersen RC, Saykin AJ, Shaw L, Thompson PM, Toga AW, Trojanowski JQ, Alzheimer’s Disease Neuroimaging Initiative Impact of the Alzheimer’s disease neuroimaging initiative, 2004–2014. Alzheimers Dement. 2015;11:865–884. doi: 10.1016/j.jalz.2015.04.005. [DOI] [PMC free article] [PubMed] [Google Scholar]
- Weiner MW, Veitch DP, Aisen PS, Beckett LA, Cairns NJ, Green RC, Harvey D, Jack CR, Jagust W, Liu E, Morris JC, Petersen RC, Saykin AJ, Schmidt ME, Shaw L, Siuciak JA, Soares H, Toga AW, Trojanowski JQ. The Alzheimer’s Disease Neuroimaging Initiative: a review of papers published since its inception. Alzheimers Dement. 2012;8(1 Suppl):S1–S68. doi: 10.1016/j.jalz.2011.09.172. [DOI] [PMC free article] [PubMed] [Google Scholar]
- Yushkevich PA, Avants BB, Das SR, Pluta J, Altinay M, Craige C. Bias in estimation of hippocampal atrophy using deformation-based morphometry arises from asymmetric global normalization: an illustration in ADNI 3 T MRI data. Neuroimage. 2010;50:434–445. doi: 10.1016/j.neuroimage.2009.12.007. [DOI] [PMC free article] [PubMed] [Google Scholar]
Associated Data
This section collects any data citations, data availability statements, or supplementary materials included in this article.