

Abstract
We demonstrate a generalizable strategy to use the relative trajectories of pairs and groups of nanocrystals, and potentially other nanoscale objects, moving in solution which can now be obtained by in situ liquid phase transmission electron microscopy (TEM) to determine the interaction potentials between nanocrystals. Such nanoscale interactions are crucial for collective behaviors and applications of synthetic nanocrystals and natural biomolecules, but have been very challenging to measure in situ at nanometer or sub-nanometer resolution. Here we use liquid phase TEM to extract the mathematical form of interaction potential between nanocrystals from their sampled trajectories. We show the power of this approach to reveal unanticipated features of nanocrystal–nanocrystal interactions by examining the anisotropic interaction potential between charged rod-shaped Au nanocrystals (Au nanorods); these Au nanorods assemble, in a tip-to-tip fashion in the liquid phase, in contrast to the well-known side-by-side arrangements commonly observed for drying-mediated assembly. These observations can be explained by a long-range and highly anisotropic electrostatic repulsion that leads to the tip-selective attachment. As a result, Au nanorods stay unassembled at a lower ionic strength, as the electrostatic repulsion is even longer-ranged. Our study not only provides a mechanistic understanding of the process by which metallic nanocrystals assemble but also demonstrates a method that can potentially quantify and elucidate a broad range of nanoscale interactions relevant to nanotechnology and biophysics.
Short abstract
We apply liquid-phase TEM to elucidate nanoparticle interactions with an approach that could be applied to a broad range of nanoscale materials from colloidal metallic nanoparticles to biomolecules.
Introduction
How nanoscale objects interact and communicate in the solution phase is a critical underlying issue for both biological1−4 and artificial systems.5−8 Inside a living cell, small biomolecules often self-assemble into supercomplexes with essential functions, such as channel formation2,3 and protein cooperativity,1,4 through various forms of noncovalent interactions. Similarly, colloidal nanocrystals have been spatially arranged into larger assemblies, in order to take advantage of collective effects in optics,9−14 electronics,15−17 catalysis,18,19 etc. For both classes of systems, computational efforts20−26 have taken the lead to model and understand the interactions essential to solution phase assembly processes at nanometer or sub-nanometer resolution. One commonly adopted strategy to measure the interaction potential between larger, micrometer-sized colloidal particles is to directly image the colloidal dynamics in solution using optical microscopy.27−29 This strategy, however, has not been extended to the study of nanoscale interactions due to the nanometer resolution required for direct imaging. For nanoscale objects, the relevant interactions are usually effective within the range of nanometers to hundreds of nanometers. For any technique of this type to be broadly useful, it should be able to correlate interaction potentials with the shape or surface chemistry of nanoscale building blocks. Until recently, conventional electron microscopy techniques that offer nanometer scale resolution required high vacuum and thus were considered to be incompatible with solution phase dynamics. The multiple recent demonstrations of in situ observations of a wide range of nanoscale dynamic processes using liquid phase TEM30−39 open up the possibility of determining full anisotropic pairwise and higher order interparticle potentials for nanoscale objects at high resolution by trajectory tracking. Here we demonstrate this for the case of Au nanorods.
Au nanorods are an important system for which the determination of the anisotropic interaction potentials will be of great use.40,41 Individual Au nanorods can concentrate incident electromagnetic fields due to their strong and tunable uniaxial plasmon resonances, making them a useful probe for biological imaging with dark field microscopy and a strong candidate for photothermal cancer therapies.42,43 When placed in close proximity to each other, Au nanorod plasmon resonances couple to each other strongly, producing a broader class of plasmonic molecules with spectra that can be designed with precision, leading even to three-dimensional plasmon rulers, electromagnetically induced transparency, and many other collective phenomena.9,44,45 The ability to understand and control the assembly of these nanocrystals hinges on knowing the anisotropic interaction potential, and this potential in turn depends very strongly on the condition of the liquid environment. The ability to visualize elementary assembly processes under different conditions of the solution such as salt concentration will be of immediate use in the creation and testing of models and theories for nanocrystal assembly.
Here we show that it is possible to use liquid phase TEM to visualize and track each pairwise interaction between nanocrystals within a field of view over time, and to use this information to extract the anisotropic interaction potential as a function of critical parameters like the ionic strength. While the focus of previous liquid phase TEM work has been either on resolving the finest possible structural details of nanoscale objects31−34 or on a phenomenological observation of their dynamics,35−39 we utilize the massive but often missed nanocrystal position data to obtain an unprecedentedly quantitative understanding of the factors governing nanocrystal assembly. Such governing factors were hidden beneath the apparent solution parameters such as ionic species, pH, and choice of ligands, which led to sometimes controversial claims in nanocrystal assembly. For example, an ionic-strength interaction potential that we observe here can be used to account for two earlier and seemingly contradictory in situ studies38,39 of Au nanosphere assembly in which distinctly different assembly patterns had been observed.
Results and Discussion
We used Au nanorods synthesized from seed-mediated growth,46 without further postsynthetic surface modifications (see Supporting Information, Materials and Methods section). These rods are our model system to study the more generic shape effect on interaction profiles, which can be readily applicable to other anisotropically shaped colloidal nanocrystals and nanoscale objects. Au nanorods can be synthesized with high shape purity and size uniformity, which facilitates obtaining a statistically significant data set. Their high electron density enables the acquisition of high contrast TEM images for our image analysis.
An aqueous solution of well-dispersed Au nanorods was flowed into a liquid chamber with Si3N4 windows for in situ TEM imaging of their collective motions in solution (see Figure S1 in the Supporting Information). Au nanorods move in a quasi-two-dimensional plane close to the Si3N4 window, to which they are slightly attracted, where our focal plane is. This nanorod–window attraction is weak since we still observe the dynamic adsorption and desorption of nanorods coming to and leaving the focal plane. When the concentration of Au nanorods is too low for them to interact with each other, they move randomly within the field of view following the features of Brownian motion (see Figure S2 in the Supporting Information), which means we can ignore the contribution of nanorod–window interaction to the energetics of their collective motions. But when Au nanorods are concentrated enough to cross talk, individual Au nanorods start to self-assemble, under electron beam illumination (as shown in Movies S1 and S2 in the Supporting Information and Figure 1). Note that the Au nanorod solution is confirmed to be colloidally stable ex situ, and the in situ self-assembly region is highly localized. When the electron beam is shifted to a new region, we see individual and well-separated nanorods at the beginning, and then they are triggered to assemble after seconds of illumination under the electron beam. This electron beam induced self-assembly is robust, occurring within a flux range of 17.3 to 67.1 electrons/(Å2·s) under 200 kV accelerating voltage: our full observation window of electron flux. Our later quantification of the governing interactions will elucidate what to us at least was an unanticipated mechanism of how the electron beam initiates self-assembly. This understanding allows us to reproduce the ex situ condition of unassembled Au nanorods by counteracting the relevant electron beam effect during the in situ observation.
Figure 1.

In situ liquid phase TEM imaging of tip-to-tip assembly of Au nanorods. (A) The liquid flow TEM setup, with Si3N4 windowed microchips. Well-dispersed Au nanorods self-assemble under the illumination of electron beam. (B) Representative TEM image (left) and schematics (right) showing the final assembled structures. (C) A time series of TEM images showing how nanorods approach and attach to each other. Red arrows highlight the trajectories of nanorods before they attach to the cluster of growing rod assemblies. Scale bar is 100 nm.
We saw an interesting long-range effect when we looked closely into the detailed steps of self-assembly. As shown in Movie S1 in the Supporting Information, a pair of approaching nanorods first become aligned in their relative orientations from a distance before they physically touch, suggesting the presence of long-range interactions that favor certain orientations. This reorientation process is distinct from the conventional diffusion/reaction limited aggregation mechanisms39,47 which involve solely short-range interactions. After Au nanorods reorient, they attach, at most times irreversibly, in a tip-to-tip fashion. The TEM images in Figure 1C highlight the free nanorods being added to the growing cluster of rods, stepwise with their orientations not perfectly aligned at the beginning but fine-tuned later with the protruding rods within the cluster to achieve tip-to-tip attachments. Such tip-to-tip attachments represent 81% of the 610 inter-rod connections (see exemplary TEM images in Figure S3 in the Supporting Information) we analyzed in the final assembled structures, which was remarkable since the Au nanorods do not have known tip-specific chemical functionalities. In fact, the same rods pack densely side by side when they undergo drying-mediated assembly (see Figure S1A in the Supporting Information). This is our qualitative observation of the nanorod assembly in solution.
Our first quantitative analysis is to map out the many different ways one rod approaches the other, which shows a “depleted” zone overlaid with the reference rod shape. The underlying statistical mechanical argument of this analysis is simple: rods follow the more probabilistic path, i.e., instantaneous relative positions, toward each other that corresponds to the lowest free energy. In practice, we first track the end positions for a pair of nanorods in the same TEM image (see Figure 2A). We arbitrarily choose one rod as the reference rod and put it vertically at the origin, and then reposition the other accordingly such that their relative alignments remain unchanged. This repositioned second rod is simplified as one blue line as shown in Figures 2A and 2B.
Figure 2.

Spatial mapping of pairwise interaction potentials from in situ dynamics of Au nanorods. (A) A TEM image highlighted with tracked positions of Au nanorods at their tips (red and green stars), and their centroids (yellow stars). In this pair, the bottom rod was chosen to be the reference rod, and the top rod was simplified as a blue line and chosen to be the repositioned rod. (B) rod density plot, where the blue lines are the observed positions of other rods relative to the vertical reference rod (yellow rod drawn to scale). The data was obtained from ∼10000 pairs of rods, but for simplicity, only 1/8 randomly chosen data was plotted in this figure. (C) The color-coded counts of total number of rods in the 2D plane of 5 nm by 5 nm pixels. Color bar shows the counts. (D) g(r) vs r plot. (E) u(r) vs r plot with its exponential fitting (red line). The inset shows the exponential decay relation of u(r) by illustrating the resultant linear relationship of ln(u(r)) vs r.
This automatic pairwise position sampling (see Movie S3 in the Supporting Information) allows us to accumulate ∼10,000 pairs of nanorod interactions, and to generate a map of all the observed rod positions and orientations relative to a vertically oriented reference rod at the origin (Figure 2B). There is a zone at the origin where other rods are “depleted” or “repelled” from the reference rod. We determined the shape of this “depleted” zone by calculating and plotting the total number of rods falling in each 5 nm by 5 nm pixel around the reference rod (Figure 2C). The zone periphery has a “dipolar field” shape and touches the tips of the central reference rod, but stays away from its side; this anisotropic depletion zone is consistent with the observation that approaching rods become oriented with respect to each other before they attach tip-to-tip, while they do not attach side by side.
In addition to the qualitative matching of the shape of the “depleted” zone to the observed tip-to-tip assembly, we quantitatively determined the radial distribution function to extract the mathematical form of the interactions responsible for how rods approach each other. The radial distribution function, g(r), can relate our experimentally measured rod densities to inter-rod pairwise interactions. We only use one spatial parameter r, the radial distance of a given pixel to the origin, to describe g(r) since the rod density plots (Figures 2B and 2C) are both radially symmetric to a good approximation (see Figure S4 in the Supporting Information). But the same relation can also work if the density plot is radially dependent; one can simply add orientation as an additional parameter. We plotted g(r) vs r as shown in Figure 2D using the definition g(r) = ρ(r)/ρav, where ρ(r) is the areal density of rods within the circular ring confined by r and r + δr and ρav is the average areal density of rods within a circular area of 250 nm in radius. In this particular experiment, the nanorod concentration is considered to be low enough to assume that the nanorods only interact in a pairwise manner; g(r) is thus directly related to the pairwise interaction u(r) via the relationship g(r) = e–u(r)/(kBT), where kB is the Boltzmann constant and T is the temperature. When the nanorod concentration is too high, a nanorod situated at r experiences the interaction not only with the reference rod at the origin but also with other neighbors. These multibody interactions increases with particle concentration since there are more neighbors to interact with. In this case, g(r) is related to the interparticle potential via a more complicated relation: g(r) = exp[−u(r)/(kT)]y(r), where y(r) = 1 + ∑n = 1∞ρnyn(r), the cavity distribution function. In other words, one can still extract u(r) from iterative fitting of g(r) considering higher order contribution from pairwise interactions as long as such “many-body” interactions stay as a summation of many pairwise interactions.
As shown in Figure 2E, at short distances, u(r) starts from positive values corresponding to repulsive interactions, which is consistent with the existence of the central “depleted” zone. Then u(r) slowly decays to zero at larger r, which confirms that our data set is indeed statistically significant since we expect rods to not interact when they are far away from each other. Fitting of the u(r) vs r curve shows that u(r) decays exponentially with r, the decay constant being (16.0 ± 0.7) nm (see Figure 2E).
This exponential decay profile, obtained for the first time from in situ observation of nanoscale dynamics, is reminiscent48 of screened electrostatic repulsion between cylindrical surfaces coated with small charges, where the decay length is effectively the Debye length. Indeed, our as synthesized Au nanorods are stabilized and coated with a bilayer of cetyltrimethylammonium ions (CTA+), which renders them positively charged. The electrostatic nature of repulsion can explain why the otherwise well-dispersed Au nanorods self-assembled only upon electron beam illumination: the radiolysis of water under the electron beam generates additional reactive species, including hydrated electrons,49 which increases the ionic strength in the solution and shortens the screening length. This decrease in Debye length allows the rods to come into closer proximity where shorter range interactions can take over and bring the rods fully into contact. Such an effect is consistent with previous ex situ studies,39 where the zeta potential of a charged gold nanosphere solution is found to decrease upon electron beam irradiation with a Van de Graaff accelerator, and the authors also attributed such a decrease of zeta potential to increased ionic strength from radiolysis of water.
This connection prompted us to make a direct comparison between our experimental data and theoretical modeling of electrostatic interactions, and they turn out to be in good agreement with each other. Experimentally, we plot out the positions and orientations of all the rods after attachment, including both tip-to-tip attachments and non tip-to-tip attachments to give an overview of the energetics of rod attachment configurations (Figure 3A). The density plot of these attached rods shows a clear preference for rods to align parallel with each other, as shown in Figure 3B. In the corresponding theoretical modeling, we coat the rod surface with a large number of point charges50,51 and obtain the electrostatic repulsion of two rods at any given configuration by summing all screened pairwise interactions between point charges. Note that this way of modeling electrostatic interaction is highly coarse-grained. We neglected possible interactions between neighboring point charges, and the molecular details of how solvant molecules hydrated these point charges. Moreover, we assume a homogeneous charge density over the rod surface, while previous studies have shown that due to difference of ligand binding energy to difference facets, the ligand/charge density at the rod ends is smaller than on the sides. A more vigorous model that addresses the above details will give a more description of the electrostatic potential between two rods. Still our simple modeling here captures the key feature of shape anisotropy, and helps us understand the qualitative trend of favored tip-to-tip assembly. This model is based on the 2D projection of rods since in experiments rods move and assemble in a 2D plane.
Figure 3.
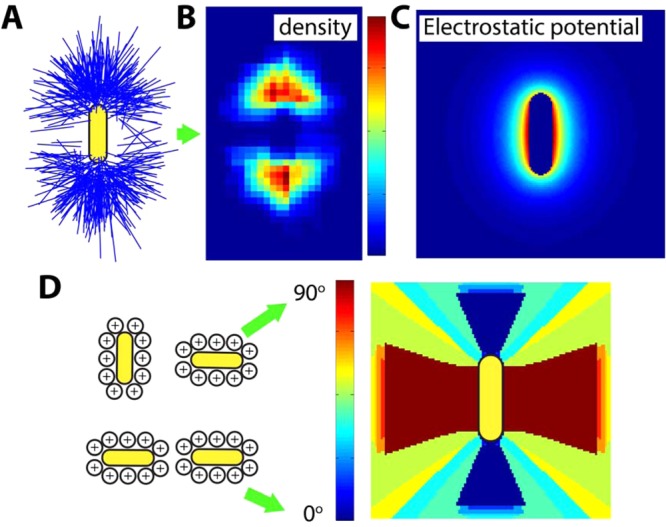
Comparison of experimental data and theoretical modeling of electrostatic interactions. (A) The rod position plot from ∼300 rod–rod attachments. The symbol and color scheme are based on what is shown in Figure 2B. (B) The observed density of rods in the attached configuration where the reference rod is also sitting vertically at the center. It is clear that the rods have a preference to align roughly parallel with each other (see the dark red pixels). (C) Energy contour plot showing calculated lowest potential for a pair of nanorods, where one rod stays vertically at the center and the other samples all the possible rod orientations at each pixel. The potential at each pixel is color-coded: red for larger values and blue for smaller values. At the rod side position, the potential energy is ∼2 times higher than at the rod tip. (D) Calculated orientation of rods for the lowest energy at each pixel, with blue color meaning parallel and red color meaning perpendicular as shown in the schematics on the left.
Figure 3C shows the energy contour plot corresponding to rod configurations that minimize the electrostatic repulsion for a given pixel position. The electrostatic repulsion around the reference rod is much weaker at the tips than at the sides, which is consistent with the observed tip selectivity. The contour shape of calculated equal potentials around the reference rod is ellipsoidal at a distance (<10 nm) from the rod surface that is smaller than what we can conveniently resolve. The shape becomes very circular further from the reference rod surface, just like the depleted zone periphery experimentally observed as shown in Figure 2C. Figure 3D, on the other hand, maps out the rod orientations with the lowest energy. Rods are more likely to align parallel toward each other at the rod tip, consistent with the experimentally measured Figure 3B, which further corroborates the electrostatic nature of repulsion.
The preceding analysis allows us to propose a mechanism by which rods assemble tip-to-tip: individual Au nanorods first randomly move, enveloped by a repulsive “cloud” of a radius that depends on the ionic strength of the solution. They can only come close to each other when their repulsive clouds experience the least overlap, i.e., the smallest repulsion, which occurs specifically when they approach tip-to-tip. When r is sufficiently small, short-range attractions, which are mainly contributed from the van der Waals interactions,52 take over and permanently lock the rods into oriented assemblies. We did not see the features of this short-range attractive component in the interaction potential we experimentally obtained, most likely because we did not have enough temporal resolution to accumulate significant statistics for very small inter-rod distances. In the movies it appears as though the rods “snap together” at the last instant because the temporal resolution is low. The fact that we missed the short-range attractive interaction feature, together with the anisotropy of rod–rod electrostatic interaction, are the reasons why we chose not to fit our experimental data with DLVO theory, instead we used theoretical modeling that accounts for the shape details of nanorods for direct comparison.
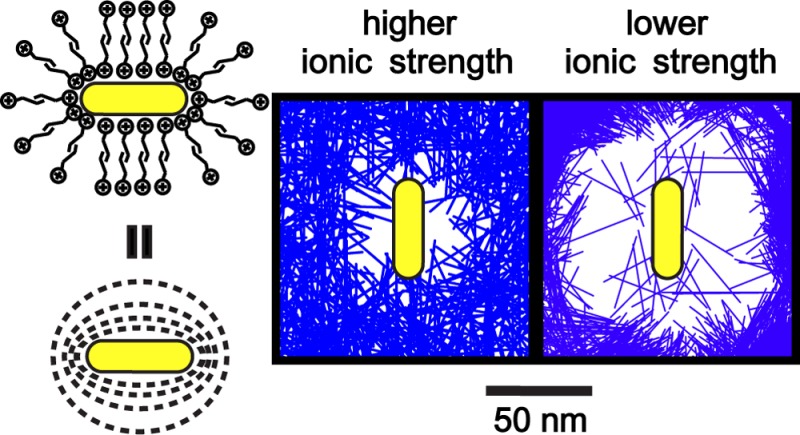
As we now understand the interactions governing assembly, we are able to counteract the electron beam effect and correlate our in situ experiments with ex situ conditions. We decreased the ionic strength of the Au nanorod solution through centrifugation followed by redispersion in hexadecyltrimethylammonium chloride solution (see Supporting Information, Materials and Methods section) and investigated the nanocrystal dynamics under the electron beam. This time, Au nanorods stayed apart and did not assemble under the electron beam, just as one would expect from a less screened electrostatic repulsion. The plot of experimentally measured rod positions in Figure 4A shows that the size of the “depleted” zone increased significantly: Au nanorods were surrounded by large repulsive clouds, as indicated by yellow dotted circles in Figure 4B, preventing them from encountering each other at the close distances needed for assembly, as shown by their trajectories in Figure 4C, and Movie S4 in the Supporting Information. This observation provides further proof of the dominant role of electrostatic repulsion. More importantly, the interactions of the electron beam with the sample and the liquid medium have mostly been regarded as being undesirably complicated. By understanding the nature of nanoscale interactions involved, we are able to show how we can circumvent the electron beam effects to retrieve ex situ conditions under in situ electron beam irradiation. In other words, using our highly quantitative measurement and interpretation, our knowledge learned from in situ liquid phase TEM observations can be transferred to understand ex situ experiments, which, for this specific case, is correlated via adjustment of the ionic strength.
Figure 4.

Suppression of Au nanorod assembly at low ionic strength. (A) Plot of different rod configurations (each rod as a purple line) relative to the central reference rod. The yellow dashed circle indicates the depleted zone. (B) TEM image of electrostatically stabilized Au nanorods overlaid with yellow dotted depleted zone. (C) Trajectories of all eight rods in panel B. Scale bar is 50 nm.
Our work has demonstrated the use of liquid cell TEM as a tool to quantitatively examine the fundamental interactions that govern how anisotropic colloidal nanocrystals interact with each other in their native liquid environment without a priori knowledge of the interactions involved. We have learned that the ionic strength is a key parameter that will determine whether nanorods assemble end to end or side by side, and that this arises because at certain ionic strengths the nanorod repulsion is minimized when the rods are oriented tip to tip, while at higher ionic strength, nanorods are sufficiently screened and effectively “uncharged” and only experience short-range attractions and form into random aggregates (Figure S4 in the Supporting Information). We note that while the observation of ionic strength dependence and screening length is consistent with simple models, studies of the assembly process at high ionic strength are still valuable for testing models of concentrated electrolytes which are still quite difficult to understand. We see the real power of the in situ pairwise and higher order trajectory sampling method being its generalized ability to correlate spatially the interaction potential profile with the shape/surface chemistry of other nanoscale systems involving more intricate yet crucial nanoscale interactions, such as the hydrophobic interactions among chemically patchy protein molecules.53
Acknowledgments
We thank Dr. Milo Lin and Dr. Matthew R. Jones at UC Berkeley for useful discussions, and Yingjie Zhang for useful discussions and taking ex situ scanning electron microscope (SEM) images of Au nanorods. Research supported in this publication was supported in part by the Defense Threat Reduction Agency (DTRA) under Award HDTRA1-13-1-0035, which provided for development of liquid cell TEM imaging methods; and by a grant from King Abdulaziz City for Science and Technology (KACST), Kingdom of Saudi Arabia, which provided for nanoparticle synthesis and characterization. Q.C. was supported by a Miller fellowship from Miller Institute for Basic Research in Science at UC Berkeley.
Supporting Information Available
Experimental details; figures depicting characterization of as-synthesized Au nanorods, Brownian motions of individual Au nanorods, analysis of end-to-end selectivity of assembled rods, radial symmetry of 2D density plot for assembled rods, and random aggregation of Au nanorods at a higher ionic strength than the condition used in Figure 1; four movies demonstrating rod behavior. This material is available free of charge via the Internet at http://pubs.acs.org.
Author Contributions
# Q.C. and H.C. contributed equally to the work.
The authors declare no competing financial interest.
Supplementary Material
References
- Knowles T. P. J.; Vendruscolo M.; Dobson C. M. The amyloid state and its association with protein misfolding diseases. Nat. Rev. Mol. Cell Biol. 2014, 15, 384–396. [DOI] [PubMed] [Google Scholar]
- Adamcik J.; Jung J.-M.; Flakowski J.; De Los Rios P.; Dietler G.; Mezzenga R. Understanding amyloid aggregation by statistical analysis of atomic force microscopy images. Nat. Nanotechnol. 2010, 5, 423–428. [DOI] [PubMed] [Google Scholar]
- Prasad B. V. V; Hardy M. E.; Dokland T.; Bella J.; Rossmann M. G.; Estes M. K. X-ray Crystallographic Structure of the Norwalk Virus Capsid. Science 1999, 286, 287–290. [DOI] [PubMed] [Google Scholar]
- Berg B. v. d.; Clemons W. M.; Collinson I.; Modis Y.; Hartmann E.; Harrison S. C.; Rapoport T. A. X-ray structure of a protein-conducting channel. Nature 2004, 427, 36–44. [DOI] [PubMed] [Google Scholar]
- Whitesides G. M.; Grzybowski B. Self-assembly at all scales. Science 2002, 295, 2418–2421. [DOI] [PubMed] [Google Scholar]
- Bishop K. J. M.; Wilmer C. E.; Soh S.; Grzybowski B. A. Nanoscale forces and their uses in self-assembly. Small 2009, 5, 1600–1630. [DOI] [PubMed] [Google Scholar]
- Min Y.; Akbulut M.; Kristiansen K.; Golan Y.; Israelachvili J. The role of interparticle and external forces in nanoparticle assembly. Nat. Mater. 2008, 7, 527–538. [DOI] [PubMed] [Google Scholar]
- French R.; Parsegian V.; Podgornik R.; Rajter R.; Jagota A.; Luo J.; Asthagiri D.; Chaudhury M.; Chiang Y.-m.; Granick S.; Kalinin S.; Kardar M.; Kjellander R.; Langreth D.; Lewis J.; Lustig S.; Wesolowski D.; Wettlaufer J.; Ching W.-Y.; Finnis M.; Houlihan F.; von Lilienfeld O.; van Oss C.; Zemb T. Long range interactions in nanoscale science. Rev. Mod. Phys. 2010, 82, 1887–1944. [Google Scholar]
- Sonnichsen C.; Reinhard B. M.; Liphardt J.; Alivisatos A. P. A molecular ruler based on plasmon coupling of single gold and silver nanoparticles. Nat. Biotechnol. 2005, 23, 741–745. [DOI] [PubMed] [Google Scholar]
- Tao A.; Sinsermsuksakul P.; Yang P. Tunable plasmonic lattices of silver nanocrystals. Nat. Nanotechnol. 2007, 2, 435–440. [DOI] [PubMed] [Google Scholar]
- Fan J. A.; Wu C.; Bao K.; Bao J.; Bardhan R.; Halas N. J.; Manoharan V. N.; Nordlander P.; Shvets G.; Capasso F. Self-assembled plasmonic nanoparticle clusters. Science 2010, 328, 1135–1138. [DOI] [PubMed] [Google Scholar]
- Ye X.; Chen J.; Diroll B. T.; Murray C. B. Tunable plasmonic coupling in self-assembled binary nanocrystal superlattices studied by correlated optical microspectrophotometry and electron microscopy. Nano Lett. 2013, 13, 1291–1297. [DOI] [PubMed] [Google Scholar]
- Young K. L.; Ross M. B.; Blaber M. G.; Rycenga M.; Jones M. R.; Zhang C.; Senesi A. J.; Lee B.; Schatz G. C.; Mirkin C. A. Using DNA to design plasmonic metamaterials with tunable optical properties. Adv. Mater. 2014, 26, 653–659. [DOI] [PubMed] [Google Scholar]
- Hentschel M.; Saliba M.; Vogelgesang R.; Giessen H.; Alivisatos A. P.; Liu N. Transition from isolated to collective modes in plasmonic oligomers. Nano Lett. 2010, 10, 2721–2726. [DOI] [PubMed] [Google Scholar]
- Huynh W. U.; Dittmer J. J.; Alivisatos A. P. Hybrid nanorod-polymer solar cells. Science 2002, 295, 2425–2427. [DOI] [PubMed] [Google Scholar]
- Talapin D. V.; Murray C. B. PbSe nanocrystal solids for n- and p-channel thin film field-effect transistors. Science 2005, 310, 86–89. [DOI] [PubMed] [Google Scholar]
- Talapin D. V.; Lee J.-S.; Kovalenko M. V.; Shevchenko E. V. Prospects of colloidal nanocrystals for electronic and optoelectronic applications. Chem. Rev. 2009, 110, 389–458. [DOI] [PubMed] [Google Scholar]
- Yamada Y.; Tsung C.-K.; Huang W.; Huo Z.; Habas S. E.; Soejima T.; Aliaga C. E.; Somorjai G. A.; Yang P. Nanocrystal bilayer for tandem catalysis. Nat. Chem. 2011, 3, 372–376. [DOI] [PubMed] [Google Scholar]
- Zhang Q.; Shu X.-Z.; Lucas J. M.; Toste F. D.; Somorjai G. A.; Alivisatos A. P. Inorganic micelles as efficient and recyclable micellar catalysts. Nano Lett. 2013, 14, 379–383. [DOI] [PubMed] [Google Scholar]
- Karplus M.; McCammon J. A. Molecular dynamics simulations of biomolecules. Nat. Struct. Mol. Biol. 2002, 9, 646–652. [DOI] [PubMed] [Google Scholar]
- Baker N. A.; Sept D.; Joseph S.; Holst M. J.; McCammon J. A. Electrostatics of nanosystems: Application to microtubules and the ribosome. Proc. Natl. Acad. Sci. U.S.A. 2001, 98, 10037–10041. [DOI] [PMC free article] [PubMed] [Google Scholar]
- Elber R. Long-timescale simulation methods. Curr. Opin. Struct. Biol. 2005, 15, 151–156. [DOI] [PubMed] [Google Scholar]
- Agarwal U.; Escobedo F. A. Mesophase behaviour of polyhedral particles. Nat. Mater. 2011, 10, 230–235. [DOI] [PubMed] [Google Scholar]
- Henzie J.; Grünwald M.; Widmer-Cooper A.; Geissler P. L.; Yang P. Self-assembly of uniform polyhedral silver nanocrystals into densest packings and exotic superlattices. Nat. Mater. 2012, 11, 131–137. [DOI] [PubMed] [Google Scholar]
- Ye X.; Chen J.; Engel M.; Millan J. A.; Li W.; Qi L.; Xing G.; Collins J. E.; Kagan C. R.; Li J.; Glotzer S. C.; Murray C. B. Competition of shape and interaction patchiness for self-assembling nanoplates. Nat. Chem. 2013, 5, 466–473. [DOI] [PubMed] [Google Scholar]
- Damasceno P. F.; Engel M.; Glotzer S. C. Predictive self-assembly of polyhedra into complex structures. Science 2012, 337, 453–457. [DOI] [PubMed] [Google Scholar]
- Vondermassen K.; Bongers J.; Mueller A.; Versmold H. Brownian motion: A tool to determine the pair potential between colloid particles. Langmuir 1994, 10, 1351–1353. [Google Scholar]
- Crocker J.; Grier D. Microscopic measurement of the pair interaction potential of charge-stabilized colloid. Phys. Rev. Lett. 1994, 73, 352–355. [DOI] [PubMed] [Google Scholar]
- Royall C. P.; Louis A. A.; Tanaka H. Measuring colloidal interactions with confocal microscopy. J. Chem. Phys. 2007, 127, 044507. [DOI] [PubMed] [Google Scholar]
- De Jonge N.; Ross F. M. Electron microscopy of specimens in liquid. Nat. Nanotechnol. 2011, 6, 695–704. [DOI] [PubMed] [Google Scholar]
- Yuk J. M.; Park J.; Ercius P.; Kim K.; Hellebusch D. J.; Crommie M. F.; Lee J. Y.; Zettl A.; Alivisatos A. P. High-resolution EM of colloidal nanocrystal growth using graphene liquid cells. Science 2012, 336, 61–64. [DOI] [PubMed] [Google Scholar]
- Liao H.-G.; Zherebetskyy D.; Xin H.; Czarnik C.; Ercius P.; Elmlund H.; Pan M.; Wang L.-W.; Zheng H. Facet development during platinum nanocube growth. Science 2014, 345, 916–919. [DOI] [PubMed] [Google Scholar]
- Jiang Y.; Zhu G.; Lin F.; Zhang H.; Jin C.; Yuan J.; Yang D.; Zhang Z. In situ study of oxidative etching of palladium nanocrystals by liquid cell electron microscopy. Nano Lett. 2014, 14, 3761–3765. [DOI] [PubMed] [Google Scholar]
- Sutter E.; Jungjohann K.; Bliznakov S.; Courty A.; Maisonhaute E.; Tenney S.; Sutter P. In situ liquid-cell electron microscopy of silver–palladium galvanic replacement reactions on silver nanoparticles. Nat. Commun. 2014, 5, 4946. [DOI] [PubMed] [Google Scholar]
- Park J.; Zheng H.; Lee W. C.; Geissler P. L.; Rabani E.; Alivisatos A. P. Direct observation of nanoparticle superlattice formation by using liquid cell transmission electron microscopy. ACS Nano 2012, 6, 2078–2085. [DOI] [PubMed] [Google Scholar]
- Liao H.-G.; Cui L.; Whitelam S.; Zheng H. Real-time imaging of Pt3Fe nanorod growth in solution. Science 2012, 336, 1011–1014. [DOI] [PubMed] [Google Scholar]
- Chen Q.; Smith J. M.; Park J.; Kim K.; Ho D.; Rasool H. I.; Zettl A.; Alivisatos A. P. 3D Motion of DNA-Au nanoconjugates in graphene liquid cell electron microscopy. Nano Lett. 2013, 13, 4556–4561. [DOI] [PubMed] [Google Scholar]
- Grogan J.; Rotkina L.; Bau H. In situ liquid-cell electron microscopy of colloid aggregation and growth dynamics. Phys. Rev. E 2011, 83, 061405. [DOI] [PubMed] [Google Scholar]
- Liu Y.; Lin X.-M.; Sun Y.; Rajh T. In situ visualization of self-assembly of charged gold nanoparticles. J. Am. Chem. Soc. 2013, 135, 3764–3767. [DOI] [PubMed] [Google Scholar]
- Nie Z.; Fava D.; Kumacheva E.; Zou S.; Walker G. C.; Rubinstein M. Self-assembly of metal-polymer analogues of amphiphilic triblock copolymers. Nat. Mater. 2007, 6, 609–614. [DOI] [PubMed] [Google Scholar]
- Thomas K. G.; Barazzouk S.; Ipe B. I.; Joseph S. T. S.; Kamat P. V. Uniaxial plasmon coupling through longitudinal self-assembly of gold nanorods. J. Phys. Chem. B 2004, 108, 13066–13068. [Google Scholar]
- Sönnichsen C.; Alivisatos A. P. Gold nanorods as novel nonbleaching plasmon-based orientation densors for polarized single-particle microscopy. Nano Lett. 2004, 5, 301–304. [DOI] [PubMed] [Google Scholar]
- Huang X.; El-Sayed I. H.; Qian W.; El-Sayed M. A. Cancer vell imaging and photothermal therapy in the near-infrared region by using gold nanorods. J. Am. Chem. Soc. 2006, 128, 2115–2120. [DOI] [PubMed] [Google Scholar]
- Liu N.; Hentschel M.; Weiss T.; Alivisatos A. P.; Giessen H. Three-dimensional plasmon rulers. Science 2011, 332, 1407–1410. [DOI] [PubMed] [Google Scholar]
- Biswas S.; Duan J.; Nepal D.; Pachter R.; Vaia R. Plasmonic resonances in self-assembled reduced symmetry gold nanorod structures. Nano Lett. 2013, 13, 2220–2225. [DOI] [PubMed] [Google Scholar]
- Ye X.; Gao Y.; Chen J.; Reifsnyder D. C.; Zheng C.; Murray C. B. Seeded growth of monodisperse gold nanorods using bromide-free surfactant mixtures. Nano Lett. 2013, 13, 2163–2171. [DOI] [PubMed] [Google Scholar]
- Meakin P. Formation of fractal clusters and networks by irreversible diffusion-limited aggregation. Phys. Rev. Lett. 1983, 51, 1119–1122. [Google Scholar]
- Israelachvili J. N.Intermolecular and surface forces, 3rd ed.; Academic Press: New York; 2011; pp 314–318. [Google Scholar]
- Schneider N. M.; Norton M. M.; Mendel B. J.; Grogan J. M.; Ross F. M.; Bau H. H. Electron–water interactions and implications for liquid cell electron microscopy. J. Phys. Chem. C 2014, 118, 22373–22382. [Google Scholar]
- Hong L.; Cacciuto A.; Luijten E.; Granick S. Clusters of charged Janus spheres. Nano Lett. 2006, 6, 2510–2514. [DOI] [PubMed] [Google Scholar]
- Chen Q.; Bae S. C.; Granick S. Staged self-assembly of colloidal metastructures. J. Am. Chem. Soc. 2012, 134, 11080–11083. [DOI] [PubMed] [Google Scholar]
- Derjaguin B.; Landau L. Theory of the stability of strongly charged lyophobic sols and of the adhesion of strongly charged particles in solutions of electrolytes. Prog. Surf. Sci. 1993, 43, 30–59. [Google Scholar]
- Lin M. M.; Zewail A. H. Hydrophobic forces and the length limit of foldable protein domains. Proc. Natl. Acad. Sci. U.S.A. 2012, 109, 9851–9856. [DOI] [PMC free article] [PubMed] [Google Scholar]
Associated Data
This section collects any data citations, data availability statements, or supplementary materials included in this article.