Abstract
Objective. To describe the cumulative and contemporary numbers of colleges and schools of pharmacy between 1900 and 2014 based on membership in the American Association of Colleges of Pharmacy or its predecessor, the American Conference of Pharmaceutical Faculties, as well as the mean number of graduates among member schools each year.
Methods. A review of published literature for numbers of schools and graduates was conducted and descriptive statistics were calculated.
Results. The cumulative number of schools rose from 21 to 152 between those years. The peak contemporary number was 130 in 2014. Including satellite campuses with parallel curricula brings the contemporary total to 172. The smallest number of graduates per member school per year occurred in 1945 and 1946, with peaks in 1951, 1977, and 2013 (∼110 per school per year in the latter two peaks).
Conclusions. The number of US pharmacy schools progressively rose between 1900 and 2014, with the fastest rate of growth occurring in 2014. The mean number of graduates per school per year rose or fell with influences such as the Great Depression, World War II, and the GI Bill.
Keywords: schools, education-pharmacy, history, pharmacists, pharmacy
INTRODUCTION
Our present era is witnessing an expansion in the number of pharmacy colleges and schools in the United States. How does the present expansion compare to prior periods of US history, in terms of numbers of schools and numbers of pharmacy graduates per school? Data are available from the American Association of Colleges of Pharmacy (AACP), featuring the number of schools since 1996 and the number of graduates since 1965. But these data have not yet been compiled in a way that allows understanding of these historical trends across the full 115-year existence of AACP.
To fill this gap, this paper describes the cumulative and contemporary (in any given year) numbers of schools between 1900 and 2014, based on membership in the AACP and its predecessor organization, the American Conference of Pharmaceutical Faculties (ACPF). Satellite campuses with parallel programs, a relatively recent phenomenon that has not been well quantified, are also evaluated. Additionally, the number of US pharmacy graduates granted their first professional degree as a function of the number of schools is provided.
METHODS
This work derives first from the scholarship of Robert Buerki, who inventoried the successive schools admitted to membership in ACPF from 1900 to 1925 and then in AACP from 1925 to 1999, as part of a centennial assessment of pharmaceutical education.1 His work was presented as lists in several discrete tables, but not concatenated until now. Subsequent data through the end of 2014 were obtained from AACP’s institutional membership roster,2 supplemented by information provided by AACP staff members.
To graph changes over time, each school accepted to ACPF or AACP membership was assigned a row in a Microsoft Excel spreadsheet, with columns designated for membership (specified as active or no longer active) for each year from 1900 through 2014. In previous eras, dates were based on Buerki’s citations of founding or permanent membership.1 For pharmacy schools that transferred ownership or changed names or were absorbed into another corporate entity while retaining the same administrative leadership and management, such lineage was given a single count. When two schools merged, the count was changed from two to one. In our current era, membership dates are based on status as a regular institutional member of AACP. Eligibility for regular institutional membership is triggered by achieving candidate status with the Accreditation Council for Pharmaceutical Education (ACPE), typically after the first class matriculated has completed one academic year.
To consider the perspective of the student pharmacist, these data were supplemented with data on satellite campuses sponsored by AACP member schools, where parallel educational programs (ie, replicate curricula) are conducted. These data were obtained primarily from the records of the American Pharmacists Association’s Academy of Students of Pharmacy (APhA-ASP).3 The year these satellite campuses first yielded graduates was determined from the school’s own information, located via Google. Academic arrangements where all students attend first one campus and then a second campus were annotated, but excluded from further assessment.
The total number of US pharmacy graduates receiving their first professional degree in each year was obtained from published sources.4-6 In cases where the data sources conflicted, the largest value was selected to favor completeness of reporting.
Descriptive statistics (eg, counts, sums, means, standard deviations) were calculated for the numbers of schools and graduates. The mean numbers of pharmacy graduates per school per year were calculated as the total number of graduates reported to AACP divided by the number of AACP member schools, excluding the newest schools that had not yet yielded graduates in this period. This approach was repeated to include the satellite campuses. Slopes for changes in the cumulative and contemporary numbers of schools were measured iteratively for each 5-year and 10-year interval using Microsoft Excel, with a starting point in 1901.
RESULTS
The number of US pharmacy schools operating in 1900 is not precisely known. Twenty-one schools attended the first ACPF meeting, May 8-9, 1900, in Richmond, Virginia. In contrast, at least 34 and perhaps as many as 59 pharmacy schools did not attend that meeting.1,4 It was not until the 1950s that essentially all US pharmacy schools became members of AACP.4 The last pre-1900 pharmacy school to join AACP was the University of Kansas City, established in 1885 as the Kansas City College of Pharmacy, admitted to AACP in 1948.1 The last school of pharmacy that was not newly established (ie, within 5 years) upon joining AACP was Samford University, established in 1932 as Howard College, accepted into AACP in 1952.1
Appendix 1 lists the individual school lineages and years of ACPF or AACP membership, as well as related satellite campuses.1-3 Schools are grouped by state or territory, and then chronologically within each group. Forty-eight states (all except Alaska and Delaware) and three territories (ie, the District of Columbia, the Commonwealth of Puerto Rico, and the Commonwealth of the Philippines) are represented in the list. The University of the Philippines was a member from 1916, continuing to 1962, although the Republic of the Philippines became a sovereign nation in 1946.
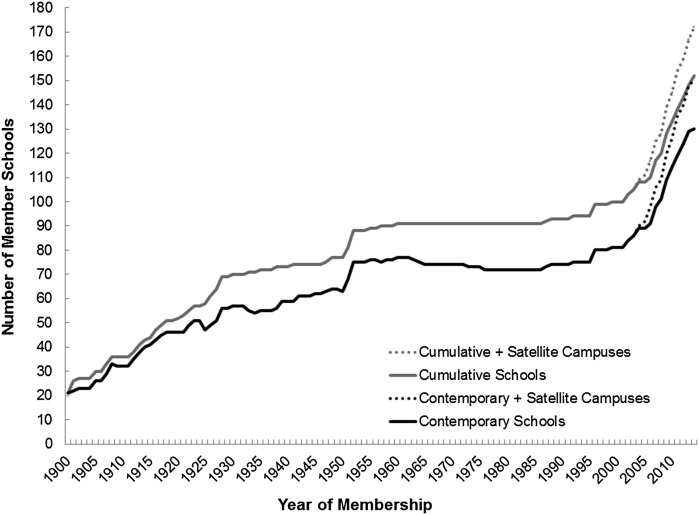
Figure 1 depicts the progressive rise in the cumulative number of schools ever admitted to ACPF or AACP.1,2 The line depicting the contemporary number of schools in any given year generally rises. The dashed lines show the recent supplementary quantity of satellite campuses.
Figure 1.
Cumulative and Contemporary Numbers of US Schools of Pharmacy, 1900-2014 (based on ACPF or AACP regular membership).
Several declines occur in the contemporary curve. Little change in the number of schools occurred during World War I, which was a relatively short conflict from the American perspective.1,4 In 1924, the ACPF adopted a minimum 3-year, 2250-hour requirement for the pharmacy graduate (PhG) degree. All five New York schools then resigned from ACPF membership, because New York schools did not have the legislative authority to confer that degree. New York legislation made the 3-year program mandatory in 1928, but “lingering bitterness” delayed the return of New York members until 1939 for four schools and 1945 for another.1
Over the years, ACPF and then AACP established progressively more objective and more stringent standards for acceptance into membership. Seven schools disbanded between 1926 and 1940, variously because of increasing requirements for contact hours between students and faculty members, the Great Depression, or other factors.1,4 One of those factors was the creation of ACPE as an independent accrediting body in 1932. Five schools disbanded their pharmacy curricula between 1956 and 1975.1 In addition to the New York situation, six other schools held membership, had membership lapse, and then restored it.
The number of schools began to rise again around 1996, accelerating since 2007. The cumulative number of schools rose from 21 in 1900 to 152 in 2014 (Figure 1). The peak contemporary number of schools occurred in 2014, with 130 regular institutional members. Those numbers were augmented by 23 satellite campuses in 2014 (Appendix 1). Three additional schools held affiliate status with AACP and will likely become regular members soon (listed in Appendix 1, but not in the figures).
The steepest slope in accumulation of new pharmacy schools (using the contemporary values and excluding the satellite campuses) during any 5-year interval was 2006-2010. When considered in 10-year intervals, the steepest slope occurred during 2005-2014. Conversely, periods of retrenchment are apparent in Figure 1.
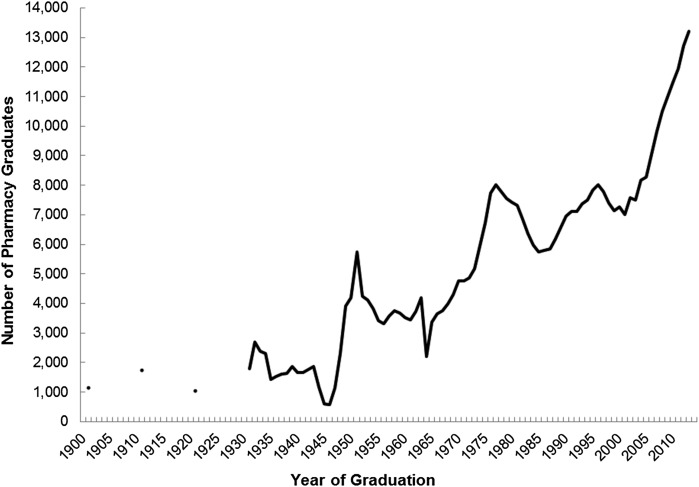
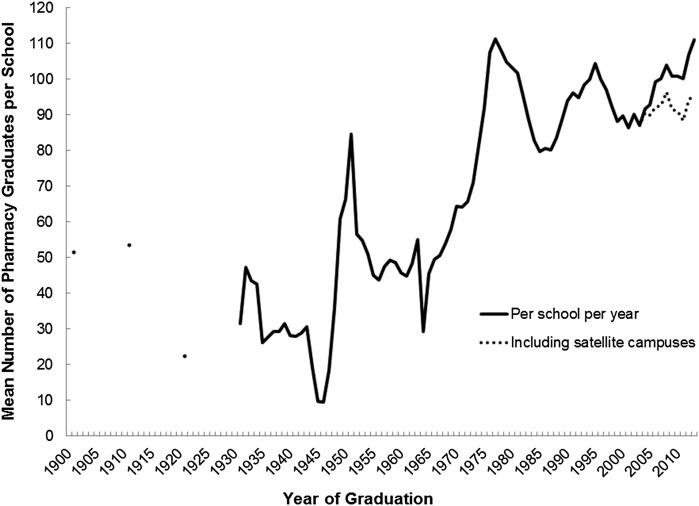
The US total for first professional pharmacy degrees ranges remarkably from a nadir of 582 in 1946 to 13 207 in 2013 (Figure 2). Little change in the number of schools occurred during World War II, although the length of curriculum was modified somewhat.1,4 As shown in Figure 3,4-6 the number of graduates per school in 1945 and 1946 was drastically lower than the prewar era, reflecting the small number who began studying pharmacy during that war. Conversely, the Servicemen’s Readjustment Act of 1944 (better known as “the GI Bill”) had an extraordinary influence on increasing the number of adult school students (and pharmacy graduates) in the late 1940s and 1950s.1 The number of graduates per member school peaked in 1951 at 85 graduates per school per year, then declined as several new schools opened. The number of graduates rose to a relative peak in 1963 and fell to a relative nadir in 1964, just before and after pharmacy programs changed from a 4-year to a 5-year norm. Graduates gradually rose to their absolute peak in 1977 at 111 graduates per school per year, which was achieved again in 2013. Considering graduates per campus, rather than per member school, yields lower values, shown by the dashed line in Figure 3.
Figure 2.
Numbers of US Pharmacy Graduates per Year, 1900-2013 (first professional degree, among ACPF or AACP regular members).
Figure 3.
Mean Number of Pharmacy Graduates per Year per US College of Pharmacy, 1900-2013 (first professional degree, among ACPF or AACP regular members).
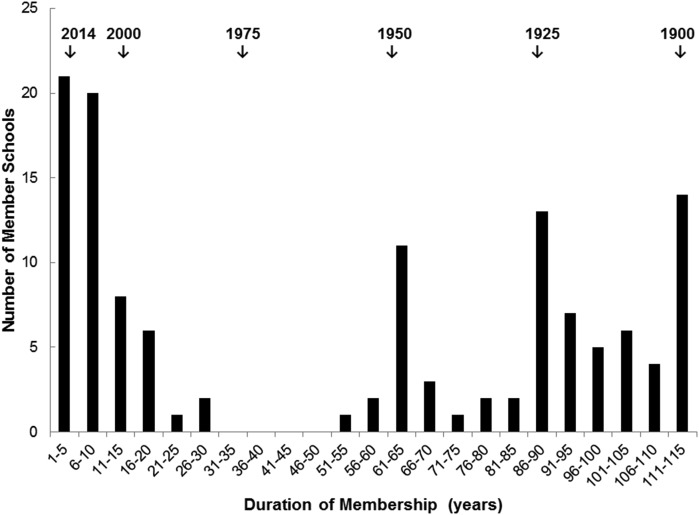
Figure 4 provides a histogram of the duration of school membership in ACPF or AACP in 5-year strata.1,2 The median value is 54 years. The mean years of membership among current schools is 54.0 (SD=43.4) years. The large standard deviation is consistent with the broad distribution of membership duration. Twenty-five schools have been members for 100 years or more. Forty-one schools have been members for 10 years or less.
Figure 4.
Distribution of Duration of Membership in ACPF or AACP (current member colleges, as of 2014).
DISCUSSION
This analysis transforms AACP data into graphical trend information, including depiction of the recent expansion in US pharmacy schools and campuses. This analysis does not consider the US pharmaceutical education environment before 1900. Nor has it considered schools of the early twentieth century that were not members of ACPF and AACP.
The number of graduates per school per year was based on data submitted by member schools to AACP; such reporting may not have been complete in all years. To the extent that graduate data was missing, the values for overall graduates would be understated. Insofar as new member schools or satellite campuses may have not yet reached their full graduate capacity per academic class, the number of graduates per school per year may rise somewhat in the next few years.
Global statistics on pharmaceutical education have been compiled through a joint effort of the Fédération Internationale Pharmaceutique, the World Health Organization, and the United Nations Educational, Scientific, & Cultural Organization. Based on 2011 international survey data from 54 countries, the contemporary number of US graduates per school per year is greater than the mean value of 71, but similar to that of other industrialized democracies.7 A related 2012-2013 survey from 95 countries found that the 3.9 US pharmacy graduates per 100 000 US population was slightly greater than the mean response of 3.6.8
One interpretation of Figure 4 is that US pharmacy schools joined ACPF or AACP in a trimodal distribution, with a 30-year developmental stage from 1900 to 1930, a plateau, then a modest expansion period in the 1950s, another longer plateau, then the substantial expansion or explosion we experience today (see also Figure 1). The evolution of the collective number of pharmacy schools reflects multiple societal influences: the professionalization of pharmacy practice and pharmaceutical education, the effects of depression and wartime mobilization, and the increase in both overall population and use of pharmaceuticals per inhabitant.
This analysis describes the magnitude of the recent expansion in numbers of schools, campuses, and graduates, most expansively since 2005 (Figures 1-4). The array of influences on the current and emerging pharmacy workforce are complex and interwoven; present-day supply and demand are just two of the influences.9,10 Obviously, future supply (influenced by rates of part-time employment and retirement) and future demand (influenced by static or expanded job roles and sites) bear on how many new graduates are needed. In turn, the number of pharmacy schools will be influenced by these factors, as well as educational theory for the optimal number of students per class and regional needs that are masked by national averages. Few prognostic tools exist.
Through its member organizations, the Pharmacy Workforce Center (PWC) collects and analyzes data on the US supply of licensed pharmacists and the demand for pharmacy services. The PWC has calculated an Aggregate Demand Index (ADI) since 1999, by surveying panels of people who participate on a direct and regular basis in hiring pharmacists.11,12 The panels are selected to represent the major geographic and practice sectors of US pharmacy practice. The ADI uses a 5-point scale ranging from level 5 (high demand: difficult to fill open positions) to level 1 (demand much less than the pharmacist supply available). The ADI for the nation was first measured in 1999 at 4.07.13 That annual value stayed relatively flat, not falling below 3.8 until 2009, a time when many new pharmacy schools began graduating their initial classes. Shifting to a monthly scale, values of the national ADI slowly fell until it reached 3.2 in early 2013.12 Then the ADI slowly started rising again, coinciding with improvements in the economy. In November 2014, the ADI was 3.40, but regional ADI values varied somewhat (as they have varied since 1999).12 In November 2014, Arkansas was the only state that month at level 5. There were 24 states at level 4 (some difficulty filling open positions), comprising 53% of the US population. There were 25 states at level 3 (balance between supply and demand), with 46% of the population.
How society and the profession of pharmacy will deal with remarkably expanded numbers of practicing pharmacists remains to be seen in coming years.9,10,13 A greater number of graduates does not automatically mean an increased supply of pharmacists. A greater number provides some opportunity for more pharmacists to spend more time in patient-centered roles, but only after compensating for retirements, increased use of medications (absolutely and per capita), population growth and migration, and other factors.
This analysis showed that 22 pharmacy schools joined ACPF or AACP but subsequently discontinued their pharmacy curricula (Appendix 1 and Figure 1). Whether any of the current schools or satellite campuses will be subject to future attrition cannot be predicted from the data presented here. Without a doubt, societal influences will continue to affect future numbers of pharmacy schools, campuses, and graduates.
CONCLUSION
ACPF and AACP attracted an increasing proportion of pharmacy schools to membership during its first few decades. By 1952, all pharmacy schools were members. The cumulative number of member schools started with 21 in 1900, rose in several waves, reaching 152 in 2014. The peak contemporary number occurred in 2014 (along with the fastest rate of growth), with 130 regular institutional members plus 23 satellite campuses. Twenty-two member schools discontinued their pharmacy curricula. The US total for first professional pharmacy degrees ranged from 582 in 1946 to 13 207 in 2013. The mean number of pharmacy graduates per school per year was influenced by the Great Depression, World War II, the GI Bill, and other factors.
ACKNOWLEDGMENTS
The author would like to thank Terry Ryan, Danielle Taylor, and Lucinda L. Maine of AACP for their research of recent schools membership dates and numbers of graduates from AACP files. Keith D. Marciniak of APhA-ASP provided important information on satellite (parallel) campuses of US pharmacy schools. Potential conflicts of interest: John D. Grabenstein is an employee of Merck & Co., Whitehouse Station, NJ.
Appendix 1.
Roster of US Schools of Pharmacy with Date of Admission as Permanent or Regular Members of American Conference of Pharmaceutical Faculties or the American Association of Colleges of Pharmacy
REFERENCES
- 1.Buerki RA.In search of excellence: the first century of the American Association of Colleges of Pharmacy Am J Pharm Educ 199963Fall Suppli-vi1–210. [Google Scholar]
- 2.American Association of Colleges of Pharmacy. AACP Institutional Members, Alexandria, VA. www.aacp.org/ABOUT/MEMBERSHIP/INSTITUTIONALMEMBERSHIP/Pages/usinstitutionalmember.aspx. Accessed February 9, 2015.
- 3.American Pharmacists Association Academy of Students of Pharmacy. APhA-ASP Chapter Websites. Washington, DC. http://www.pharmacist.com/search/node/apha%20asp%20chapter%20websites. Accessed February 9, 2015.
- 4.Mrtek RG. Pharmaceutical education in these United States – an interpretive historical essay of the twentieth century. Am J Pharm Educ. 1976;40(4):339–365. [PubMed] [Google Scholar]
- 5.Meyer SM. The pharmacy student population: applications received 1992-93, degrees conferred 1992-93, fall 1993 enrollments. Am J Pharm Educ. 1994;58(4):86S–97S. [Google Scholar]
- 6.American Association of Colleges of Pharmacy. Table 5: Number of pharmacy degrees conferred 1965-2013 by degree and gender. www.aacp.org/resources/research/institutionalresearch/Documents/Fall_13_DegsConferred.pdf. Accessed February 9, 2015.
- 7.Fédération Internationale Pharmaceutique. 2012 FIP Global Pharmacy Workforce Report. Hague: FIP, 2012. www.fip.org/files/members/library/FIP_workforce_Report_2012.pdf. Accessed February 9, 2015.
- 8.Fédération Internationale Pharmaceutique. 2013 FIP·Ed Global Education Report. Hague: FIP, 2013. http://apps.who.int/medicinedocs/en/d/Js21320en/. Accessed February 9, 2015.
- 9.Pharmacy Workforce Center. Pharmacy Workforce Resources. www.aacp.org/resources/research/pharmacyworkforcecenter/Pages/default.aspx. Accessed February 9, 2015.
- 10.Bonner L. Are there enough jobs for pharmacists, or is supply and demand just leveling out? Pharm Today. 2014;20:36. [Google Scholar]
- 11.Knapp KK, Livesey JC. The Aggregate Demand Index: measuring the balance between pharmacist supply and demand, 1999-2001. J Am Pharm Assoc. 2002;42(3):391–398. doi: 10.1331/108658002763316806. [DOI] [PubMed] [Google Scholar]
- 12.Pharmacy Workforce Center. Aggregate Demand Index. www.pharmacymanpower.com/ Accessed February 9, 2015.
- 13.Doucette WR, Caroline A, Gaither CA, Kreling DH, Mott DA, Schommer JC. Final Report of the National Pharmacist Workforce Study 2009. Alexandria, VA: Pharmacy Manpower Project, Inc., March 2010. www.aacp.org/resources/research/pharmacyworkforcecenter/Documents/2009%20National%20Pharmacist%20Workforce%20Survey%20-%20FINAL%20REPORT.pdf. Accessed February 9, 2015.


