Abstract
Non-alcoholic fatty liver disease (NAFLD) is caused by fat accumulation and is associated with oxidative stress. In this study, we investigated the potential protective effect of pomegranate (Punica granatum L.) peel extract (PPE) against oxidative stress in the liver of rats with NAFLD. Sprague-Dawley rats were fed a high fat diet (HFD), 20% corn oil, or palm oil for 8 weeks in the presence or absence of PPE. The control group was fed a basal diet. The progression of NAFLD was evaluated histologically and by measuring liver enzymes (alanine transaminase and aspartate transaminase), serum lipids (triglycerides and total cholesterol), and oxidative stress markers. The HFD feeding increased the body weight and caused NAFLD, liver steatosis, hyperlipidemia, oxidative stress, and elevated liver enzymes. Administration of PPE ameliorated the hepatic morphology, reduced body weight, improved liver enzymes, and inhibited lipogenesis. Furthermore, PPE enhanced the cellular redox status in the liver tissue of rats with NAFLD. Our findings suggest that PPE could improve HFD-induced NAFLD via abolishment of hepatic oxidative damage and hyperlipidemia. PPE might be considered as a potential lead material in the treatment of NAFLD and obesity through the modulation of lipid metabolism.
Keywords: pomegranate peel extract, nonalcoholic fatty liver disease, oxidative stress
INTRODUCTION
Nonalcoholic fatty liver disease (NAFLD) is a common disorder, and its prevalence has increased worldwide. It is considered as an asymptomatic disease that is typically identified when the liver enzymes alanine aminotransferase (ALT) and aspartate aminotransferase (AST) are elevated. The United States National Health and Nutrition Examination Survey have recently conducted a population-based analysis revealing that the percentage of the United States population with NAFLD has steadily increased over the past 20 years (1). Much of the increase in prevalence of NAFLD is driven by its epidemiologic and pathophysiologic links to oxidative stress-mediated non-communicable diseases including type 2 diabetes mellitus (T2DM) and obesity (2).
Oxidative stress develops when there is an imbalance between reactive oxygen species (ROS) and antioxidants that scavenge oxidative insults (3,4). ROS are involved in the etiology of NAFLD by stimulating glutathione depletion, accumulation of lipid peroxides, and oxidative damage of different organelles in liver tissue (5–8). Glutathione is the major intracellular antioxidant in hepatocytes and plays an important role in maintaining the reduced cellular homeostasis in hepatocytes, and this is essential for optimum activities of several antioxidant enzymes including superoxide dismutase and catalase (9). Limited evidence exists, which suggests that antioxidant supplements may have a role in preventing or treating NAFLD in patients with diabetes (10).
In assessing disease severity and risk of progression to cirrhosis, it is useful to divide NAFLD into two categories: nonalcoholic fatty liver (NAFL) and nonalcoholic steatohepatitis (NASH). The difference between the two entities is histologic. In NASH, there is the presence of hepatic inflammation in contrast to NAFL, which involves only steatosis. NAFL and NASH occur as part of a continuum in which the histology is not exclusively steatosis or steatohepatitis. As one approach to defining the extent and severity of disease, an NAFLD activity score (NAS) has been developed, which assigns numerical values to various histologic measures of steatosis, inflammation, cell injury, and fibrosis (11). The resulting cumulative score can be used to classify patients as having NAFL, borderline NASH, or fully developed NASH. The distinction between NAFL and NASH is important, since patients with NASH are much more likely to progress to clinically significant cirrhosis, portal hypertension, and liver failure. When cirrhosis develops in the context of NAFLD, there is also a several-fold increased risk of hepatocellular carcinoma (12).
Palm oil (PO) and corn oil (CO) are used by the food industry to enhance the palatability of baked goods and sweets. In the process of heating of these oils, trans fatty acids (i.e. a well-known risk factor for chronic disease) are generated. Oil heating produces lipid peroxidation products that are associated with impairment of the electron respiratory chain and causes overproduction of reactive oxygen species, a typical prognostic feature for NAFLD (13). Previous works have shown that feeding rats a high fat diet (HFD) induces hepatic steatosis and liver damage, which are characteristic of NAFLD and thus provides a suitable model for the early stages of the disease. Nevertheless, little is known about the effects of these heated oils (heated PO, HPO; heated CO, HCO) on the liver (hepatic function and oxidative stress).
The human health benefits of pomegranate (Punica granatum L.) fruit are numerous, and it is used worldwide as a medicinal functional food (14–16). Different extracts prepared from pomegranate fruit, such as juice, peel-extract, and seed-extract are reported to exhibit strong antioxidant activity (17,18). Pomegranate peel extract (PPE) is rich in bioactive compounds such as polyphenols, anthocyanidins, tannic acid, gallic acid, and ellagic acid (19, 20). Recent in vivo, in vitro, and epidemiological studies have shown few medicinal properties of PPE as an antioxidant, against colon cancer, T2DM, and inflammatory-mediated diseases (21–25). Also, PPE possesses radical-scavenging properties in diethylnitrosamine-induced liver injuries, reversed methotrexate toxicity in the liver by decreasing oxidative stress and liver apoptosis, and enhanced the activity of liver enzymes against ROS after CCl4 toxicity (26,27). This study aims to explore the potential role of PPE in HFD-fed rats. This objective is supported by the rationale that in previous publications, PPE ameliorated hepatic oxidative stress and decreased serum lipids in experimental animal models. Therefore, it is important to elucidate the role of PPE, as a strong antioxidant, in preventing dietary-induced NAFLD.
MATERIALS AND METHODS
PPE
Pomegranate peels were separated from the fruit manually and were cut into small pieces (2 cm×2 cm). The cut pieces were freeze dried for 5 d (FreeZone Freeze Dry Systems, Labconco Corp., Kansas City, MO, USA). The freeze-dried samples were ground into fine powder by a grinder (FOSS Cemotec Grinder, Germany) and stored at −40°C until used. The PPE water extract was prepared weekly by mixing dry powder with distilled water (15 g dry solids/100 mL) and kept at 4°C until used. PPE was administered orally 2 days per week to each rat at a dose calculated as 2.5 mL/kg body weight per rat.
Oils sampling
In this study, two types of oil were used: CO and PO. The oil types were selected according to their chemical properties (i.e. saturated and unsaturated oils). The fresh types of oils were divided into 2 groups: heated and non-heated. The heated oil was prepared by heating the oil in an oven at 150°C for 4 d.
Biochemical analyses
Determination of acid value
Acid value was determined according to the American Oil Chemists’ Society (AOCS) method Cd 3d-63 (28). Briefly, 25 mL of diethyl ether was mixed with 25 mL of absolute alcohol. Then, this mixture was titrated with 0.1 M sodium hydroxide to be neutralized using a 1% phenolphthalein solution as the indicator. This neutral solvent was mixed with 1.0 g of oil and titrated with 0.1 M sodium hydroxide until a pink color appeared. The acid value was calculated using the following equation:
Measurement of peroxide value
Peroxide value was determined according to the AOCS method Cd 8–53 (29). The oil sample (1.0 g) was added into a test tube containing 1 g potassium iodide powder. Then 20 mL of a solvent mixture containing 200 mL glacial acetic acid and 100 mL chloroform (2:1, v/v) was added to the tube. The tube was placed in boiling water for 30 s. The solution was poured into a conical flask, and the tube was washed with 20 mL of 5% potassium iodide solution and 50 mL of distilled water. The solution was titrated with 0.02 M sodium thiosulphate solution and starch was used as the indicator. Peroxide value was calculated using the following equation (mEq/kg oil):
Measurement of p-anisidine value
The p-anisidine value was determined according to the AOCS official method Cd 18–90 (30). The p-anisidine solution was prepared by dissolving 0.25 g of p-anisidine in 100 mL of glacial acetic acid. Briefly, 2.0 g of the non-heated oil samples and 1.0 g of the heated oil samples were dissolved in 25 mL hexane using 25 mL volumetric flasks. The absorbance (Ab) was measured at 350 nm using a spectrophotometer instrument cell with a blank filled with solvent (hexane) as a reference cell (Spectronic Helios α, Thermo Fisher Scientific, Waltham, MA, USA). In a test tube, 5 mL hexane with dissolved oil was added with 1 mL p-anisidine solution. A blank was prepared by pipetting 5 mL pure hexane with 1 mL p-anisidine solution. All tubes were shaken well and incubated for 10 min. After incubation, the absorbance of the solvent was measured at 350 nm with a blank tube as a reference cell. The p-anisidine value was calculated using the following equation:
where, As is the absorbance of the fat solution after the reaction with the p-anisidine reagent, Ab is the absorbance of the fat solution before the reaction, and M is the mass (g) of sample. The oxidative stability index was determined using a Rancimat 743 (Metrohm AG, Herisau, Switzerland). Briefly, 3.0 g of oil was weighted in the apparatus tubs. The program was run at 120°C and 20 L/h air flow. Oxidative stability index (OSI) was determined by the induction time in hours of the hydroperoxides decomposition.
Fatty acid composition analysis
The fatty acid composition was measured according to the AOAC Official Method 969.33 (31). In a 50 mL boiling flask, (0.3~0.5 g) of the oil samples was added with a boiling chip. Then 6.0 mL of methanolic NaOH solution was added into each flask. The condenser was attached, and the oil was boiled for 10 min. After then, 7 mL of boron trifluoride methanol complex (14% w/v BF3) solution was added through the condenser and set to boil for 2 min. Then 5 mL of heptane was added through the condenser and continued boiling for 1 min. The flask was removed from the condenser and 30 mL of saturated NaCl solution was added into each flask and shaken for a few seconds. When the layers appeared, the upper layer of oil was removed using a dropper into a glass-stoppered test tube. To filter the oil from water, a small amount of anhydrous Na2SO4 was added. Then, 1 mL of the extracted fatty acid was transferred into a gas chromatography (GC) vial for analysis.
GC-MS analysis was performed on a Clarus 600 GC System (PerkinElmer, Waltham, MA USA), fitted with a SP-2560 Supelco capillary column (100 m×0.250 mm i.d.×0.2 μm film thicknessm, Sigma-Aldrich Co., St. Louis, MO, USA) coupled to a Clarus 600 Mass Spectrometers (PerkinElmer). Ultra-high purity helium (99.9999 %) from air products was used as the carrier gas at a constant flow of 1.0 mL/min. The injection, transfer line, and ion source temperatures were 250, 250, and 250°C, respectively. The ionizing energy was 70 eV. Electron multiplier voltage was obtained from autotune. All the data were obtained by collecting the full-scan mass spectra within the scan range of 40~550 amu. The volume of sample injected was 1 μL with a split ratio of 100:1. The oven temperature program was set to 80°C (holds for 5 min) and accelerated at a rate of (4°C/min) for 15 min at 240°C. The unknown compounds were identified by comparing the spectra obtained with the mass spectrum library (NIST 2011 v.2.3) and further confirmed with a Supelco® 37 component FAME mix (cat.# 47885-U).
Analysis of tocopherol content
Tocopherol was analyzed according to the AOCS procedure Ce 8–89 (32). In a beaker, 1 mL of oil sample was dissolved in 1 mL hexane and filtered into a HPLC-vial for analysis. Analyses were carried out using an Agilent 1100 Series HPLC equipped with an Agilent 1100 series Diode Array Detector (Agilent Technologies, Santa Clara, CA, USA). The identification of the samples’ peaks was achieved by retention times and by comparing them with pure standards of α-tocopherol, δ-tocopherol, and γ-tocopherol (DL-alpha tocopherol 100 mg-Neat No: 4-7783). The stationary phase was a normal phase Silica column (Supelcosil™ LC-SI 58295, 25 cm×4.6 mm, 5 μm), and the injection volume was 20 μL at a flow rate of 0.8 mL/min and the wavelength was selected at 292 nm. The mobile phase composition was 97.5% n-hexane and 2.5% 2-propanol.
Animals and experimental design
A total of 90 male Sprague-Dawley rats (aged 8 weeks) were used in this experiment. The male rats were used to avoid any hormonal changes that might affect the metabolic parameters, which were measured in our study. It is well know that female rats are exposed to hormonal variations that might affect the metabolic parameters. The rats were housed in polypropylene cages (i.e. each rat was in an individual case). The houses were kept at standard conditions (temperature: 22±2°C, relative humidity: 60% light exposure: 12-h light/dark cycle). They were provided with a standard laboratory chow diet (Oman Mills, Muscat, Oman) and normal tap water ad libitum. This study was approved by the Animal Ethical Committee of Sultan Qaboos University (SQU/AEC/2010-11/1) and was conducted in accordance to international laws and policies (EEC Council directives 86/609, OJL 358, 1 December, 12, 1987; NIH Guide for the Care and Use of Laboratory Animals, NIH Publication No. 85-23, 1985). After 2 weeks of acclimatization, the animals were divided randomly into 9 groups (10 rats/group). Each group had a weight range of 169~370 g.
The animals’ diet was prepared manually (Table 1), except for the negative control group. Each group had a different diet that varied in the type of oil (i.e. heated or non-heated commercial CO and PO). Oral water and PPE were consumed by rats 2 d/week at 2.5 mL/d using a feeding needle (java feeding). Oral water was given for the non-treated group in order to mimic similar animal treatments with the exception of the diet.
Table 1.
Animal diet composition (unit: g/kg diet)
| Ingredient | Amount |
|---|---|
| Casein (skimmed milk powder) | 140 |
| Starch (white flour) | 620 |
| Sucrose (table sugar) | 100 |
| Dietary fat1) | 200 |
| Fiber (α-cellulose) | 50 |
| AIN-93 mineral mixture | 35 |
| AIN-93 vitamin mixture | 10 |
| Choline bitartarate | 2 |
Corn oil, palm oil, heated corn oil, and heated palm oil; according to the group.
The feeding experiment was conducted for 8 weeks. Animals were weighed weekly and food consumption was recorded daily. After 8 weeks, blood samples were collected from the posterior vena cava, and the animals were scarified by carbon dioxide. Blood serum was prepared by centrifuging blood at 2,000 rpm and 4°C for 15 min. A portion of the liver from each animal was kept in 10% formalin for histology analysis. For the biochemical analysis of liver tissue, 1 g of liver was mixed with 5 mL of phosphate buffered saline buffer (pH 7.4) and centrifuged at 2,000 rpm at 4°C for 20 min, and the supernatant was separated. Both, the liver supernatant and blood serum were stored at −60°C until analysis.
Assay of protein content of liver tissue
Total protein content of liver tissue was determined by the Lowry method using bovine serum albumin (BSA) as a standard (33). The standard was prepared by mixing 2.5 g of BSA and 5 mL distilled water. Seven different concentrations of BSA standard tubes were prepared in duplicate: 0, 5, 10, 15, 20, 25, and 30 μL of BSA with a total volume of 100 μL of distilled water. For the reagents, 2% of sodium carbonate was prepared in 0.1 M sodium hydroxide and mixed with 0.5% copper sulfate and 1% sodium potassium tartrate in a ratio of 100:1:1, respectively. Then in each test tube, 3 mL of the mixed reagent was added and mixed. Next, 200 μL of the Folin-Ciocalteau solution was added to the tubes. This solution was prepared by diluting the Folin-Ciocalteau reagent (2 N) with distilled water (1:1). After that, all the test tubes were incubated for 30 min at room temperature (20°C). Then, the protein concentration was determined by a spectrophotometer (Spectronic Helios α, Thermo Fisher Scientific) at 700 nm wavelength.
Assay of serum lipids profile and liver enzymes
Liver enzymes, AST, ALT, serum lipid profile, cholesterol, and triglycerides (TGs), were measured using a COBAS C 111 analyzer (Roche, Basel, Switzerland). The COBAS C111 analyzer uses a single point calibration in which a calibration curve was created based on one standard. The machine was calibrated with a calibrator for an automated system, and the calibration curve was produced by the instrument software. In order to check the performance of the machine, quality control tests were performed. There are two levels of setting controls available as provided by Roche: normal (Precinorm U Plus) and the abnormal (Precipath U Plus). The results were within x±2SD. The results of liver enzymes were reported in U/L and lipid profile in mmol/L.
Assay of oxidative stress and antioxidant status of liver tissue
Total antioxidant capacity (TAC), reduced glutathione (GSH), superoxide dismutase (SOD) activity, catalase activity (CAT), glutathione peroxidase (GPx) activity, and malondialdehyde (MDA) were determined in liver homogenates according to the manufactures’ instructions, (BioVision Inc., Milpitas, CA, USA).
Histopathological examination
The liver samples stored in 10% formalin were processed through increasing concentrations of ethanol for dehydration, cleared in xylene and blocked in paraffin wax. Haematoxylin and eosin staining were performed on 5 μm thick sections. Slide pictures were taken using Olympus DP70 (Olympus, Tokyo, Japan) digital microscope camera.
Statistical analysis
The collected data were expressed as the mean±standard deviation (SD). The GraphPad Prism (version 5.0, Graphical Software Inc., La Jolla, CA, USA) was used to compute one-way analysis of variance (ANOVA) test followed by Tukey’s test for multiple comparisons. P<0.05 was considered statistical significant.
RESULTS
Table 2 shows the fatty acid composition of the different oil samples. Linoleic acid (C18:2) was highest in CO (56.20±0.42) and HCO (55.50±0.30%) of total fatty acids, followed by oleic acid (C18:1) (28.70±0.54 and 29.05±0.20, respectively) and palmitic acid (C16:0) (11.30±0.08 and 11.45±0.06, respectively). The highest fatty acids percentages in PO and HPO were oleic acid (43.90±0.70 and 44.70±0.51, respectively) followed by palmitic acid (39.20±0.90 and 39.27±0.69, respectively). There was no significant differences in the fatty acid composition after heating within the same oil (P>0.05). Oil properties including acid value, p-ansidine value, peroxide value, oxidative stability index (OSI), and vitamin E (α, γ, and δ) are presented in Table 3. The HFD feeding increased hyperlipidemia, while the administration of PPE ameliorated the observed increase in serum lipids (Table 4).
Table 2.
Fatty acids composition of oil samples
| Fatty acid composition (% of total fatty acid) | CO1) | HCO | PO | HPO |
|---|---|---|---|---|
| C8:0 | 0.00 | 0.00 | 0.01±0.00 | 0.01±0.00 |
| C10:0 | 0.00 | 0.00 | 0.01±0.00 | 0.01±0.00 |
| C12:0 | 0.00 | 0.00 | 0.18±0.02 | 0.16±0.02 |
| C14:0 | 0.02±0.00 | 0.03±0.00 | 0.73±0.02 | 0.71±0.02 |
| C15:0 | 0.00±0.00 | 0.00±0.00 | 0.02±0.00 | 0.02±0.00 |
| C16:0 | 11.30±0.08 | 11.45±0.06 | 39.20±0.90 | 39.27±0.69 |
| C16:12) | 0.02±0.00 | 0.02±0.00 | 0.02±0.00 | 0.01±0.00 |
| C16:13) | 0.06±0.00 | 0.07±0.01 | 0.11±0.01 | 0.10±0.00 |
| C17:0 | 0.05±0.00 | 0.05±0.01 | 0.06±0.00 | 0.06±0.00 |
| C17:1 | 0.02±0.00 | 0.02±0.00 | 0.02±0.00 | 0.01±0.00 |
| C19:0 | 1.85±0.05 | 1.80±0.03 | 4.17±0.15 | 3.96±0.17 |
| C18:1 | 28.70±0.54 | 29.05±0.20 | 43.90±0.70 | 44.70±0.51 |
| C18:2 | 56.20±0.42 | 55.50±0.30 | 10.70±0.08 | 10.26±0.17 |
| C20:0 | 0.40±0.01 | 0.39±0.01 | 0.32±0.03 | 0.31±0.02 |
| C19:3 | 0.13±0.00 | 0.13±0.01 | 0.02±0.00 | 0.02±0.00 |
| C21:1 | 0.41±0.01 | 0.40±0.01 | 0.13±0.01 | 0.12±0.01 |
| C18:3 | 0.54±0.01 | 0.51±0.01 | 0.17±0.01 | 0.14±0.00 |
| C22:0 | 0.13±0.01 | 0.12±0.00 | 0.05±0.01 | 0.05±0.00 |
| C30:6 | 0.02±0.00 | 0.03±0.01 | 0.06±0.03 | 0.04±0.01 |
| C25:0 | 0.15±0.01 | 0.38±0.40 | 0.05±0.01 | 0.05±0.01 |
No significant differences in the means (paired t-test).
CO, corn oil; HCO, heated corn oil; PO, palm oil; HPO, heated palm oil.
Double bond in C7
Double bond in C9
Table 3.
Chemical properties of oil samples
| Sample1) | Acid value (mg KOH/g) | Peroxide value (mEq O2/kg oil) | Oxidative stability index (h) | p-Ansidine value (mEq O2/kg oil) | α-Tocopherol (μg/mL) | γ-Tocopherol (μg/mL) | δ-Tocopherol (μg/mL) |
|---|---|---|---|---|---|---|---|
| CO | 1.58±0.93 | 1.13±0.42 | 6.42±0.69 | 3.84±0.23 | 12.90±4.00 | 53.6±4.00 | ND |
| HCO | 1.59±0.05 | 2.00±0.00* | 5.92±0.01 | 9.05±0.20* | 12.10±17.00 | 33.9±12.00 | ND |
| PO | 1.07±0.04 | 3.00±1.00 | 70.51±0.04 | 4.52±0.23 | 13.50±0.02 | ND | ND |
| HPO | 2.06±0.48* | 2.60±0.20 | 9.19±0.18* | 13.66±0.43* | 13.10±0.02 | ND | ND |
P<0.05 (paired t-test).
ND, not detectable.
CO, corn oil; HCO, heated corn oil; PO, palm oil; HPO, heated palm oil.
Table 4.
Animal’s serum lipid profile (unit: mmol/L)
| Group1) | Triglycerides | Cholesterol |
|---|---|---|
| Control | 0.66±0.15 | 1.73±0.15 |
| CO | 1.32±0.43 | 2.08±0.44 |
| HCO | 1.27±0.60 | 2.16±0.10 |
| PO | 2.10±0.77 | 2.30±0.21 |
| HPO | 2.74±0.84 | 2.37±0.45 |
| CO+PPE | 1.54±0.34 | 2.54±0.31 |
| HCO+PPE | 1.31±0.33 | 2.13±0.39 |
| PO+PPE | 1.81±0.51 | 1.85±0.50 |
| HPO+PPE | 1.85±0.58 | 2.31±0.35 |
No significant differences between the groups.
CO, corn oil; HCO, heated corn oil; PO, palm oil; HPO, heated palm oil; PPE, pomegranate peel extract.
There was change no on the food intake among all rats in the experimental groups. The daily consumption of water and food in the control rats were measured as 25±4 mL, and 10±2 g, respectively. The same pattern was observed for PPE-supplemented groups indicating that PPE had no negative interactive effects. The daily consumption of water and food were also similar to that of the control rats and PPE-supplemented rats, the average value was 25±5 mL, and 10±2 g, respectively. The control rats, PPE-supplemented rats, and other experimental rats grew at a similar rate, and the average weight gain was 10 g per week, the initial body weight was 250 to 300 g.
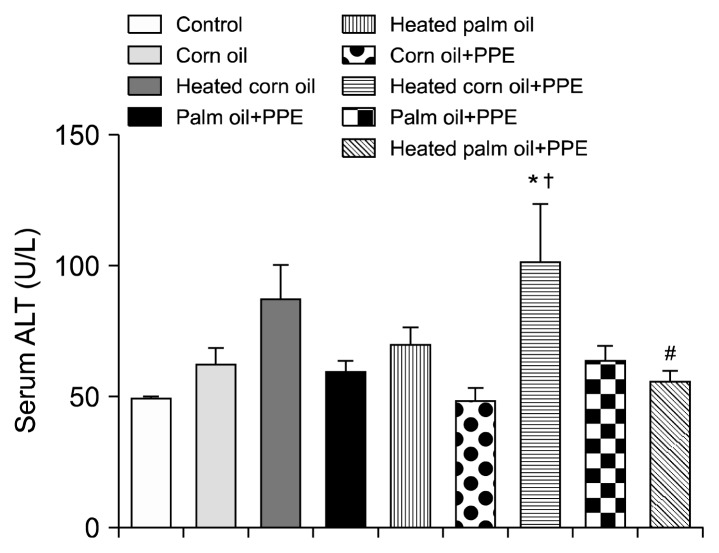
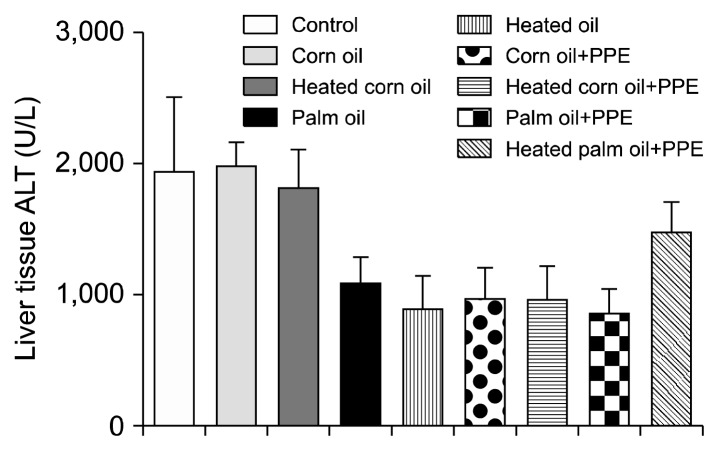
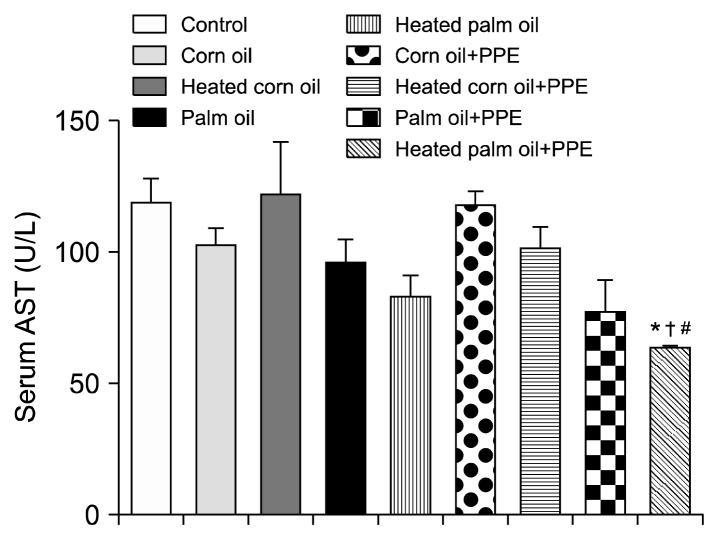
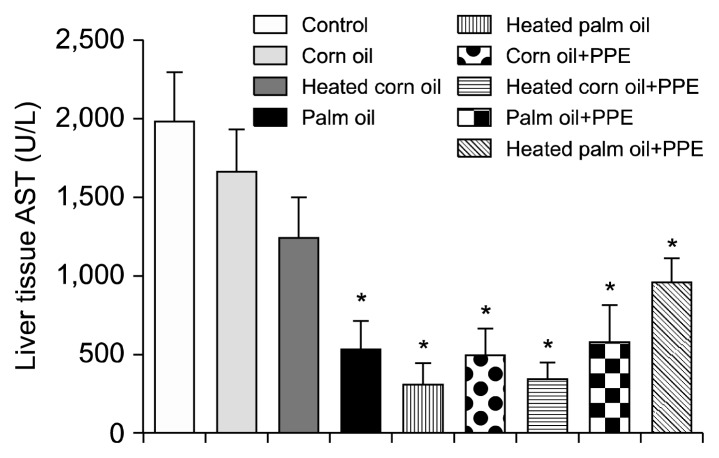
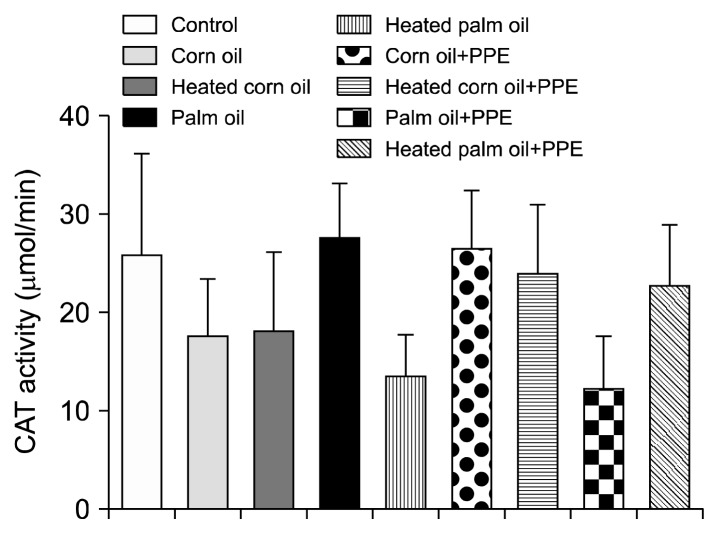
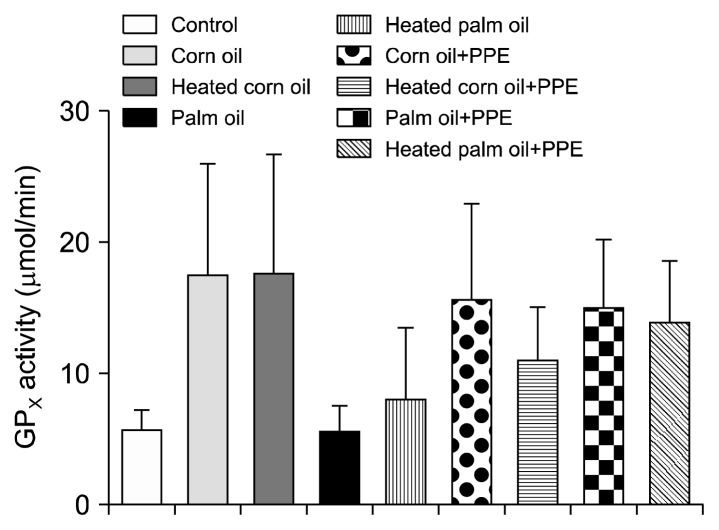
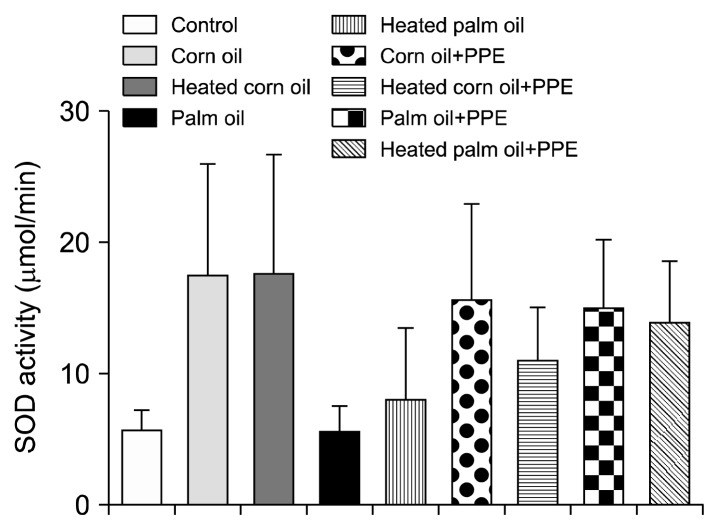
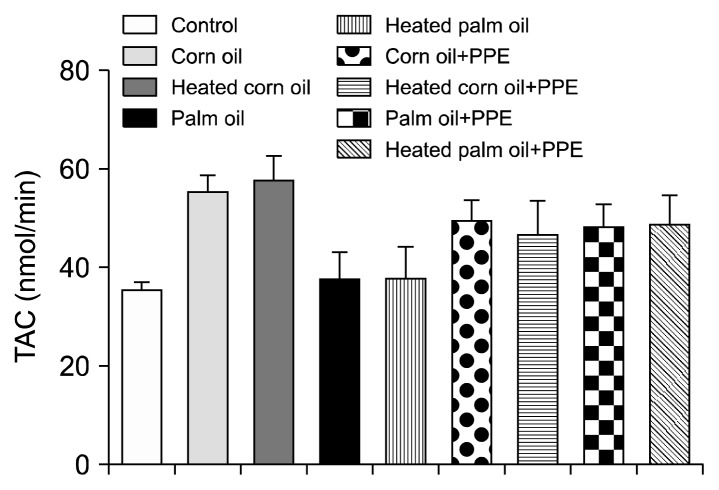
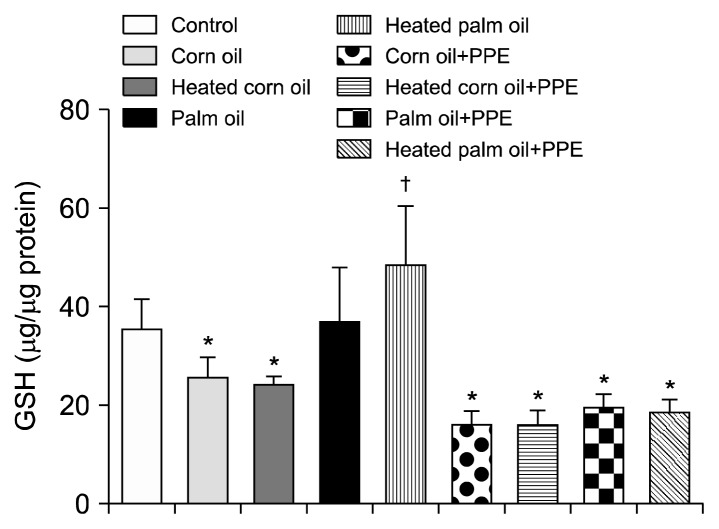
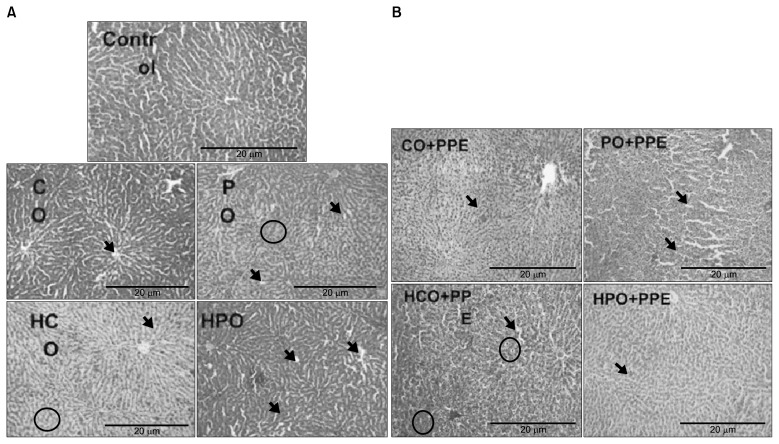
Figs. 1 and 2 illustrate the ALT concentration in U/L in serum and liver tissue, respectively. Serum ALT in the rats fed with HCO and PPE was significantly higher as compared to the groups fed CO and PPE (P<0.05). The changes in ALT also indicated that PPE did not have any adverse toxic effect on the liver. Figs. 3 and 4 represent AST concentration (U/L) in serum and liver tissue homogenates. Serum AST was significantly lower in the group fed HPO and PPE (P<0.05). As shown in Figs. 5, 6, and 7, there were no significant differences between the groups considering the 3 enzymes (CAT, GPx, and SOD, μmol/min), P>0.05. Fig. 8 shows that PPE intervention had no effect on TAC (nmol/mL) in all treated groups, while GSH in groups fed on HPO was significantly lower as compared to control groups (P<0.05). PPE intervention ameliorates the observed GSH (μg/g protein) depletion (Fig. 9). The histopathological examination of liver tissues for the control and experimental groups are shown in Fig. 10 and Table 5. As compared to the control, small fat droplets with few necrosis appeared in the HFD-treated group with no PPE intervention.
Fig. 1.
Alanine transaminase (ALT) concentration in the sera of the experimental groups. Significantly higher as compared to the *control and †corn oil (P<0.05), respectively, and #significantly lower than heated palm oil (P<0.05).
Fig. 2.
Alanine transaminase (ALT) concentration in the liver tissues of the experimental groups.
Fig. 3.
Aspartate transaminase (AST) concentration in the sera of the experimental groups. Heated palm oil+PPE was significantly lower than that of *control, †heated corn oil, and #corn oil+PPE (P<0.05).
Fig. 4.
Aspartate transaminase (AST) concentration in liver tissues of the experimental groups. *Significantly lower as compared to control (P<0.05).
Fig. 5.
Catalase (CAT) enzyme activity measurement.
Fig. 6.
Glutathione peroxidase (GPx) activity measurement.
Fig. 7.
Superoxide dismutase (SOD) activity measurement.
Fig. 8.
Total antioxidant capacity (TAC) activity measurement.
Fig. 9.
Glutathione (GSH) measurement. Significantly *lower and †higher than the control (P<0.05).
Fig. 10.
Histopathology of control (A) and treated groups (B). Arrows indicated fat droplets; circles indicate places of necrosis and cell degradation.
Table 5.
Histopathology analysis for each group
| Control | CO | HCO | PO | HPO | CO+PPE | HCO+PPE | PO+PPE | HPO+PPE | |
|---|---|---|---|---|---|---|---|---|---|
| Degeneration | − | + | ++ | − | − | − | − | − | − |
| Fat droplets | − | ++ | + | +++ | ++ | + | + | + | + |
| Necrosis | − | + | ++ | +++ | +++ | ++ | ++ | ++ | + |
| Cell changes | − | ++ | + | + | + | + | ++ | ++ | + |
−, not detected; +, minor; ++, moderate; +++, severe.
CO, corn oil; HCO, heated corn oil; PO, palm oil; HPO, heated palm oil; PPE, pomegranate peel extract.
DISCUSSION
There were significant increments in acid value, p-ansidine value, and OSI of PO after heating. The CO acid value was not affected by heat, but its peroxide and p-ansidine values were significantly increased after heating. A recent study indicated that the extracted oil from corn germ showed smaller OSI than the sample used in this experiment (i.e. higher acid value) (34). Another study showed the peroxide value for fresh corn oil was 1 mEq/kg which is near to the current study (i.e. 1.13±0.42 mEq/kg) (35). For palm oil, the PV was higher than that of different varieties of palm oil from different countries (36).
Three different isomers of vitamin E were analyzed in this study. α-tocopherol was detected in all samples, γ-tocopherol was only detected in CO (heated and non-heated), and δ-tocopherol was not detected in any sample. Comparing the findings in this study with previous studies, α-tocopherol was significantly lower than what was observed by few reports (37,38).
There are different types of enzymes that could be secreted from different organs. On the other hand, there are specific enzymes secreted in specific organs like ALT, which is a specific enzyme for liver cells (39). In this study, two enzymes, ALT and AST, were analyzed in serum and liver tissue homogenates. AST was not a hepatocyte specific enzyme (i.e. it is also produced in other organs). High levels of serum indicated that there was a liver dysfunction. Serum ALT in the rats fed with HCO and PPE was significantly higher as compared to groups fed CO and PPE, and these findings indicate that HCO was more hazardous to the body than the non-CO. Also, it was clear in this group that PPE had no influence in reducing enzymes activity. High levels of ALT represent hepatocellular damage and systemic inflammation, and NAFLD was accompanied with elevated liver ALT enzyme (40). In contrast, there was no significant difference in liver tissue ALT among the treated groups. AST in liver tissue was lower in all the groups treated with PPE. The elevated level of AST enzyme was an indication to fatty liver pathogenesis. A study showed that AST was elevated in rats fed with a 18% HFD on both HPO and PO, whereas ALT was elevated in rats fed heated oil (40).
Antioxidant enzymes are produced by human cells to scavenge free radicals and stabilize oxidation stress which could influence overall body health status. High concentrations of these enzymes represent oxidation stress that the body tries to eliminate. In this study, 3 antioxidant enzymes in liver tissue were measured. In this study there were no significant differences between the groups considering the 3 enzymes (CAT, GPx, and SOD), indicating that this study could not provide an evidence for the PPE effect on antioxidant enzymes. A study by Takahashi et al. (41) concluded that animals fed a HFD had elevated plasma insulin and oxidative damage in the liver. TAC represents the redox status of the cells, and it was observed that PPE intervention had no effect on TAC in the treated groups. GSH in groups fed on heated palm oil was significantly lower as compared to the control groups, and PPE intervention ameliorates the observed GSH depletion. This was consistent with a previous report that showed PPE increased GSH and decreased liver apoptosis in laboratory animals (42).
It was previously reported that a higher percentage of fat in the animals’ diet (40%, w/w) for 10 weeks, developed severe hepatic micro vesicular and macro vesicular steatosis which indicates severe NAFLD (43). The histopathological analysis was done in this study to examine hepatocytes and liver tissues for any abnormalities or fat droplets. As reported previously, fat accumulates in the liver in two forms: macro vesicular steatosis and microvascular steatosis (44). Macro vesicular steatosis results in large fat droplets that replace hepatocytes nuclei. Whereas microvascular steatosis results in small fat droplets that accumulate in the hepatocytes cytoplasm, Table 5 summarizes the histology analysis for each group. It was observed that PO and HPO groups had more fat droplets than CO and HCO groups, which might be attributed to the high content of saturated fatty acids in PO. There was no necrosis or toxicity effect in hepatocytes in all of the PPE treated groups, indicated that PPE had a protective effect against fat accumulation in the liver. This finding was supported by previous reports that PPE extract had a decreased lipid accumulation in the liver by activating hepatic gene expression and by increasing fatty acid oxidation (45). Based on the results of this study, PPE act as a powerful antioxidant against the rat liver of high fat dietary induced-NAFLD. The results of the present study highlighted the potential health benefits of PPE against NAFLD. This health promoting effect of PPE is suggested to present an economic potential of PPE as a food supplement, instead of its current consideration as a waste material.
CONCLUSION
In conclusion, this study showed that feeding rats with heated oils induced oxidative stress in liver tissue as compared to fresh oil. Serum AST was significantly lower in rats fed HPO and PPE. However, serum ALT was significantly higher in rats fed HCO and PPE. Liver tissue AST was significantly lower in all PPE treated groups as compared to the control. Fat droplets were visualized in the liver tissue of rats fed heated oils, meanwhile PPE treatment was associated with a decrease in fat droplets. Antioxidant enzymes were not affected by PPE in all groups compared to the control and non-treated groups.
ACKNOWLEDGEMENTS
We thank the staff of the Animal House at Sultan Qaboos University for looking after the rats. This research was financially supported by His Majesty Strategic Fund SR/AGR/FOOD/11/01.
Footnotes
AUTHOR DISCLOSURE STATEMENT
The authors declare no conflict of interest.
REFERENCES
- 1.Younossi ZM, Stepanova M, Afendy M, Fang Y, Younossi Y, Mir H, Srishord M. Changes in the prevalence of the most common causes of chronic liver diseases in the United States from 1988 to 2008. Clin Gastroenterol Hepatol. 2011;9:524–530. doi: 10.1016/j.cgh.2011.03.020. [DOI] [PubMed] [Google Scholar]
- 2.Amarapurkar DN, Hashimoto E, Lesmana LA, Sollano JD, Chen PJ, Goh KL. How common is non-alcoholic fatty liver disease in the Asia–Pacific region and are there local differences? J Gastroenterol Hepatol. 2007;22:788–793. doi: 10.1111/j.1440-1746.2007.05042.x. [DOI] [PubMed] [Google Scholar]
- 3.Malaguarnera G, Cataudella E, Giordano M, Nunnari G, Chisari G, Malaguarnera M. Toxic hepatitis in occupational exposure to solvents. World J Gastroenterol. 2012;18:2756–2766. doi: 10.3748/wjg.v18.i22.2756. [DOI] [PMC free article] [PubMed] [Google Scholar]
- 4.Obika M, Noguchi H. Diagnosis and evaluation of non-alcoholic fatty liver disease. Exp Diabetes Res. 2012;2012:145754. doi: 10.1155/2012/145754. [DOI] [PMC free article] [PubMed] [Google Scholar]
- 5.Rolo AP, Teodoro JS, Palmeira CM. Role of oxidative stress in the pathogenesis of nonalcoholic steatohepatitis. Free Radic Biol Med. 2012;52:59–69. doi: 10.1016/j.freeradbiomed.2011.10.003. [DOI] [PubMed] [Google Scholar]
- 6.Krawczyk M, Bonfrate L, Portincasa P. Nonalcoholic fatty liver disease. Best Pract Res Clin Gastroenterol. 2010;24:695–708. doi: 10.1016/j.bpg.2010.08.005. [DOI] [PubMed] [Google Scholar]
- 7.Cave M, Deaciuc I, Mendez C, Song Z, Joshi-Barve S, Barve S, McClain C. Nonalcoholic fatty liver disease: predisposing factors and the role of nutrition. J Nutr Biochem. 2007;18:184–195. doi: 10.1016/j.jnutbio.2006.12.006. [DOI] [PubMed] [Google Scholar]
- 8.Al-Rawahi AS, Rahman MS, Guizani N, Essa MM. Chemical composition, water sorption isotherm, and phenolic contents in fresh and dried pomegranate peels. Drying Technol. 2013;31:257–263. doi: 10.1080/07373937.2012.710695. [DOI] [Google Scholar]
- 9.Panchal SK, Ward L, Brown L. Ellagic acid attenuates high-carbohydrate, high-fat diet-induced metabolic syndrome in rats. Eur J Nutr. 2013;52:559–568. doi: 10.1007/s00394-012-0358-9. [DOI] [PubMed] [Google Scholar]
- 10.White DL, Kanwal F, El-Serag HB. Association between nonalcoholic fatty liver disease and risk for hepatocellular cancer, based on systematic review. Clin Gastroenterol Hepatol. 2012;10:1342–1359. doi: 10.1016/j.cgh.2012.10.001. [DOI] [PMC free article] [PubMed] [Google Scholar]
- 11.Saad H, Charrier-El Bouhtoury F, Pizzi A, Rode K, Charrier B, Ayed N. Characterization of pomegranate peels tannin extractives. Ind Crops Prod. 2012;40:239–246. doi: 10.1016/j.indcrop.2012.02.038. [DOI] [Google Scholar]
- 12.Ahmed A, Al Tamimi DM, Isab AA, Alkhawajah AMM, Shawarby MA. Histological changes in kidney and liver of rats due to gold (III) compound [Au(en)Cl2]Cl. PLoS One. 2012;7:e51889. doi: 10.1371/journal.pone.0051889. [DOI] [PMC free article] [PubMed] [Google Scholar]
- 13.Oliveira CP, Coelho AM, Barbeiro HV, Lima VM, Soriano F, Ribeiro C, Molan NA, Alves VA, Souza HP, Machado MC, Carrilho FJ. Liver mitochondrial dysfunction and oxidative stress in the pathogenesis of experimental nonalcoholic fatty liver disease. Braz J Med Biol Res. 2006;39:189–194. doi: 10.1590/S0100-879X2006000200004. [DOI] [PubMed] [Google Scholar]
- 14.Ok E, Do GM, Lim Y, Park JE, Park YJ, Kwon O. Pomegranate vinegar attenuates adiposity in obese rats through coordinated control of AMPK signaling in the liver and adipose tissue. Lipids Health Dis. 2013;12:163. doi: 10.1186/1476-511X-12-163. [DOI] [PMC free article] [PubMed] [Google Scholar]
- 15.Grattagliano I, de Bari O, Bernardo TC, Oliveira PJ, Wang DQ, Portincasa P. Role of mitochondria in nonalcoholic fatty liver disease-from origin to propagation. Clin Biochem. 2012;45:610–618. doi: 10.1016/j.clinbiochem.2012.03.024. [DOI] [PubMed] [Google Scholar]
- 16.Grattagliano I, Portincasa P, Palmieri VO, Palasciano G. Managing nonalcoholic fatty liver disease: recommendations for family physicians. Can Fam Physician. 2007;53:857–863. [PMC free article] [PubMed] [Google Scholar]
- 17.Guizani N, Waly MI, Ali A, Al-Saidi G, Singh V, Bhatt N, Rahman MS. Papaya epicarp extract protects against hydrogen peroxide-induced oxidative stress in human SH-SY5Y neuronal cells. Exp Biol Med. 2011;236:1205–1210. doi: 10.1258/ebm.2011.011031. [DOI] [PubMed] [Google Scholar]
- 18.Guizani N, Waly MI, Singh V, Rahman MS. Nabag (Zizyphus spina-christi) extract prevents aberrant crypt foci development in colons of azoxymethane-treated rats by abrogating oxidative stress and inducing apoptosis. Asian Pac J Cancer Prev. 2013;14:5031–5035. doi: 10.7314/APJCP.2013.14.9.5031. [DOI] [PubMed] [Google Scholar]
- 19.Halliwell B. Are polyphenols antioxidants or pro-oxidants? What do we learn from cell culture and in vivo studies? Arch Biochem Biophys. 2008;476:107–112. doi: 10.1016/j.abb.2008.01.028. [DOI] [PubMed] [Google Scholar]
- 20.Fernández Gianotti T, Burgueño A, Gonzales Mansilla N, Pirola CJ, Sookoian S. Fatty liver is associated with transcriptional downregulation of stearoyl-CoA desaturase and impaired protein dimerization. PLoS One. 2013;8:e76912. doi: 10.1371/journal.pone.0076912. [DOI] [PMC free article] [PubMed] [Google Scholar]
- 21.Ashoush IS, El-Batawy OI, El-Shourbagy GA. Antioxidant activity and hepatoprotective effect of pomegranate peel and whey powders in rats. Ann Agric Sci. 2013;58:27–32. [Google Scholar]
- 22.Battino M, Quiles JL, Huertas JR, Ramirez-Tortosa MC, Cassinello M, Mañas M, Lopez-Frias M, Mataix J. Feeding fried oil changes antioxidant and fatty acid pattern of rat and affects rat liver mitochondrial respiratory chain components. J Bioenerg Biomembr. 2002;34:127–134. doi: 10.1023/A:1015128009826. [DOI] [PubMed] [Google Scholar]
- 23.Ben-Ali M, Dhouib K, Damak M, Allouche N. Stabilization of sunflower oil during accelerated storage: use of basil extract as a potential alternative to synthetic antioxidants. Int J Food Prop. 2014;17:1547–1559. doi: 10.1080/10942912.2012.723659. [DOI] [Google Scholar]
- 24.Bostock-Cox B. Liver disease-what you need to know and what you need to do. Practice Nurse. 2014;44:30–34. [Google Scholar]
- 25.Cam M, Hisil Y, Durmaz G. Characterisation of pomegranate juices from ten cultivars grown in Turkey. Int J Food Prop. 2009;12:388–395. doi: 10.1080/10942910701813917. [DOI] [Google Scholar]
- 26.Castro-Giráldez M, Fito PJ, Ortolá MD, Balaguer N. Study of pomegranate ripening by dielectric spectroscopy. Postharvest Biol Technol. 2013;86:346–353. doi: 10.1016/j.postharvbio.2013.07.024. [DOI] [Google Scholar]
- 27.Obembe AO, Owu DU, Okwari OO, Antai AB, Osim EE. Intestinal fluid and glucose transport in Wistar rats following chronic consumption of fresh or oxidised palm oil diet. ISRN Gastroenterol. 2011;2011:972838. doi: 10.5402/2011/972838. [DOI] [PMC free article] [PubMed] [Google Scholar]
- 28.American Oil Chemists’ Society. Official Methods and Recommended Practices of the AOCS. AOCS Press; Urbana, IL, USA: 1999. Acid value: AOCS method number: Cd 3d-63. [Google Scholar]
- 29.American Oil Chemists’ Society. Official Methods and Recommended Practices of the AOCS. AOCS Press; Urbana, IL, USA: 1996. Peroxide value acetic acid–chloroform method: AOCS method number: Cd 8–53. [Google Scholar]
- 30.American Oil Chemists’ Society. Official Methods and Recommended Practices of the AOCS. AOCS Press; Urbana, IL, USA: 2000. p-Anisidine value: AOCS method number: Cd 18–90. [Google Scholar]
- 31.AOAC. AOAC official method 969.33: fatty acids in oils and fats. Association of Official Analytical Chemists; Gaitherburg, MD, USA: 2000. [Google Scholar]
- 32.American Oil Chemists’ Society. Official Methods and Recommended Practices of the AOCS. AOCS Press; Urbana, IL, USA: 1990. Determination of tocopherols and tocotrienols in vegetable oils and fats by HPLC: AOCS method number: Ce 8–89. [Google Scholar]
- 33.Lowry OH, Rosebrough NJ, Farr AL, Randall RJ. Protein measurement with the Folin phenol reagent. J Biol Chem. 1951;193:265–275. [PubMed] [Google Scholar]
- 34.De Leonardis A, Macciola V. Heat-oxidation stability of palm oil blended with extra virgin olive oil. Food Chem. 2012;135:1769–1776. doi: 10.1016/j.foodchem.2012.06.046. [DOI] [PubMed] [Google Scholar]
- 35.Boler DD, Fernández-Dueñas DM, Kutzler LW, Zhao J, Harrell RJ, Campion DR, McKeith FK, Killefer J, Dilger AC. Effects of oxidized corn oil and a synthetic antioxidant blend on performance, oxidative status of tissues, and fresh meat quality in finishing barrows. J Anim Sci. 2012;90:5159–5169. doi: 10.2527/jas.2012-5266. [DOI] [PubMed] [Google Scholar]
- 36.Lioudaki E, Ganotakis ES, Mikhailidis DP. Liver enzymes: potential cardiovascular risk markers? Curr Pharm Des. 2011;17:3632–3643. doi: 10.2174/138161211798220945. [DOI] [PubMed] [Google Scholar]
- 37.Baršić N, Lerotić I, Smirčić-Duvnjak L, Tomašić V, Duvnjak M. Overview and developments in noninvasive diagnosis of nonalcoholic fatty liver disease. World J Gastroenterol. 2012;18:3945–3954. doi: 10.3748/wjg.v18.i30.3945. [DOI] [PMC free article] [PubMed] [Google Scholar]
- 38.Owu DU, Osim EE, Ebong PE. Serum liver enzymes profile of Wistar rats following chronic consumption of fresh or oxidized palm oil diets. Acta Tropica. 1998;69:65–73. doi: 10.1016/S0001-706X(97)00115-0. [DOI] [PubMed] [Google Scholar]
- 39.Takahashi Y, Soejima Y, Fukusato T. Animal models of nonalcoholic fatty liver disease/nonalcoholic steatohepatitis. World J Gastroenterol. 2012;18:2300–2308. doi: 10.3748/wjg.v18.i19.2300. [DOI] [PMC free article] [PubMed] [Google Scholar]
- 40.Mukherjee S, Ghosh S, Choudhury S, Adhikary A, Manna K, Dey S, Sa G, Das T, Chattopadhyay S. Pomegranate reverses methotrexate-induced oxidative stress and apoptosis in hepatocytes by modulating Nrf2-NF-κB pathways. J Nutr Biochem. 2013;24:2040–2050. doi: 10.1016/j.jnutbio.2013.07.005. [DOI] [PubMed] [Google Scholar]
- 41.Takahashi Y, Soejima Y, Kumagai A, Watanabe M, Uozaki H, Fukusato T. Japanese herbal medicines shosaikoto, inchinkoto, and juzentaihoto inhibit high-fat diet-induced non-alcoholic steatohepatitis in db/db mice. Pathol Int. 2014;64:490–498. doi: 10.1111/pin.12199. [DOI] [PubMed] [Google Scholar]
- 42.Xu KZ, Zhu C, Kim MS, Yamahara J, Li Y. Pomegranate flower ameliorates fatty liver in an animal model of type 2 diabetes and obesity. J Ethnopharmacol. 2009;123:280–287. doi: 10.1016/j.jep.2009.03.035. [DOI] [PubMed] [Google Scholar]
- 43.Kathirvel E, Morgan K, French SW, Morgan TR. Acetyl-L-carnitine and lipoic acid improve mitochondrial abnormalities and serum levels of liver enzymes in a mouse model of nonalcoholic fatty liver disease. Nutr Res. 2013;33:932–941. doi: 10.1016/j.nutres.2013.08.001. [DOI] [PubMed] [Google Scholar]
- 44.Uhl P, Fricker G, Haberkorn U, Mier W. Current status in the therapy of liver diseases. Int J Mol Sci. 2014;15:7500–7512. doi: 10.3390/ijms15057500. [DOI] [PMC free article] [PubMed] [Google Scholar]
- 45.Valls V, Goicoechea M, Muñiz P, Saez GT, Cabo JR. Effect of corn oil and vitamin E on the oxidative status of adipose tissues and liver in rat. Food Chem. 2003;81:281–286. doi: 10.1016/S0308-8146(02)00425-9. [DOI] [Google Scholar]


