

Abstract
Background
Folate-sensitive neural tube defects (NTDs) are an important, preventable cause of morbidity and mortality worldwide. There is a need to describe the current global burden of NTDs and identify gaps in available NTD data.
Methods and Findings
We conducted a systematic review and searched multiple databases for NTD prevalence estimates and abstracted data from peer-reviewed literature, birth defects surveillance registries, and reports published between January 1990 and July 2014 that had greater than 5,000 births and were not solely based on mortality data. We classified countries according to World Health Organization (WHO) regions and World Bank income classifications. The initial search yielded 11,614 results; after systematic review we identified 160 full text manuscripts and reports that met the inclusion criteria. Data came from 75 countries. Coverage by WHO region varied in completeness (i.e., % of countries reporting) as follows: African (17%), Eastern Mediterranean (57%), European (49%), Americas (43%), South-East Asian (36%), and Western Pacific (33%). The reported NTD prevalence ranges and medians for each region were: African (5.2–75.4; 11.7 per 10,000 births), Eastern Mediterranean (2.1–124.1; 21.9 per 10,000 births), European (1.3–35.9; 9.0 per 10,000 births), Americas (3.3–27.9; 11.5 per 10,000 births), South-East Asian (1.9–66.2; 15.8 per 10,000 births), and Western Pacific (0.3–199.4; 6.9 per 10,000 births). The presence of a registry or surveillance system for NTDs increased with country income level: low income (0%), lower-middle income (25%), upper-middle income (70%), and high income (91%).
Conclusions
Many WHO member states (120/194) did not have any data on NTD prevalence. Where data are collected, prevalence estimates vary widely. These findings highlight the need for greater NTD surveillance efforts, especially in lower-income countries. NTDs are an important public health problem that can be prevented with folic acid supplementation and fortification of staple foods.
Introduction
Neural tube defects (NTDs), serious birth defects of the brain and spine, are a major, preventable public health burden. Globally, it is estimated that approximately 300,000 babies are born each year with NTDs [1], resulting in approximately 88,000 deaths and 8.6 million disability-adjusted life years (DALYs) [2, 3]. In low income countries, NTDs may account for 29% of neonatal deaths due to observable birth defects [4]. As morbidity and mortality from infectious diseases are decreasing worldwide, the contribution of birth defects to under-5 morbidity and mortality will continue to increase proportionally [5].
Conclusive evidence from clinical trials has led to recommendations for adequate periconceptional folic acid intake to reduce the occurrence of a NTD-affected pregnancy [6]; as a result, mandatory folic acid fortification (FAF) of staple cereal grains has been legislated in many countries as recently reviewed [7, 8]. Long-term surveillance of NTDs in countries that have successfully implemented fortification, such as the United States, Canada, Costa Rica, South Africa, and Chile, and data from a supplementation program in China suggest that folic acid interventions can reduce NTD prevalence to as low as 5–6 per 10,000 pregnancies [8, 9].
Because birth defects are a major cause of under-5 mortality, adequate surveillance data are needed for prevention and evaluation purposes. This is particularly important for birth defects that have well-established interventions. For example, depending on the baseline prevalence, it is estimated that the majority of NTDs can be prevented with folic acid [4, 10]. However, national surveillance of NTDs and other birth defects remains limited worldwide. To promote global birth defects surveillance efforts, in 2010 the World Health Assembly issued a resolution urging member states “to develop and strengthen registration and surveillance systems for birth defects” [11].
There have been recent efforts to model and estimate the worldwide burden of NTDs and other major birth defects [1, 12]. Some data are also available from systematic reviews, but most of the reviews are specific to certain regions or income levels [13–15]. However, an accurate estimate of the prevalence of NTDs in most countries is still unknown primarily due to insufficient and fragmented data collection. To complement previous efforts, the goal of our review is to describe the most current prevalence estimates of NTDs worldwide, while highlighting key methodological differences and gaps in available data.
Methods
Search Strategy
We followed the Preferred Reporting Items for Systematic Reviews and Meta-Analyses (PRISMA) guidelines (S1 Document) [16]. We searched the following bibliographic databases for English and Spanish language literature published between January 1990 and July 2014: the Cochrane Collaboration, CINAHL, Embase, POPLINE, PubMed, Global Health (CDC resource), Web of Science, and several World Health Organization (WHO) library resources (African Index Medicus, Index Medicus for the Eastern Mediterranean Region, Spanish Health Sciences Bibliographic Index, Index Medicus for the South-East Asian Region, Latin American and Caribbean Health Sciences Literature, and the World Health Organization Library Information System). We adapted the search terms to each database and included keywords for neural tube defects, congenital anomalies, epidemiology, registries, and hospitals. We also identified international birth defect registries and searched the databases/reports of the European Surveillance of Congenital Anomalies (EUROCAT), the International Clearinghouse for Birth Defects Surveillance and Research (ICBDSR), and other reports. Finally, we included additional studies and reports from hand searching reference lists of systematic reviews.
Inclusion/Exclusion Criteria and Algorithm Review
We included case-control and cross-sectional studies and reports with either a reported prevalence of NTDs (defined as anencephaly/spina bifida/encephalocele), or numerator (number of reported NTD cases) and denominator data (number of births in the study population). Many studies reported on NTDs without explaining how they defined them; we included these studies in order to increase coverage.
We excluded the following: 1) case reports and supplementation trials; 2) studies that only included anencephaly and/or encephalocele; 3) studies that only counted non-NTDs per our definition, such as amniotic band sequence, chromosomal abnormalities, or spina bifida occulta; 4) studies with a denominator of fewer than 5,000 total births given the high degree of uncertainty of NTD prevalence in such a small sample size; 5) studies that reported prevalence in graphs without point estimates; 6) studies that only used mortality data; 7) studies with data based only on prenatal diagnosis; 8) and studies whose data were collected prior to 1990. We also excluded studies that reported data after a contamination event that may have caused an increase in NTD prevalence estimates.
We developed an algorithm to ensure that the most current and relevant data for each country were included in our review. If multiple studies were available for the same region or country but at different time periods, we included the study with the most recent data. In instances where multiple studies existed for one country from different geographic locations, all studies from that country were included, except if nationally representative data were available. In these cases, only the nationally representative study was used. However, if one study reported nationwide data that were not nationally representative, we still included studies from individual regions.
Data Abstraction and Risk-of-Bias (RoB) Assessment
We abstracted data on the number of cases (numerator), the birth cohort (denominator), and calculated prevalence into a standard table. Three authors reviewed the abstracted data from the original reports and corrected errors in both abstraction and the original reports. To verify the reported prevalence estimates and to exclude syndromes, chromosomal abnormalities, isolated hydrocephalus, and spina bifida occulta cases, we re-calculated the prevalence of anencephaly, spina bifida, and encephalocele. We also calculated a sum of reported NTDs, which included spina bifida and/or anencephaly and encephalocele, depending on what NTDs the authors of the original study assessed. In addition to prevalence, we also abstracted the following information for each study: years included, geographic location, inclusion/exclusion criteria, study design (population-based vs. hospital-based), and whether the data were gathered from a birth defects registry/surveillance system. We did not distinguish between registries and surveillance systems in this review.
We developed and pre-piloted a risk-of-bias (RoB) tool to assess the quality of each study’s methodology. A study’s RoB score was based on the following components: study design, case ascertainment methods, case definition, representativeness, and limitations. The lower the RoB score, the less the study was considered to be prone to bias. Two authors reviewed each study independently and their scores were averaged for a single RoB score (possible score range: 0.0–18.0). We placed final RoB scores into quartiles: low (0.0–5.4), moderately low (5.5–7.9), moderately high (8.0–10.9), or high (11.0–18.0). We assigned the lowest RoB scores to studies that: were based on surveillance systems or registries; were population-based; were representative (as defined by the original authors to accurately describe their population of interest); included an NTD case definition; defined inclusion and exclusion criteria (e.g., gestational age, birth weight, birth outcome); and had case reporting from multiple sources.
Analysis
As part of our analyses, we stratified countries by WHO regions, World Bank income levels (low, lower-middle, upper-middle, high), presence of a surveillance system/registry, and RoB quartiles [17, 18]. For publications that did not provide NTD prevalence, we calculated the sum of reported NTDs and individual NTD type-specific prevalence estimates. In addition, if it was not provided by the reference, we calculated the 95% confidence interval for each prevalence using the Poisson distribution if the number of cases was below 30, and using the binomial distribution if the number of cases was greater than or equal to 30. We calculated the range and median reported NTD prevalence for each WHO region.
We used ArcGIS 10.2.1 (ESRI, Redlands, California) to create maps illustrating NTD prevalence distributions and registry/surveillance coverage. On the maps, NTD prevalence was classified into quintiles based on all reported prevalence estimates. If there were national data, the entire country was filled-in. In Europe, if regional data were available, this geographical level was also filled-in. In instances where multiple prevalence estimates were available at the national level, the prevalence reported by the study/report with the least RoB was selected. Graphical representations of data were created using SigmaPlot 12.5 (Systat Software, San Jose, California).
Results
PRISMA
The literature search yielded 11,614 results, of which 3,948 were duplicates. Two authors reviewed and screened the 7,666 unique titles and abstracts for inclusion and exclusion criteria. After this initial screening, we excluded 6,549 abstracts and conducted the first wave of full-text review for the remaining 1,117 citations, in which 600 more were excluded. We then evaluated the remaining 517 citations and an additional 66 hand-searched sources from reports such as ICBDSR and author contacts to ensure the most relevant sources (i.e., most up-to-date data) were included. We identified 160 unique studies and reports published between January 1990 and July 2014 that met our inclusion criteria in the final stage of review (Fig 1).
Fig 1. PRISMA Flowchart.

The results represent data from 75 countries. Among the 194 WHO member states, the percent reporting within each region is as follows: African (8/47; 17%), Eastern Mediterranean (12/21; 57%), European (26/53; 49%), Americas (15/35; 43%), South-East Asian (4/11; 36%) and Western Pacific (9/27; 33%). Of the countries in our review, 46% have high, 31% have upper-middle, 16% have lower-middle, and 7% have low income status as defined by the World Bank.
Of the 160 studies, 2% reported spina bifida alone, 10% spina bifida and anencephaly, 1% spina bifida and encephalocele, and 81% reported all 3 conditions (either stratified or not). Six percent of studies did not provide a clear definition of how they defined NTDs.
Prevalence of Neural Tube Defects
This systematic review demonstrates great variability in reported NTD prevalence estimates globally (range: 0.3–199.4 per 10,000 births) (Table 1) [19–124]. Of note, both the lowest and highest point estimates in this global range came from studies conducted in different regions of China; Beijing [113] and Luliang [112], respectively. However, even after excluding these estimates, the global range is still quite variable (range: 1.2–124.1 per 10,000 births) (Table 1) [122, 48]. Fig 2 also illustrates that NTD prevalence estimates throughout the world are high, with approximately 80% of reported prevalence estimates above 6.0 per 10,000 births (i.e., the approximate rate that should be attainable through adequate periconceptional folic acid intake) [8].
Table 1. Neural Tube Defect (NTD) Prevalence Estimates by World Health Organization (WHO) Region*.
| Country | World Bank Classification | Location | Author | Year(s) Included | Prevalence Rate per 10,000 Births | |||||||
|---|---|---|---|---|---|---|---|---|---|---|---|---|
| Anencephaly | Spina bifida | Encephalocele | Sum of Reported NTDs¥ | |||||||||
| Prevalence | 95% CI | Prevalence | 95% CI | Prevalence | 95% CI | Prevalence | 95% CI | |||||
| AFRICA | ||||||||||||
| Algeria | Upper-middle | Setif | Houcher, et al.[19] | 2004–2006 | 32.2 | (25.6, 38.8) | 42.8[f] | (35.2, 50.4) | 0.3 | (0.0, 2.0) | 75.4 | (65.4, 85.4) |
| Cameroon | Lower-middle | Yaounde | Njamnshi AK, et al.[20] | January 1997- December 2006 | 18.6 | (14.9, 22.3) | ||||||
| Democratic Republic of Congo | Low | Nyankunde, Oriental Province | Ahuka OL, et al.[21] | January 1993–August 2001 | 1.1 | (0.0, 6.3) | 6.8 | (2.5, 14.8) | 2.3 | (0.3, 8.2) | 10.2 | (4.7, 19.4) |
| Ghana | Lower-middle | Accra | Anyebuno M, et al.[22] | January 1991–December 1992 | 8.4 | (4.8, 13.6) | 3.1 | (1.2, 6.8) | 11.5 | (7.2, 17.4) | ||
| Malawi | Low | Blantyre | Msamati BC, et al.[23] | 1998–1999 | 6.3 | (3.6, 10.2) | 6.3 | (3.6, 10.2) | ||||
| Nigeria | Lower-middle | Cross River and Akwa Ibom States | Ekanem TB, et al.[24] | 1980–2003 | 1.6 | (1.0, 2.4) | 3.7 | (2.7, 4.8) | 5.2 | (4.0, 6.5) | ||
| Nigeria | Lower-middle | Jos | Airede KI [25] | June 1987–June 1990 | 3.3 | (0.4, 12.1) | 41.8 | (27.1, 61.7) | 13.4 | (5.8, 26.4) | 58.6[a] | (39.3, 78.0) |
| South Africa | Upper-middle | Eastern Cape, Kwazulu Natal, Mpumalanga, and Free State Provinces | Sayed AR, et al.[26] | October 2004–June 2005 | 3.7 | (2.2, 5.9) | 5.4 | (3.5, 8.0) | 9.8 | (6.9, 12.7) | ||
| South Africa | Upper-middle | Sovenga, Northern Transvaal | Venter PA, et al.[27] | June 1989–December 1992 | 17.1 | (9.1, 29.2) | 15.8 | (8.1, 27.5) | 2.6 | (0.3, 9.5) | 35.4 | (23.4, 51.6) |
| South Africa | Upper-middle | Cape Town | Viljoen DL, et al. [28] | 1973–1992 | 11.7 | (10.8, 12.6) | ||||||
| Tanzania | Low | Dar es Salaam | Kinasha AD and Manji K [29] | 2000–2002 | 1.2 | (0.3, 3.0) | 26.1 | (20.7, 31.5) | 2.9 | (1.4, 5.4) | 30.2 | (24.4, 36.0) |
| EASTERN MEDITERRANEAN | ||||||||||||
| Egypt | Lower-middle | Upper Egypt | Mohammed YA, et al.[30] | March 2007–October 2007 | 2.0 | (0.1, 11.1) | 10.0 | (3.3, 23.3) | 4.0 | (0.5, 14.5) | 16.0[b] | (6.9, 31.5) |
| Iran | Upper-middle | Yasuj, South West Iran | Ebrahimi S, et al.[31] | March 2008–February 2011 | 38.1 | (24.9, 51.3) | ||||||
| Iran | Upper-middle | Ahvaz | Behrooz AG and Gorjizadeh MH [32] | March 2002–March 2004 | 24.9 | (16.4, 33.4) | 15.1 | (9.2, 23.3) | 2.3 | (0.5, 6.6) | 42.2 | (31.2, 53.3) |
| Iran | Upper-middle | Gorgan, Golestan | Abdollahi Z, et al.[33] | December 2007–December 2008 | 21.9 | N/A | ||||||
| Iran | Upper-middle | Tehran | Delshad S, et al.[34] | March 2005-March 2007 | 8.5 | (6.2, 10.8) | 1.6 | (0.8, 3.0) | 10.1 | (7.6, 12.7) | ||
| Iran | Upper-middle | Birjand | Afshar M, et al.[35] | April 1997–December 2001 | 15.5 | (10.1, 22.7) | 8.9 | (5.0, 14.7) | 1.8 | (0.4, 5.2) | 29.8 | (21.6, 38.0) |
| Iran | Upper-middle | Urmia | Rad IA, et al.[36] | January 2001–June 2005 | 55.2 | (43.0, 67.5) | 24.8 | (16.6, 33.0) | 2.8 | (0.8, 7.3) | 82.9 | (67.9, 97.8) |
| Iran | Upper-middle | Hamadan Province | Farhud DD, et al.[37] | 1991–1997 | 15.6 | (8.1, 25.9) | 7.0 | (2.6, 15.2) | 50.1 | (35.2, 65.0) | ||
| Iran | Upper-middle | Tabriz | ICBDSR 2011 Report [38] | 2009 | 4.7 | (2.4, 8.5) | 0.9 | (0.1, 3.1) | 0.9 | (0.1, 3.1) | 6.5 | (3.6, 10.7) |
| Iraq | Upper-middle | Al-Ramadi, Al-Anbar Governate | Al-Ani ZR, et al.[39] | October 2010 –October 2011 | 3.5 | (0.4, 12.6) | 15.7 | (7.2, 29.8) | 8.7 | (2.8, 20.3) | 27.9[a] | (15.9, 45.2) |
| Iraq | Upper-middle | Basrah | Al-Sadoon I, et al.[40] | 1990 | 2.5 | (0.5, 7.2) | 7.4 | (3.4, 14.1) | 9.9 | (5.1, 17.2) | ||
| Jordan | Upper-middle | North Jordan | Amarin ZO and Obeidat AZ [41] | 2005–2006 | 9.5 | (5.5, 15.5) | ||||||
| Jordan | Upper-middle | Amman | Aqrabawi HE [42] | April 2002 –April 2003 | 0.0 | (0.0, 7.3) | 59.0 | (37.9, 80.0) | 3.9 | (0.5, 14.2) | 62.9[a] | (41.2, 84.6) |
| Jordan | Upper-middle | Amman | Masri AT [43] | 1993–2002 | 3.5[c] | (1.7, 6.5) | 7.1[c] | (4.3, 10.9) | 0.4[c] | (0.0, 2.0) | 11.0[c] | (7.1, 14.8) |
| Jordan | Upper-middle | Irbid Province | Daoud AS, et al.[44] | January 1991–December 1993 | 3.7 | (2.4, 5.0) | 10.0 | (7.9, 12.1) | 2.6 | (1.7, 4.0) | 16.4 | (13.7, 19.1) |
| Kuwait | Upper-middle | Al-Jahara Region | Madi SA, et al.[45] | January 2000–December 2001 | 3.9 | (0.8, 11.3) | 2.6 | (0.3, 9.3) | 6.5 | (2.1, 15.1) | ||
| Libya | Upper-middle | Benghazi | Singh R and Al-Sudani O [46] | 1995 | 7.4 | (3.8, 13.0) | 0.6 | (0.0, 3.4) | 8.0 | (4.3, 13.7) | ||
| Oman | High | National | Alasfoor D and ElSayed MK [47] | 2010 | 6.8 | N/A | 23.2 | N/A | ||||
| Pakistan | Lower-middle | Swat | Khattak ST, et al.[48] | Januray 2007–December 2007 | 113.3 | (85.5, 141.1) | 7.2 | (2.0, 18.4) | 124.1[d] | (95.0, 153.2) | ||
| Pakistan | Lower-middle | Peshawar | Qazi G [49] | Januray 2009–December 2009 | 47.2 | (30.3, 70.2) | 21.6 | (10.8, 38.7) | 68.8 | (46.1, 91.6) | ||
| Pakistan | Lower-middle | Karachi | Perveen F and Tyyab S [50] | January 2000–October 2005 | 29.4 | (17.2, 47.1) | 15.6 | (7.1, 29.6) | 5.2 | (1.1, 15.2) | 50.2 | (33.6, 72.1) |
| Pakistan | Lower-middle | Lahore | Najmi RS [51] | November 1994–October 1996; August 1997–March 1998 | 29.6 | (19.5, 39.7) | 17.0 | (10.3, 26.6) | 2.7 | (0.6, 7.9) | 49.3 | (36.3, 62.3) |
| Pakistan | Lower-middle | Karachi | Jooma R [52] | 2002 | 19.8 | (11.6, 30.0) | 15.7 | (8.5, 25.0) | 3.1 | (0.6, 8.9) | 38.6 | (26.4, 50.9) |
| Qatar | High | Doha | Bener A, et al.[53] | January 1985–December 2009 | 3.6 | (2.9, 4.3) | 7.3 | (6.4, 8.4) | 10.9 | (9.7, 12.2) | ||
| Saudi Arabia | High | Al-Khobar | Al-Jama F, et al.[54] | January 1992–December 1997 | 22.4 | (14.8, 30.0) | 25.7 | (17.5, 33.9) | 5.4 | (2.3, 10.7) | 53.5 | (41.7, 65.3) |
| Saudi Arabia | High | Asir Region | Asindi A and Al-Shehri A.[55] | January 1995–December 1998 | 0.4 | (0.1, 1.1) | 5.6 | (4.0, 7.2) | 1.6[a] | (0.8, 2.7) | 7.5[a] | (5.6, 9.4) |
| Saudi Arabia | High | Jeddah | Safdar OY, et al.[56] | 2001–2005 | 7.6 | N/A | ||||||
| Saudi Arabia | High | Al-Madinah Al-Munawarah | Murshid WR [57] | April 1996–March 1997 | 10.9 | (6.5, 17.2) | 10.9 | (6.5, 17.2) | ||||
| Saudi Arabia | High | Riyadh | Hakami WS and Majeed-Saidan MA [58] | January 2001–December 2010 | 4.5 | (3.2, 5.9) | ||||||
| Sudan | Lower-middle | Omdurman | Elsheikh GEA and Ibrahim SA [59] | February 2003–January 2004 | 12.5 | (7.4, 17.6) | 16.3 | (10.5, 22.1) | 4.9 | (2.2, 9.3) | 33.7[a] | (25.3, 42.1) |
| United Arab Emirates | High | National | Al Hosani H, et al.[60] | January 1999–December 2001 | 2.1[f] | (1.4, 2.8) | ||||||
| EUROPE | ||||||||||||
| Austria | High | Styria | EUROCAT [61] | 2003–2009 | 1.7 | (0.9, 2.9) | 4.6 | (3.1, 6.4) | 1.5 | (0.8, 2.7) | 7.7 | (5.8, 10.0) |
| Belgium | High | Antwerp | EUROCAT [61] | 2003–2012 | 2.6 | (2.0, 3.5) | 4.5 | (3.6, 5.5) | 0.8 | (0.5, 1.4) | 8.0 | (6.8, 9.3) |
| Belgium | High | Hainaut | EUROCAT [61] | 2003–2012 | 3.2 | (2.3, 4.4) | 4.1 | (3.1, 5.4) | 1.2 | (0.7, 2.0) | 8.5 | (7.0, 10.3) |
| Bulgaria | Upper-middle | Plevin Region | Kovacheva K, et al.[62] | 1988–2006 | 20.2 | (16.2, 24.2) | ||||||
| Croatia | High | Zagreb | EUROCAT [61] | 2003–2012 | 2.0 | (1.1, 3.3) | 1.4 | (0.7, 2.6) | 1.1 | (0.5, 2.2) | 4.5 | (3.1, 6.4) |
| Czech Republic | High | National | EUROCAT [61] | 2003–2010 | 2.4 | (2.1, 2.8) | 3.9 | (3.5, 4.3) | 1.3 | (1.0, 1.5) | 7.6 | (7.0, 8.2) |
| Denmark | High | National | Pasternak B, et al.[63] | 1997–2011 | 5.5 | (4.1, 6.8) | ||||||
| Denmark | High | Odense | EUROCAT [61] | 2003–2012 | 4.1 | (2.5, 6.2) | 5.8 | (3.9, 8.3) | 1.5 | (0.7, 3.1) | 11.4 | (8.7, 14.7) |
| Finland | High | National | EUROCAT [61] | 2003–2011 | 3.2 | (2.7, 3.7) | 4.0 | (3.5, 4.6) | 1.9 | (1.5, 2.3) | 9.0 | (8.3, 9.9) |
| France | High | Bas-Rhin | Stoll C, et al.[64] | 1979–2008 | 4.3[a] | (3.7, 4.9) | 4.8[a] | (4.1, 5.5) | 1.2[a] | (0.9, 1.5) | 10.3[a] | (9.3, 11.3) |
| France | High | Auvergne | EUROCAT [61] | 2002 | 2.2 | (0.4, 6.6) | 3.0 | (0.8, 7.7) | 3.0 | (0.8, 7.7) | 8.2 | (4.1, 14.7) |
| France | High | French West Indies | EUROCAT [61] | 2009–2012 | 3.3 | (1.8, 5.6) | 4.0 | (2.3, 6.5) | 1.2 | (0.4, 2.8) | 8.5 | (6.0, 11.8) |
| France | High | Ile de la Reunion | EUROCAT [61] | 2003–2012 | 7.3 | (6.0, 8.8) | 9.1 | (7.6, 10.8) | 2.0 | (1.3, 2.9) | 18.4 | (16.3, 20.7) |
| France | High | Paris | EUROCAT [61] | 2003–2012 | 4.7 | (3.9, 5.6) | 5.1 | (4.3, 6.1) | 1.8 | (1.3, 2.4) | 11.6 | (10.3, 13.0) |
| Germany | High | Northern Rhine Region | Klusmann A, et al.[65] | January 1996 -December 2003 | 1.9 | (1.6, 2.2) | 4.4 | (3.9, 4.9) | 0.8 | (0.6, 1.0) | 7.1 | (6.5, 7.7) |
| Germany | High | Mainz | EUROCAT [61] | 2003–2011 | 3.8 | (1.9, 6.9) | 6.6 | (4.0, 10.4) | 3.5 | (1.7, 6.4) | 14.0 | (10.0, 19.0) |
| Germany | High | Saxony-Anhalt | EUROCAT [61] | 2003–2012 | 2.0 | (1.4, 2.8) | 5.6 | (4.6, 6.9) | 1.4 | (0.9, 2.1) | 9.0 | (7.6, 10.5) |
| Hungary | Upper-middle | National | ICBDSR 2011 Report [38] | 2005–2009 | 2.0 | (1.6, 2.4) | 4.4 | (3.8, 5.0) | 0.6 | (0.4, 0.9) | 7.0 | (6.3, 7.7) |
| Ireland | High | National | McDonnell R, et al.[66] | 2009–2011 | 4.7 | (3.8, 5.6) | 5.1 | (4.2, 6.0) | 0.7 | (0.4, 1.1) | 10.4 | (9.1, 11.8) |
| Ireland | High | Cork & Kerry | EUROCAT [61] | 2003–2012 | 4.9 | (3.6, 6.5) | 5.4 | (4.0, 7.0) | 1.0 | (0.5, 1.9) | 11.3 | (9.2, 13.6) |
| Ireland | High | Dublin | EUROCAT [61] | 2003–2012 | 2.2 | (1.7, 2.9) | 3.0 | (2.4, 3.8) | 0.7 | (0.4, 1.1) | 5.9 | (5.0, 7.0) |
| Ireland | High | South East Ireland | EUROCAT [61] | 2003–2012 | 3.3 | (2.1, 4.9) | 5.0 | (3.6, 6.9) | 0.3 | (0.0, 1.0) | 8.6 | (6.6, 11.0) |
| Israel | High | National | Zlotogora J, et al.[67] | 2002–2004 | ||||||||
| Jews | 4.9 | N/A | 2.7 | N/A | 8.1 | N/A | ||||||
| Arabs and Druze | 8.2 | N/A | 6.2 | N/A | 16.7 | N/A | ||||||
| Israel | High | Multi-Regional | ICBDSR 2011 Report [38] | 2005–2009 | 1.3 | (0.8, 1.8) | 2.9 | (2.2, 3.6) | 0.5 | (0.2, 0.9) | 4.6 | (3.7, 5.5) |
| Italy | High | Emilia Romagna | EUROCAT [61] | 2003–2012 | 2.2 | (1.7, 2.7) | 2.7 | (2.2, 3.3) | 0.7 | (0.5, 1.0) | 5.6 | (4.9, 6.4) |
| Italy | High | Sicily | EUROCAT [61] | 2003–2004 | 0.5 | (0.1, 1.8) | 1.5 | (0.5, 3.3) | 0.0 | (0.0, 0.9) | 2.0 | (0.9, 3.9) |
| Italy | High | Tuscany | EUROCAT [61] | 2003–2012 | 1.9 | (1.5, 2.5) | 3.1 | (2.5, 3.8) | 0.7 | (0.4, 1.1) | 5.7 | (4.9, 6.6) |
| Italy | High | Campania | ICBDSR 2011 Report [38] | 2005–2009 | 3.6 | (2.9, 4.2) | 3.1 | (2.5, 3.8) | 1.0 | (0.6, 1.3) | 7.7 | (6.7, 8.7) |
| Italy | High | Lombardy | ICBDSR 2011 Report [38] | 2009 | 2.0 | (0.2, 7.1) | 2.0 | (0.2, 7.1) | 1.0 | (0.0, 5.5) | 4.9 | (1.6, 11.5) |
| Italy | High | North East Italy | ICBDSR 2011 Report [38] | 2005–2009 | 1.5 | (1.0, 2.0) | 2.5 | (1.9, 3.1) | 0.5 | (0.2, 0.8) | 4.5 | (3.7, 5.3) |
| Malta | High | National | EUROCAT [61] | 2003–2011 | 2.2 | (0.9, 4.3) | 6.3 | (4.0, 9.5) | 1.6 | (0.6, 3.6) | 10.2 | (7.2, 14.0) |
| Netherlands | High | Northern Netherlands | EUROCAT [61] | 2003–2012 | 2.6 | (1.9, 3.5) | 4.6 | (3.7, 5.7) | 0.6 | (0.3, 1.0) | 7.7 | (6.5, 9.1) |
| Norway | High | National | EUROCAT [61] | 2003–2012 | 3.5 | (3.0, 4.0) | 4.7 | (4.1, 5.2) | 0.9 | (0.7, 1.2) | 9.1 | (8.4, 9.9) |
| Poland | High | National | EUROCAT [61] | 2003–2010 | 0.8 | (0.7, 0.9) | 4.5 | (4.3, 4.8) | 0.6 | (0.5, 0.7) | 5.9 | (5.7, 6.2) |
| Poland | High | Wielkopolska | EUROCAT [61] | 2003–2010 | 1.2 | (0.8, 1.7) | 6.3 | (5.5, 7.3) | 1.0 | (0.7, 1.4) | 8.5 | (7.5, 9.6) |
| Portugal | High | South Portugal | EUROCAT [61] | 2003–2011 | 1.2 | (0.8, 1.9) | 1.8 | (1.2, 2.5) | 0.2 | (0.1, 0.6) | 3.2 | (2.4, 4.2) |
| Russia | High | Arkhangelskaja Oblast | Petrova JG and Vaktskjold A [68] | 1995–2004 | 10.7 | (9.0, 12.4) | 10.4 | (8.7, 12.1) | 21.1 | (18.7, 23.5) | ||
| Russia | High | Moscow | ICBDSR 2011 Report [38] | 2005–2009 | 2.9 | (2.3, 3.5) | 3.7 | (3.0, 4.4) | 1.1 | (0.7, 1.4) | 7.6 | (6.6, 8.6) |
| Slovak Republic | High | Multi-Regional | ICBDSR 2011 Report [38] | 2005–2009 | 0.9 | (0.6, 1.3) | 2.2 | (1.7, 2.8) | 0.7 | (0.4, 1.0) | 3.8 | (3.1, 4.5) |
| Spain | High | Barcelona | EUROCAT [61] | 2003–2007 | 4.9 | (3.4, 6.8) | 3.3 | (2.1, 4.9) | 0.8 | (0.3, 1.8) | 9.0 | (7.0, 11.4) |
| Spain | High | Basque Country | EUROCAT [61] | 2003–2011 | 5.2 | (4.2, 6.3) | 4.1 | (3.2, 5.2) | 0.7 | (0.4, 1.2) | 10.0 | (8.6, 11.5) |
| Spain | High | National | EUROCAT [61] | 2003–2012 | 0.3 | (0.2, 0.5) | 0.9 | (0.6, 1.1) | 0.2 | (0.1, 0.3) | 1.3 | (1.0, 1.6) |
| Spain | High | Valencia Region | EUROCAT [61] | 2007–2011 | 2.4 | (1.9, 3.1) | 2.4 | (1.9, 3.1) | 1.5 | (1.1, 2.1) | 6.4 | (5.5, 7.4) |
| Sweden | High | National | EUROCAT [61] | 2007–2011 | 2.8 | (2.4, 3.3) | 3.8 | (3.3, 4.3) | 1.0 | (0.7, 1.3) | 7.5 | (6.8, 8.3) |
| Switzerland | High | National | Poretti A, et al.[69] | January 2001–December 2007 | 1.8[a, b] | (1.0, 2.6) | 7.8[a] | (6.1, 9.5) | 1.1[a] | (0.6, 2.0) | 10.7[a] | (8.7, 12.6) |
| Switzerland | High | Vaud | EUROCAT [61] | 2003–2012 | 3.5 | (2.3, 5.2) | 4.5 | (3.1, 6.2) | 2.4 | (1.4, 3.7) | 10.4 | (8.2, 12.9) |
| Turkey | Upper-middle | Afyonkarahisar | Onrat ST, et al.[70] | July 2003–December 2004 | 13.9 | (7.2, 24.3) | 19.7 | (11.5, 31.5) | 2.3 | (0.3, 8.4) | 35.9 | (23.3, 48.5) |
| Turkey | Upper-middle | Izmir | Mandiracioglu A, et al.[71] | January 2000–December 2000 | 14.3[a, b] | (10.4, 18.2) | ||||||
| Turkey | Upper-middle | Multi-Regional | Tuncbilek E, et al.[72] | July 1993–June 1994 | 11.0 | (7.0, 16.3) | 13.2 | (8.4, 18.0) | 5.9 | (3.2, 10.2) | 30.1 | (22.9, 37.4) |
| Turkey | Upper-middle | Ankara | Himmetoglu O, et al.[73] | 1988–1995 | 34.9 | (22.6, 46.6) | ||||||
| Ukraine | Lower-middle | Rivne and Khmelnytsky Provinces[g] | EUROCAT [61] | 2005–2011 | 7.0 | (5.9, 8.2) | 9.0 | (7.8, 10.4) | 1.7 | (1.2, 2.4) | 17.7 | (16.0, 19.6) |
| United Kingdom | High | East Midlands and South Yorkshire | EUROCAT [61] | 2003–2012 | 4.9 | (4.4, 5.5) | 5.3 | (4.8, 5.9) | 1.0 | (0.8, 1.3) | 11.3 | (10.5, 12.1) |
| United Kingdom | High | Glasgow | EUROCAT [61] | 1990–2000 | 6.8 | (5.4, 8.4) | 7.8 | (6.3, 9.6) | 2.4 | (1.6, 3.4) | 16.9 | (14.7, 19.4) |
| United Kingdom | High | Merseyside and Chesire | EUROCAT [61] | 1995–1999 | 5.4 | (4.2, 6.7) | 6.5 | (5.2, 8.0) | 1.1 | (0.6, 1.8) | 12.9 | (11.1, 15.0) |
| United Kingdom | High | North West Thames | EUROCAT [61] | 2003–2004 | 5.0 | (3.7, 6.6) | 4.7 | (3.4, 6.3) | 1.2 | (0.6, 2.1) | 10.9 | (8.9, 13.2) |
| United Kingdom | High | Northern England | EUROCAT [61] | 2003–2012 | 5.8 | (5.0, 6.6) | 6.5 | (5.6, 7.4) | 1.6 | (1.2, 2.1) | 13.8 | (12.6, 15.1) |
| United Kingdom | High | South West England | EUROCAT [61] | 2005–2012 | 4.2 | (3.6, 4.9) | 5.2 | (4.5, 6.0) | 1.2 | (0.9, 1.6) | 10.7 | (9.7, 11.7) |
| United Kingdom | High | Thames Valley | EUROCAT [61] | 2003–2012 | 4.9 | (4.1, 5.8) | 4.8 | (4.0, 5.8) | 1.1 | (0.7, 1.6) | 10.8 | (9.6, 12.1) |
| United Kingdom | High | Wales | EUROCAT [61] | 2003–2012 | 5.1 | (4.4, 5.9) | 6.4 | (5.6, 7.3) | 2.0 | (1.5, 2.5) | 13.5 | (12.3, 14.8) |
| United Kingdom | High | Wessex | EUROCAT [61] | 2003–2012 | 5.9 | (5.1, 6.9) | 4.8 | (4.0, 5.7) | 1.0 | (0.6, 1.4) | 11.7 | (10.5, 13.0) |
| AMERICAS | ||||||||||||
| Argentina | Upper-middle | National | Groisman B, et al.[74] | November 2009–June 2012 | 3.6 | (2.9, 4.3) | 6.4 | (5.5, 7.7) | 1.9 | (1.5, 2.5) | 11.9 | (10.7, 13.2) |
| Argentina | Upper-middle | Multi-Regional | Lopez-Camelo JS, et al.[75] | 2005–2007 | 3.7 | (2.7, 4.6) | 6.6 | (5.3, 7.9) | 2.0 | (1.3, 2.8) | 12.2 | (10.5, 14.0) |
| Brazil | Upper-middle | National | Orioli IM, et al.[76] | 2006 | 1.4 | (1.3, 1.5) | 1.4 | (1.3, 1.5) | ||||
| Brazil | Upper-middle | Multi-Regional | Lopez-Camelo JS, et al. [75] | July 2005–December 2007 | 6.9 | (5.2, 8.6) | 14.2 | (11.8, 16.6) | 3.2 | (2.1, 4.4) | 24.3 | (21.2, 27.5) |
| Canada | High | National | ICBDSR 2011 Report [38] | 2005–2009 | 1.0 | (0.9, 1.2) | 3.0 | (2.7, 3.2) | 0.7 | (0.6, 0.8) | 4.6 | (4.3, 5.0) |
| Chile | High | Bio Bio, Los Lagos, Los Rios, Maule, Santiago Metropolitan, O'Higgins, Tarapaca, and Valparaiso Regions | Nazer J and Cifuentes L [77] | 2001–2010 | 3.7 | (3.0, 4.4) | 4.5 | (3.7, 5.3) | 1.7 | (1.2, 2.1) | 9.6 | (8.5, 10.7) |
| Chile | High | Multi-Regional | Lopez-Camelo JS, et al.[75] | 2001–2007 | 3.7 | (2.9, 4.4) | 4.6 | (3.8, 5.5) | 1.8 | (1.3, 2.3) | 10.1 | (8.8, 11.3) |
| Colombia | Upper-middle | Cali | Pachajoa H, et al.[78] | March 2004–October 2008 | 6.4 | (3.9, 9.7) | 7.3 | (4.7, 10.8) | 3.0 | (1.5, 5.6) | 16.7 | (12.3, 21.1) |
| Colombia | Upper-middle | Bogota, Ubate, and Manizales | Zarante I, et al.[79] | April 2001–January 2008 | 11.0 | (8.2, 13.8) | ||||||
| Colombia | Upper-middle | Bogota | ICBDSR 2011 Report [38] | 2009 | 1.6 | (0.5, 3.8) | 2.0 | (0.7, 4.3) | 0.0 | (0.0, 1.2) | 3.6 | (1.8, 6.5) |
| Colombia | Upper-middle | Baraya, Garzon, Neiva, and Palermo | Ostos H, et al.[80] | 1998 | 9.6 | (3.9, 19.8) | 9.6 | (3.9, 19.8) | 1.4 | (0.0, 7.7) | 20.6 | (11.5, 34.0) |
| Costa Rica | Upper-middle | National | de la Paz Barboza-Arguello M, et al.[81] | 2003–2012 | 4.8 | (4.3, 5.3) | ||||||
| Cuba | Upper-middle | National | ICBDSR 2011 Report [38] | 2005–2009 | 3.8 | (3.3, 4.3) | 4.4 | (3.9, 5.0) | 1.7 | (1.4, 2.1) | 10.0 | (9.2, 10.8) |
| Ecuador | Upper-middle | Multi-Regional | Gonzalez-Andrade F and Lopez-Pulles R [82] | 2001–2007 | 0.3 | (0.3, 0.4) | 2.5 | (2.3, 2.7) | 0.5 | (0.4, 0.6) | 3.3 | (3.1, 3.5) |
| Guatemala | Lower-middle | National | Acevedo CR, et al.[83] | 2001–2003 | 2.3 | (1.7, 2.9) | 22.7 | (20.8, 24.6) | 3.0 | (2.3, 3.7) | 27.9 | (25.8, 30.0) |
| Honduras | Lower-middle | Tegucigalpa | Hernandez R and Alvarenga R [84] | July 1998–September 2000 | 11.9 | (8.2, 15.5) | ||||||
| Mexico | Upper-middle | Monterrey, Nuevo Leon | Hernandez-Herrera RJ, et al.[85] | 1995–1999 | 6.5 | (5.1, 7.9) | 8.2 | (6.6, 9.7) | 1.3 | (0.8, 2.1) | 16.0 | (13.9, 18.2) |
| Mexico | Upper-middle | Guadalajara | Alfaro N, et al.[86] | 1988–1999 | 9.5 | (8.0, 10.9) | 10.3 | (8.8, 11.8) | 19.7 | (17.6, 21.8) | ||
| Mexico | Upper-middle | National | Navarrete Hernandez E, et al.[87] | 2009–2010 | 2.1 | (1.9, 2.2) | 1.2 | (1.1, 1.3) | 3.3 | (3.1, 3.5) | ||
| Mexico | Upper-middle | National | ICBDSR 2011 Report [38] | 2005–2009 | 4.6 | (3.3, 5.9) | 5.8 | (4.3, 7.2) | 1.6 | (0.9, 2.5) | 11.9 | (9.8, 14.1) |
| Peru | Upper-middle | Lima | Sanabria Rojas HA, et al.[88] | 2006–2010 | 1.9 | (1.1, 3.1) | 6.1[a] | (4.5, 7.8) | 0.1 | (0, 0.6) | 8.2[a] | (6.3, 10.0) |
| Uruguay | Upper-middle | Montevideo | Castilla EE, et al.[89] | 1999–2001 | 17.5 | (11.9, 23.1) | ||||||
| United States | High | National | Canfield MA, et al.[90] | 1999–2007 | 1.3 | (1.2, 1.4) | 3.2 | (3.1, 3.3) | 0.8 | (0.7, 0.8) | 5.3 | (5.1, 5.4) |
| Venezuela | Upper-middle | Maracaibo, Coro, and Ciudad Bolivar | Castilla EE, et al.[89] | 2000–2001 | 14.9 | (11.0, 18.8) | ||||||
| SOUTH-EAST ASIA | ||||||||||||
| Bangladesh | Low | Dhaka | Dey AC, et al.[91] | August 2006–July 2007 | 13.8 | (9.2, 20.0) | ||||||
| India | Lower-middle | Kolkata | Sarkar S, et al.[92] | September 2011–August 2012 | 1.6 | (0.2, 5.6) | 14.0 | (8.3, 22.1) | 2.3 | (0.5, 6.8) | 17.8 | (11.3, 26.8) |
| India | Lower-middle | Delhi | Sood M, et al.[93] | January 1988–August 1990 | 39.0 | (26.3, 51.8) | 26.0 | (16.7, 38.7) | 1.1 | (0.0, 6.0) | 66.2 | (49.7, 82.8) |
| India | Lower-middle | Lucknow | Sharma AK, et al.[94] | 1982–1991 | 19.2 | (16.8, 21.6) | 19.6[e] | (17.2, 22.0) | 38.8[d] | (35.4, 42.2) | ||
| India | Lower-middle | Pondicherry | Mahadevan B and Bhat BV [95] | July 1998–June 2004 | 18.0 | (14.5, 21.6) | 31.0 | (26.3, 35.7) | 7.0 | (4.8, 9.2) | 55.5[a] | (49.3, 61.8) |
| India | Lower-middle | Duragpur | Duttachoudhury A and Pal SK [96] | January 1991 -December 1993 | 5.5 | (1.5, 14.1) | 5.5 | (1.5, 14.1) | 11.0 | (4.8, 21.8) | ||
| India | Lower-middle | Erode | Ponne S and Lakshmi UK [97] | 2000–2004 | 10.7 | (6.6, 12.7) | 14.7 | (12.3, 17.2) | 1.9 | (1.1, 2.8) | 27.4 | (24.1, 30.7) |
| India | Lower-middle | Himachal Pradesh Shimla | Grover N [98] | January 1991–December 1995 | 20.8 | (12.9, 31.8) | 16.8 | (9.8, 27.0) | 6.9 | (2.8, 14.3) | 44.6 | (31.6, 57.5) |
| India | Lower-middle | Multi-Regional | ICBDSR 2011 Report [38] | 2005–2009 | 12.3 | (11.4, 13.1) | 11.0 | (10.2, 11.8) | 3.6 | (3.1, 4.0) | 26.8 | (25.6, 28.1) |
| India | Lower-middle | Sevagram, Wardha | Taksande A, et al.[99] | January 2005–July 2007 | 5.3 | (1.7, 12.4) | 2.1 | (0.3, 7.7) | 7.5 | (3.0, 15.4) | ||
| Nepal | Low | Thapathali | Malla BK [100] | 2004 | 5.3 | (2.4, 10.1) | 4.7 | (2.0, 9.3) | 1.8 | (0.4, 5.2) | 11.8 | (7.2, 18.2) |
| Thailand | Upper-middle | Songkhla, Phatthalung, and Trang Provinces | Jaruratanasirikul S, et al.[101] | January 2001–December 2012 | 0.8 | (0.4, 1.4) | 0.7 | (0.4, 1.3) | 0.3 | (0.1, 0.8) | 1.9 | (1.3, 2.7) |
| Thailand | Upper-middle | Chiang Mai | Kitisomprayoonkul N and Tongsong T [102] | June 1989–May 2000 | 5.6 | (3.9, 7.4) | 0.6 | (0.2, 1.5) | 0.4 | (0.1, 1.3) | 6.6 | (4.7, 8.6) |
| Thailand | Upper-middle | Bangkok | Wasant P and Sathienkijkanchai A [103] | 1990–1999 | 2.6 | (1.8, 3.4) | 3.2 | (2.4, 4.1) | 0.8 | (0.5, 1.4) | 6.7[b, d] | (5.5, 7.9) |
| WESTERN PACIFIC | ||||||||||||
| Australia | High | South Australia | Flood L, et al.[104] | 2010 | 19.5 | (13.4, 25.6) | ||||||
| Australia | High | Victoria, West Australia, South Australia, New South Wales, Queensland States | Macaldowie A and Hilder L [105] | 2006–2008 | 8.8 | (8.2, 9.4) | ||||||
| China | Upper-middle | Hainan Province | Fan L, et al.[106] | 2010 | 5.8 | (3.9, 7.7) | ||||||
| China | Upper-middle | Shenzhen City | Yang M, et al.[107] | 2003–2009 | 5.7 | (4.6, 6.8) | ||||||
| China | Upper-middle | National | Li X, et al.[108] | 2006–2008 | 5.9 | (5.6, 6.2) | 6.0 | (5.7, 6.3) | 2.2 | (2.0, 2.3) | 14.0 | (13.4, 14.5) |
| Northern China | 6.8 | (6.4, 7.3) | 9.2 | (8.6, 9.8) | 2.7 | (2.4, 3.0) | 18.7 | (17.9, 19.5) | ||||
| Southern China | 5.0 | (4.6, 5.4) | 3.1 | (2.8, 3.4) | 1.7 | (1.5, 1.9) | 9.7 | (9.1, 10.3) | ||||
| China | Upper-middle | Inner Mongolia | Zhang X, et al.[109] | 2005–2008 | 6.9 | (4.8, 9.0) | 10.6 | (8.1, 13.2) | 2.7 | (1.4, 4.0) | 20.3[f] | (16.8, 23.8) |
| China | Upper-middle | National | Dai L, et al. [110] | 2009 | 6.5 | (6.1, 6.9) | ||||||
| China | Upper-middle | Zhejiang Province | Zhang XH, et al.[111] | 2007–2009 | 6.3 | (5.7, 7.0) | 3.6 | (3.1, 4.1) | 1.4 | (1.1, 1.7) | 11.3 | (10.4, 12.2) |
| China | Upper-middle | Luliang Prefecture, Shanxi Province | Chen G, et al.[112] | 2004–2005 | 82.6 | (60.5, 104.7) | 38.9 | (25.2, 57.5) | 26.5 | (15.4, 42.4) | 199.4[d] | (165.2, 233.6) |
| China | Upper-middle | Beijing | Li Y, et al.[113] | January 2003–March 2009 | 0.0 | (0.0, 0.6) | 0.3 | (0.0, 1.2) | 0.3 | (0.0, 1.2) | ||
| China | Upper-middle | Guizhou Province | Liu J, et al. [114] | Januray 1996–December 2004 | 4.2 | (2.9, 5.5) | 5.9 | (4.4, 7.4) | 0.7 | (0.3, 1.4) | 12.2[d] | (10.0, 14.4) |
| China | Upper-middle | Gansu Province | Cheng N, et al.[115] | January 2001–January 2002 | 66.5 | (46.9, 86.1) | ||||||
| China | High | Taiwan | Chen BY, et al.[116] | 2002 | 1.1 | (0.7, 1.6) | 1.1 | (0.7, 1.6) | 0.4 | (0.2, 0.7) | 2.5 | (1.9, 3.1) |
| Japan | High | Osaka City | Imaizumi Y, et al.[117] | 1981–1990 | 7.1 | (4.2, 11.4) | 1.3 | (0.3, 3.7) | 8.4 | (5.1, 12.9) | ||
| Japan | High | Ishikawa Prefecture | Seto T, et al.[118] | 1981–2000 | 0.8 | (0.2, 1.3) | 0.9 | (0.3, 1.5) | 1.0 | (0.3, 1.6) | 2.6 | (1.7, 3.9) |
| Japan | High | National | ICBDSR 2011 Report [38] | 2005–2009 | 0.9 | (0.6, 1.2) | 5.2 | (4.5, 5.9) | 0.8 | (0.5, 1.1) | 6.9 | (6.1, 7.7) |
| South Korea | High | National | Kim MA, et al.[119] | 2005–2006 | 0.2 | (0.1, 0.3) | 2.6 | (2.2, 2.9) | 0.3 | (0.2, 0.4) | 3.1 | (2.7, 3.5) |
| Malaysia | Upper-middle | National | Boo NY, et al.[120] | 2009 | 2.1 | (1.5, 2.6) | 1.6 | (1.1, 2.1) | 0.8 | (0.5, 1.2) | 5.4 | (4.5, 6.2) |
| New Zealand | High | National | ICBDSR 2011 Report [38] | 2005–2009 | 0.4 | (0.2, 0.6) | 2.1 | (1.6, 2.6) | 0.5 | (0.3, 0.8) | 3.0 | (2.4, 3.6) |
| Papua New Guinea | Lower-middle | Port Moresby | Dryden R [121] | 1985–1986 | 3.0 | (0.6, 8.8) | 4.0 | (1.1, 10.2) | 7.0 | (2.6, 14.4) | ||
| Singapore | High | National | Shi LM, et al.[122] | 1994–1998 | 0.5[b] | (0.3, 0.9) | 0.7 | (0.4, 1.1) | 1.2[b] | (0.8, 1.8) | ||
| Vietnam | Lower-middle | Binh Thuan Province | Hoang T, et al.[123] | 2010 | 3.6 | (1.2, 8.4) | 0.0 | (0.0, 2.6) | 0.7 | (0.0, 4.0) | 4.3 | (1.6, 9.4) |
| UNCLASSIFIED | ||||||||||||
| Palestine | East Jerusalem and Southern West Bank | Dudin A [124] | 1986–1993 | 54.9[a] | (46.1, 63.7) | |||||||
a Non-NTDs such as syndromes, chromosomal abnormalities, and spina bifida occulta were not included in our calculations
b May include non-NTDs, but could not stratify in our calculation
c Referred cases were not included in our calculation
d Individual NTDs do not sum to total NTDs (e.g., only isolated NTD counts were provided, but prevalence includes multiple NTDs)
e Spina bifida cases included encephalocele
f Recalculated NTD prevalence was inconsistent with the original authors’ published rate
g Regions may be impacted by Chernobyl disaster
N/A = Not applicable
* If prevalence cell is blank, data were either not reported, not stratified by specific type of NTD, or unclear
¥ Sum of all NTDs reported, which includes spina bifida and/or anencephaly and encephalocele, depending on what NTDs the authors of the original study assessed
Fig 2. Neural Tube Defects Prevalence and Confidence Intervals by World Bank Income Classifications (Log Scale)[18].

Furthermore, we observed that among studies that reported stratified data for all three types of NTDs, on average, spina bifida attributed the highest percentage to total NTD prevalence, followed by anencephaly and then encephalocele (Fig 3). When stratified by country income level, we noticed a general decrease in the median prevalence for each specific type of NTD from the lower-middle to high income countries (Fig 4). NTD prevalence estimates by WHO region are as follows:
Fig 3. Percent of all Neural Tube Defects (NTDs) Attributable to Each Condition for Studies that Reported all Three Types of NTDs: Anencephaly, Spina Bifida, and Encephalocele.
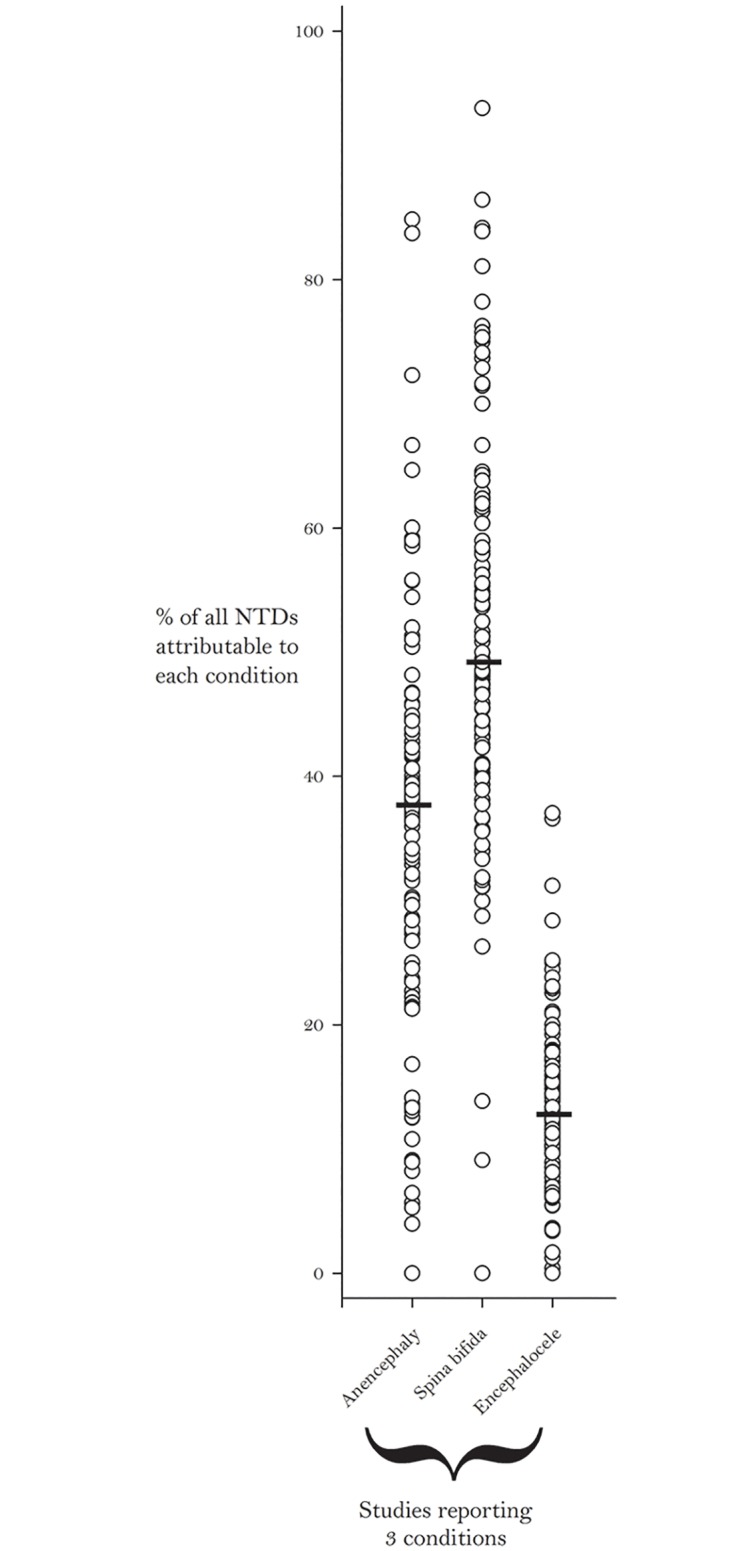
Bars Indicate the Median Percent for Each Condition.
Fig 4. Prevalence per 10,000 Births for Specific Types of Neural Tube Defects by World Bank Income Classifications [18].

Bars Indicate the Median Prevalence for Each Condition.
African Region: Data from eight of 47 WHO member countries, represented by 11 studies, met our inclusion criteria (Fig 5). The lowest reported NTD prevalence for the region was reported in Nigeria (5.2 per 10,000 births) [24] and the highest was reported in Algeria (75.4 per 10,000 births) [19]. The median NTD prevalence was 11.7 per 10,000 births. Data from this region were primarily gathered from hospital-based retrospective case reviews.
Fig 5. African Region Neural Tube Defects Prevalence Estimates (Location, Number of Hospitals).

If there were national data available for more than one NTD, the entire country was filled-in based on the prevalence per 10,000 births. In instances where multiple prevalence estimates were available at the national level, the prevalence reported by the study/report with the least risk-of-bias was selected. Countries colored in grey are not a part of the World Health Organization region. Shapefile reprinted from http://www.diva-gis.org under a CC BY license, with permission from DIVA-GIS and Dr. Robert Hijmans.
Eastern Mediterranean Region: Published data were available for 12 of the 21 countries in the region and were represented by 31 studies (Fig 6). This region exhibited variability in reported NTD prevalence as well, with estimates as low as 2.1 per 10,000 births in the United Arab Emirates [60] and as high as 124.1 per 10,000 births in Swat, Pakistan [48]. This region had the highest median prevalence (21.9 per 10,000 births). Elevated NTD prevalence estimates were consistently observed in Pakistan. All five studies in Pakistan reported estimates between 38.6 and 124.1 per 10,000 births [48–52].
Fig 6. Eastern Mediterranean Region Neural Tube Defects Prevalence Estimates (Location, Number of Hospitals).

If there were national data available for more than one NTD, the entire country was filled-in based on the prevalence per 10,000 births. In instances where multiple prevalence estimates were available at the national level, the prevalence reported by the study/report with the least risk-of-bias was selected. Countries colored in grey are not a part of the World Health Organization region. Shapefile reprinted from http://www.diva-gis.org under a CC BY license, with permission from DIVA-GIS and Dr. Robert Hijmans.
European Region: We identified a total of 60 different studies/reports spanning a total of 26 countries of the 53 countries in the region (Fig 7). Ninety-five percent of NTD data from Europe came from regional or national registries/surveillance systems. The reported NTD prevalence estimates in this region were relatively less variable than other regions (range: 1.3–35.9 per 10,000 births) [61, 70]. The median for the European region was 9.0 per 10,000 births.
Fig 7. European Region Neural Tube Defects Prevalence Estimates (Location, Number of Hospitals).

The majority of data from the European region was population based. All data based on hospital studies from regions is indicated with the number of hospitals. If there were national or regional data available for more than one NTD, the entire country or region was filled-in based on the prevalence per 10,000 births. In instances where multiple prevalence estimates were available at the national level, the prevalence reported by the study/report with the least risk-of-bias was selected. Countries colored in grey are not a part of the World Health Organization region. A national study from Israel is not represented on this map since it only provided prevalence by ethnicity. Shapefile reprinted from http://www.gadm.org under a CC BY license, with permission from Global Administrative Areas and Dr. Robert Hijmans.
Americas Region: Data from 21 studies/reports representing 15 of the 35 countries were available (Fig 8). This region had the least variability in reported NTD prevalence estimates. Among studies that included spina bifida and at least one other NTD, the lowest prevalence was 3.3 per 10,000 births [82, 87]. A study from Brazil which only counted spina bifida reported a prevalence of 1.4 per 10,000 births [75]. In this region, the highest prevalence was reported in Guatemala (27.9 per 10,000 births) [83]. The median prevalence was 11.5 per 10,000 births.
Fig 8. American Region Neural Tube Defects Prevalence Estimates (Location, Number of Hospitals).

If there were national data available for more than one NTD, the entire country was filled-in based on the prevalence per 10,000 births. In instances where multiple prevalence estimates were available at the national level, the prevalence reported by the study/report with the least risk-of-bias was selected. Shapefile reprinted from http://www.diva-gis.org under a CC BY license, with permission from DIVA-GIS and Dr. Robert Hijmans.
South-East Asian Region: There were 14 studies representing four of the 11 countries in South-East Asia (Fig 9). The lowest prevalence estimate for the region was 1.9 per 10,000 births in Thailand [101] and the highest was 66.2 per 10,000 births in India [93]. Most of the data for this region came from either Thailand or India; three and nine studies, respectively. The median prevalence in this region was 15.8 per 10,000 births.
Fig 9. South-East Asian Region Neural Tube Defects Prevalence Estimates (Location, Number of Hospitals).

If there were national data available for more than one NTD, the entire country was filled-in based on the prevalence per 10,000 births. In instances where multiple prevalence estimates were available at the national level, the prevalence reported by the study/report with the least risk-of-bias was selected. North Korea had no reported data and was not shown in map due to scaling considerations. Shapefile reprinted from http://www.diva-gis.org under a CC BY license, with permission from DIVA-GIS and Dr. Robert Hijmans.
Western Pacific Region: Of the 27 countries, data were available for nine countries from 22 studies/reports (Fig 10). This region had the lowest median prevalence value (6.9 per 10,000 births). As stated previously, China exhibited the greatest variability in reported NTD prevalence estimates (range: 0.3–199.4 per 10,000 births) [113, 112]. As seen in Li et al., NTD estimates tend to be higher in northern China (18.7 per 10,000 births) than in the southern part of the country (9.7 per 10,000 births) [108]. When excluding data from China, reported NTD prevalence in this region ranged from as low as 1.2 per 10,000 births in Singapore [122] to as high as 19.5 per 10,000 births in Australia [104].
Fig 10. Western Pacific Region Neural Tube Defects Prevalence Estimates (Location, Number of Hospitals).

If there were national data available for more than one NTD, the entire country was filled-in based on the prevalence per 10,000 births. In instances where multiple prevalence estimates were available at the national level, the prevalence reported by the study/report with the least risk-of-bias was selected. Countries colored in grey are not a part of the World Health Organization region. Shapefile reprinted from http://www.diva-gis.org under a CC BY license, with permission from DIVA-GIS and Dr. Robert Hijmans.
Surveillance System/Registry Coverage
Fig 11 shows the types of NTD data collection worldwide, categorized as national surveillance system/registry, regional surveillance system/registry, or other (i.e., no surveillance system/registry but has data collected using another methodology). The map illustrates that there are limited amounts of data derived from surveillance/registry programs in countries in the African (1/8) and South-East Asian (2/4) regions. In contrast, the Americas (11/15) and European (26/26) countries had higher utilization of surveillance/registries. Furthermore, the presence of a NTD surveillance system/registry increased with country income status: low income (0%), lower-middle (25%), upper-middle (70%), and high income (91%).
Fig 11. Data Source: Surveillance/Registry Coverage by Geographic Level.

Shapefile reprinted from http://www.diva-gis.org under a CC BY license, with permission from DIVA-GIS and Dr. Robert Hijmans.
Risk-of-Bias (RoB)
The RoB evaluation generated scores ranging from 0.0 to 14.0 (possible range 0.0 to 18.0), with lower scores indicating lower RoB. When average RoB scores were classified by WHO region, studies/reports from Europe had the lowest (5.0), while studies/reports from the Eastern Mediterranean (10.9), South-East Asian (11.3) and African (11.5) regions had the highest RoB scores (Fig 12). In addition, we observed an inverse relationship between RoB score and country income level. As the income level of countries increased, their average RoB scores decreased (Fig 13).
Fig 12. Average Study Risk-of-Bias by World Health Organization Region.

Fig 13. Average Study Risk-of-Bias by World Bank Income Classification [18].

Discussion
Our review provides a comprehensive global assessment of NTD prevalence as observed from 75 countries at the national, regional, or local levels, which represents about 40% of the total number of WHO member states (194) [125]. The African and South-East Asian regions have minimal data available, demonstrating the need to establish surveillance and other mechanisms that can provide countries with standardized data to better determine the burden of birth defects in general, and NTDs in particular. More complete ascertainment of data will be useful in determining country level needs for prevention of NTDs, monitoring trends through time, helping to evaluate the impact of prevention efforts, and developing services for those affected.
Overall, reported prevalence estimates varied greatly between, and also, within countries ranging from 0.3 to 199.4 NTDs per 10,000 births. Through the RoB assessment, we discovered this may be in part due to variation in data collection methodology among individual studies. For example, both studies from post-fortification Brazil had a 10-fold difference in spina bifida prevalence estimates: 1.4 per 10,000 live births (95% CI: 1.2, 1.5) in the Orioli et al. study [76] and 14.2 per 10,000 births (95% CI: 11.8, 16.6) in the Lopez-Camelo et al. study [75]. Orioli et al. assessed spina bifida prevalence in 2006 in a population-based cross-sectional study that included millions of live births from the Live Births Information System. The system used to estimate NTDs in the Orioli et al. paper had some limitations with case ascertainment, case definition, and lack of standardized diagnoses that may impact the validity and reliability of the estimates [76, 126]. The Lopez-Camelo et al. study used data from the Latin American Collaborative Study of Congenital Anomalies (ECLAMC) which is a hospital-based, voluntary birth defects surveillance network that includes 19 hospitals throughout Brazil. It is important to note that the NTD prevalence variability we found in our review could also be true differences, resulting from other factors including nutritional factors, genetics, routine folic acid supplementation, and the presence of folic acid fortification programs [127–129].
By conducting our RoB assessment, we found that case ascertainment methods and data quality varied greatly among studies. Therefore, the prevalence estimates from different studies are not directly comparable nor can they be used to calculate a combined estimate [130]. For example, the scope of studies varied from single-hospital studies done over the span of one year to studies using established nationally representative surveillance systems. In addition, many studies did not clearly define NTDs or provide inclusion criteria (e.g., gestational age and birth outcome). While we attempted to re-calculate reported prevalence to match our definition (e.g., removing chromosomal NTDs and spina bifida occulta), many times this was not possible because data were not stratified by type of NTD. Standardized protocols (i.e., case definitions, inclusion criteria, variables collected, reporting) for birth defects surveillance would allow better comparison among studies. In addition, improved methodology can make prevalence estimates more accurate. For example, including cases among pregnancies terminated for fetal anomalies, especially in countries where this is legal, usually leads to higher and more accurate prevalence estimates due to better case ascertainment. Recently, standardized tools for birth defects surveillance have been developed through a collaborative effort of health organizations including WHO, CDC, and ICBDSR. The Birth Defects Surveillance Manual and Atlas of Selected Congenital Anomalies are available in three languages (English, Spanish, and French) and have been developed specifically for low and middle income countries [131, 132].
In our review, although some data were available from low and middle income countries, most of the data were not derived from surveillance systems or registries. Often data from these countries were collected in limited geographic areas (single hospital studies), were not population-based, and lacked well defined procedures for collecting birth defects data. NTD prevalence data from surveillance systems and registries, such as EUROCAT, that used standardized and more comprehensive case ascertainment protocols (e.g., reporting cases from termination of pregnancy where it is legal) and had greater geographic and population coverage are more likely to estimate the true burden of NTDs in those regions more accurately.
This review advances the state of knowledge in three ways: first, this is the most current systematic review on global NTD prevalence; second, this review was able to identify large gaps in data collection and highlight international differences; and third, through the RoB assessment this study was able to document the wide variation in the quality and methodology of current reports. Our review supports the findings of previously published literature and demonstrates there is a high burden of NTDs globally. However, our review purposefully does not model data to non-reporting regions in an effort to highlight the lack of data globally. Moreover, it expands the scope of previously published systematic reviews that only included studies/reports from countries in one region or select income levels.
Limitations
Beyond issues related to the abstracted data and study-specific methodologic issues, our review is also limited by factors related to our search criteria. Since this review only searched English and Spanish literature and excluded studies with small study populations, it may not have incorporated all relevant NTD prevalence information. In select studies, our review was unable to report prevalence estimates for each specific type of NTD since individual values were not always stratified. Lastly, presence of birth outcome data (i.e., live birth, stillbirth, and termination of pregnancy) was only used for the RoB analysis. Ideally, prevalence data should be stratified by birth outcome, however, many studies did not describe the birth outcome in sufficient detail (i.e., whether it was in the numerator, denominator, or both) or at all.
Conclusions
This review describes the available data on the current burden of NTDs throughout the world. Despite methodological variations and coverage gaps in data collection, high NTD prevalence estimates throughout the literature indicate that NTDs remain an important preventable public health problem. This review provides a snapshot of areas in need of greater coverage and quality of NTD monitoring and surveillance and identifies opportunities for development such as standard reporting of birth defects as recommended by the World Health Assembly resolution. More importantly, regions that include large portions of the global population (e.g., South-East Asia) are lacking surveillance/registry data and case ascertainment methods that include all birth outcomes which provide the most reliable and valid estimates. In response to this need, CDC’s Birth Defects COUNT global initiative is working with partners in South-East Asia, East and Central Africa, and Latin America to implement and improve surveillance of NTDs as well as other birth defects [133].
Supporting Information
(DOC)
(DOCX)
Acknowledgments
We would like to thank Barbara Landreth, CDC librarian, for her assistance with the literature search. We would also like to thank Csaba Siffel, Cho-Hee Schrader, and Chelsey Brack for their assistance in abstract review. Finally, we would like to thank Diana Valencia for her assistance in abstracting data recorded in Spanish.
Disclaimer: The findings and conclusions in this report are those of the authors and do not necessarily represent the official position of the Centers for Disease Control and Prevention.
Data Availability
All relevant data are within the paper and its Supporting Information files.
Funding Statement
AS, IZ, and BLT were supported in part by an appointment to the Research Participation Program at the CDC administered by the Oak Ridge Institute for Science and Education (ORISE). The commercial company, Carter Consulting Inc., provided support in the form of salaries for authors [HR, JM]. The funders had no role in study design, data collection and analysis, decision to publish, or preparation of the manuscript.
References
- 1.Christianson AL, Howson CP, Modell B. Global report on birth defects: the hidden toll of dying and disabled children. White Plains (NY): March of Dimes Birth Defects Foundation; 2006. [Google Scholar]
- 2.World Health Organization. Global health estimates (GHE)–Cause-specific mortality. 2015. Available:http://www.who.int/healthinfo/global_burden_disease/estimates/en/index1.html. Accessed 2015 Apr 14.
- 3.World Health Organization. Global health estimates (GHE)–Disease burden. 2015. Available: http://www.who.int/healthinfo/global_burden_disease/estimates/en/index2.html. Accessed 2015 Apr 14.
- 4.Blencowe H, Cousens S, Modell B, Lawn J. Folic acid to reduce neonatal mortality from neural tube disorders. International Journal of Epidemiology. 2010; 39 (Suppl 1): i110–i121. 10.1093/ije/dyq028 [DOI] [PMC free article] [PubMed] [Google Scholar]
- 5.Rudan I, Chan KY, Zhang JS, Theodoratou E, Feng XL, Salomon JA, et al. Causes of deaths in children younger than 5 years in China in 2008. The Lancet. 2010; 375: 1083–1089. [DOI] [PubMed] [Google Scholar]
- 6.U.S. Centers for Disease Control and Prevention. Recommendations for the use of folic acid to reduce the number of cases of spina bifida and other neural tube defects. Morbidity and Mortality Weekly Report. 1992; 41: 1–7. [PubMed] [Google Scholar]
- 7.Berry RJ, Baily L, Mulinare J, Bower C, Dary O. Fortification of flour with folic acid. Food and Nutrition Bulletin. 2010; 31: 22S–35S. [DOI] [PubMed] [Google Scholar]
- 8.Crider KS, Bailey LB, Berry RJ. Folic acid food fortification—its history, effect, concerns, and future directions. Nutrients. 2011; 3: 370–384. 10.3390/nu3030370 [DOI] [PMC free article] [PubMed] [Google Scholar]
- 9.Berry RJ, Li Z, Erickson JD, Li S, Moore CA, Wang H, et al. Prevention of neural-tube defects with folic acid in China. New England Journal of Medicine. 1999; 341: 1485–1490. [DOI] [PubMed] [Google Scholar]
- 10.U.S. Centers for Disease Control and Prevention. CDC Grand Rounds: additional opportunities to prevent neural tube defects with folic acid fortification. Morbidity and Mortality Weekly Report. 2010; 59: 980–984. [PubMed] [Google Scholar]
- 11.Sixty-Third World Health Assembly. Agenda item 11.7 –Birth defects. 21 May 2010. Available: http://apps.who.int/gb/ebwha/pdf_files/WHA63/A63_R17-en.pdf. Accessed 2015 Apr 14.
- 12.Youngblood ME, Williamson R, Bell KN, Johnson Q, Kancherla V, Oakley GP. 2012 Update on global prevention of folic acid-preventable spina bifida and anencephaly. Birth Defects Research Part A: Clinical and Molecular Teratology. 2013; 97: 658–663. [DOI] [PubMed] [Google Scholar]
- 13.Bhide P, Sagoo GS, Moorthie S, Burton H, Kar A. Systematic review of birth prevalence of neural tube defects in India. Birth Defects Research Part A: Clinical and Molecular Teratology. 2013; 97: 437–443. [DOI] [PubMed] [Google Scholar]
- 14.Rosenthal J, Casas J, Taren D, Alverson CJ, Flores A, Frias J. Neural tube defects in Latin America and the impact of fortification: a literature review. Public Health Nutrition. 2014; 17: 537–550. 10.1017/S1368980013000256 [DOI] [PMC free article] [PubMed] [Google Scholar]
- 15.Lo A, Polšek D, Sidhu S. Estimating the burden of neural tube defects in low—and middle—income countries. Journal of Global Health. 2014; 4. [DOI] [PMC free article] [PubMed] [Google Scholar]
- 16.Moher D, Liberati A, Tetzlaff J, Altman DG. The PRISMA Group Preferred Reporting Items for Systematic Reviews and Meta-Analyses: the PRISMA statement. PLoS Medicine. 2009; 6. [PMC free article] [PubMed] [Google Scholar]
- 17.World Health Organization. WHO regional offices. 2015. Available: http://www.who.int/about/regions/en/. Accessed 2015 Jul 7.
- 18.World Bank. Country and lending groups. 2015. Available: http://data.worldbank.org/about/country-and-lending-groups. Accessed 2015 Jul 7.
- 19.Houcher B, Akar N, Begag S, Egin Y. Neural tube defects in Algeria. INTECH Open Access Publisher; 2012. [Google Scholar]
- 20.Njamnshi AK, Djientcheu VDP, Lekoubou A, Guemse M, Obama MT, Mbu R, et al. Neural tube defects are rare among black Americans but not in sub-Saharan black Africans: the case of Yaounde—Cameroon. Journal of the Neurological Sciences. 2008; 270: 13–17. [DOI] [PubMed] [Google Scholar]
- 21.Ahuka OL, Toko RM, Omanga FU, Tshimpanga BJ. Congenital malformations in the North-Eastern Democratic Republic of Congo during civil war. East African Medical Journal. 2006; 8: 95–99. [DOI] [PubMed] [Google Scholar]
- 22.Anyebuno M, Amofa G, Peprah S, Affram A. Neural tube defects at Korle Bu Teaching Hospital, Accra, Ghana. East African Medical Journal. 1993; 70: 572–574. [PubMed] [Google Scholar]
- 23.Msamati BC, Igbigbi PS, Chisi JE. The incidence of cleft lip, cleft palate, hydrocephalus and spina bifida at Queen Elizabeth Central Hospital, Blantyre, Malawi. The Central African Journal of Medicine. 2000; 46: 292–296. [DOI] [PubMed] [Google Scholar]
- 24.Ekanem TB, Okon DE, Akpantah AO, Mesembe OE, Eluwa MA, Ekong MB. Prevalence of congenital malformations in Cross River and Akwa Ibom states of Nigeria from 1980–2003. Congenital Anomalies. 2008; 48: 167–170. 10.1111/j.1741-4520.2008.00204.x [DOI] [PubMed] [Google Scholar]
- 25.Airede KI. Neural tube defects in the middle belt of Nigeria. Journal of Tropical Pediatrics. 1992; 38: 27–30. [DOI] [PubMed] [Google Scholar]
- 26.Sayed AR, Bourne D, Pattinson R, Nixon J, Henderson B. Decline in the prevalence of neural tube defects following folic acid fortification and its cost-benefit in South Africa. Birth Defects Research Part A: Clinical and Molecular Teratology. 2008; 82: 211–216. [DOI] [PubMed] [Google Scholar]
- 27.Venter PA, Christianson AL, Hutamo CM, Makhura MP, Gericke GS. Congenital anomalies in rural black South African neonates—a silent epidemic?. South African Medical Journal. 1995; 85: 15–20. [PubMed] [Google Scholar]
- 28.Viljoen DL, Buccimazza S, Dunne T, Molteno C. The prevalence and prevention of neural tube defects in Cape Town. South African Medical Journal. 1995; 85: 630–632. [PubMed] [Google Scholar]
- 29.Kinasha AD, Manji K. The incidence and pattern of neural tube defects in Dar es Salaam, Tanzania. European Journal of Pediatric Surgery. Supplement, 2002; S38–S39. [PubMed] [Google Scholar]
- 30.Mohammed YA, Shawky RM, Soliman AA, Ahmed MM. Chromosomal study in newborn infants with congenital anomalies in Assiut University hospital: Cross-sectional study. Egyptian Journal of Medical Human Genetics. 2011; 12: 79–90. [Google Scholar]
- 31.Ebrahimi S, Ashkani S, Bagheri F. Prevalence of neural tube defects in Yasuj, Southwest Iran. Shiraz E-Medical Journal. 2013; 14: 1–9. [Google Scholar]
- 32.Behrooz AG, Gorjizadeh MH. Prevalence and Correlates of Neural Tube Defect in South West Iran. Sultan Qaboos University Medical Journal. 2007; 7: 31–34. [PMC free article] [PubMed] [Google Scholar]
- 33.Abdollahi Z, Elmadfa I, Djazayery A, Golalipour MJ, Sadighi J, Salehi F, et al. Efficacy of flour fortification with folic acid in women of childbearing age in Iran. Annals of Nutrition and Metabolism. 2011; 58: 188–196. 10.1159/000329726 [DOI] [PubMed] [Google Scholar]
- 34.Delshad S, Tabar AK, Samae H, Mollaean M, Nasiri SJ, Jazayeri SM, et al. The incidence of selected congenital malformations during a two-year period in Tehran, Iran. Tropical Doctor. 2009; 39; 156–158. 10.1258/td.2008.070434 [DOI] [PubMed] [Google Scholar]
- 35.Afshar M, Golalipour MJ, Farhud D. Epidemiologic aspects of neural tube defects in South East Iran. Neurosciences. 2006; 11: 289–292. [PubMed] [Google Scholar]
- 36.Rad IA, Farrokh-Islamlou HR, Khoshkalam M. Neural tube defects prevalence in a hospital-based study in Urmia. Iranian Journal of Child Neurology. 2008; 2: 19–23. [Google Scholar]
- 37.Farhud DD, Hadavi V, Sadighi H. Epidemiology of neural tube defects in the world and Iran. Iranian journal of Public Health. 2000; 29: 83–90. [Google Scholar]
- 38.International Clearinghouse for Birth Defects Surveillance and Research. Annual report 2011 with data for 2009. Rome, Italy: The Centre of the International Clearinghouse for Birth Defects Surveillance and Research; 2011. [Google Scholar]
- 39.Al-Ani ZR, Al-Haj S, Al-Ani MM, Al-Dulaimy KM, Al-Maraie AK, Al-Ubaida BK. Incidence, types, geographical distribution, and risk factors of congenital anomalies in Al-Ramadi Maternity and Children’s Teaching Hospital, Western Iraq. Saudi Medical Journal. 2012; 33: 979–989. [PubMed] [Google Scholar]
- 40.Al-Sadoon I, Hassan GG, Yacoub A. Depleted Uranium and health of people in Basrah: Epidemiological evidence: Incidence and pattern of congenital anomalies among birth in Basrah during the period 1990–1998. Medical Journal of Basrah University: 1999; 17: 27–33. [Google Scholar]
- 41.Amarin ZO, Obeidat AZ. Effect of folic acid fortification on the incidence of neural tube defects. Paediatric and Perinatal Epidemiology. 2010; 24; 349–351. 10.1111/j.1365-3016.2010.01123.x [DOI] [PubMed] [Google Scholar]
- 42.Aqrabawi HE. Incidence of neural tube defects among neonates at King Hussein Medical Centre, Jordan. Eastern Mediterranean Health Journal. 2005; 11: 819–823. [PubMed] [Google Scholar]
- 43.Masri AT. Neural tube defects in Jordan: A hospital based study. Journal of Pediatric Neurology. 2006; 4: 245–249. [Google Scholar]
- 44.Daoud AS, Al-Kaysi F, El-Shanti H, Batieha A, Obeidat A, Al-Sheyyab M. Neural tube defects in northern Jordan. Saudi Medical Journal. 1996; 17: 78–81. [Google Scholar]
- 45.Madi SA, Al-Naggar RL, Al-Awadi SA, Bastaki LA. Profile of major congenital malformations in neonates in Al-Jahra region of Kuwait. Eastern Mediterranean Health Journal. 2005; 11: 700–706. [PubMed] [Google Scholar]
- 46.Singh R, Al-Sudani O. Major congenital anomalies at birth in Benghazi, Libyan Arab Jamahiriya, 1995. Eastern Mediterranean Health Journal. 2000; 6: 65–75. [PubMed] [Google Scholar]
- 47.Alasfoor D, ElSayed MK. Fortification of Flour and Outcomes: Oman’s Perspective—Contextual Considerations and Outcome In: Handbook of Food Fortification and Health 2013. (pp. 321–334). Springer; New York. [Google Scholar]
- 48.Khattak ST, Khan M, Naheed T, Khattak I, Ismail M. Prevalence and management of anencephaly at Saidu Teaching Hospital, Swat. Journal of Ayub Medical College, Abbottabad. 2009; 22: 61–63. [PubMed] [Google Scholar]
- 49.Qazi G. Relationship of selected prenatal factors to pregnancy outcome and congenital anomalies. Journal of Ayub Medical College, Abbottabad. 2010; 22: 41–45. [PubMed] [Google Scholar]
- 50.Perveen F, Tyyab S. Frequency and pattern of distribution of congenital anomalies in the newborn and associated maternal risk factors. Journal of the College of Physicians and Surgeons—Pakistan. 2007; 17: 340–343. [PubMed] [Google Scholar]
- 51.Najmi RS. Risk factors, clinical presentation and perinatal outcome of congenital malformations in a hospital based study. Journal of the College of Physicians and Surgeons—Pakistan. 1998; 8: 265–269. [Google Scholar]
- 52.Jooma R. Preventing neural tube defects by folic acid fortification of flour. The Journal of the Pakistan Medical Association. 2004; 54: 540–541. [PubMed] [Google Scholar]
- 53.Bener A, Kurdi B, Hoffmann GF, Caksen H, Teebi A. The pattern of neural tube defects in a highly endogamous society: A 25-year incidence trends. Journal of Pediatric Neurology. 2012; 10: 193–198. [Google Scholar]
- 54.Al-Jama F. Congenital malformations in newborns in a teaching hospital in eastern Saudi Arabia. Journal of Obstetrics & Gynecology. 2001; 21: 595–598. [DOI] [PubMed] [Google Scholar]
- 55.Asindi A, Al-Shehri A. Neural tube defects in the Asir region of Saudi Arabia. Annals of Saudi Medicine. 2001; 21: 26–29. [DOI] [PubMed] [Google Scholar]
- 56.Safdar OY, Al-Dabbagh AA, AbuElieneen WA, Kari JA. Decline in the incidence of neural tube defects after the national fortification of flour (1997–2005). Saudi Medical Journal. 2007; 28: 1227–1229. [PubMed] [Google Scholar]
- 57.Murshid WR. Spina bifida in Saudi Arabia: is consanguinity among the parents a risk factor?. Pediatric Neurosurgery. 2000; 32: 10–12. [DOI] [PubMed] [Google Scholar]
- 58.Hakami WS, Majeed-Saidan MA. The incidence and spectrum of central nervous system malformations in newborns over a decade (2001–2010) in the Central Region of Saudi Arabia. Saudi Medical Journal. 2011; 32: 1137–1142. [PubMed] [Google Scholar]
- 59.Elsheikh GEA, Ibrahim SA. Neural tube defects in Omdurman Maternity Hospital, Sudan. Khatoum Medical Journal. 2009; 2: 185–190. [Google Scholar]
- 60.Al Hosani H, Salah M, Abu-Zeid H, Farag HM, Saade D. The national congenital anomalies register in the United Arab Emirates. East Mediterranean Health Journal. 2005; 11: 690–699. [PubMed] [Google Scholar]
- 61.European Surveillance of Congenital Anomalies (EUROCAT). Prevalence Tables; 2012. Available: http://www.eurocat-network.eu/accessprevalencedata/prevalencetables.
- 62.Kovacheva K, Simeonova M, Velkova A. Trends and causes of congenital anomalies in the Pleven region, Bulgaria. Balkan Journal of Medical Genetics. 2009; 12: 37–43. [Google Scholar]
- 63.Pasternak B, Svanström H, Mølgaard-Nielsen D, Melbye M, Hviid A. Metoclopramide in pregnancy and risk of major congenital malformations and fetal death. The Journal of the American Medical Association. 2013; 310: 1601–1611. 10.1001/jama.2013.278343 [DOI] [PubMed] [Google Scholar]
- 64.Stoll C, Dott B, Alembik Y, Roth MP. Associated malformations among infants with neural tube defects. American Journal of Medical Genetics Part A. 2011; 155: 565–568. [DOI] [PubMed] [Google Scholar]
- 65.Klusmann A. Heinrich B, Stöpler H, Gärtner J, Mayatepek E, Kries R. A decreasing rate of neural tube defects following the recommendations for periconceptional folic acid supplementation. Acta Paediatrica. 2005; 94: 1538–1542. [DOI] [PubMed] [Google Scholar]
- 66.McDonnell R, Delany V, Mahony MT, Mullaney C, Lee B, Turner MJ. Neural tube defects in the Republic of Ireland in 2009–11. Journal of Public Health. 2014; 1–7. [DOI] [PubMed] [Google Scholar]
- 67.Zlotogora J, Amitai Y, Leventhal A. Surveillance of neural tube defects in Israel: the effect of the recommendation for periconceptional folic acid. Israel Medical Association Journal. 2006; 8: 601–604. [PubMed] [Google Scholar]
- 68.Petrova JG, Vaktskjold A. The incidence of neural tube defects in Norway and the Arkhangelskaja Oblast in Russia and the association with maternal age. Acta Obstet Gynecol Scand. 2009; 88: 667–672. 10.1080/00016340902898008 [DOI] [PubMed] [Google Scholar]
- 69.Poretti A, Anheier T, Zimmermann R, Boltshausei E. Neural tube defects in Switzerland from 2001 to 2007: are periconceptual folic acid recommendations being followed?. Swiss Medical Weekly. 2008; 138: 608–613. [DOI] [PubMed] [Google Scholar]
- 70.Onrat ST, Seyman H, Konuk M. Incidence of neural tube defects in Afyonkarahisar, Western Turkey. Genetics and Molecular Research. 2009; 8: 154–161. [DOI] [PubMed] [Google Scholar]
- 71.Mandıracıoğlu A, Ulman I, Lüleci E, Ulman C. The incidence and risk factors of neural tube defects in İzmir, Turkey: A nested case-control study. The Turkish Journal of Pediatrics. 2004; 46: 214–220. [PubMed] [Google Scholar]
- 72.Tuncbilek E, Boduroğlu K, Alikaşifoğlu M. Neural tube defects in Turkey: prevalence, distribution and risk factors. The Turkish Journal of Pediatrics. 1998; 41: 299–305. [PubMed] [Google Scholar]
- 73.Himmetoglu O, Tiras MB, Gursoy R, Karabacak O, Sahin I, Onan A. The incidence of congenital malformations in a Turkish population. International Journal of Gynecology & Obstetrics. 1996; 55: 117–121. [DOI] [PubMed] [Google Scholar]
- 74.Groisman B, Bidondo MP, Barbero P, Gili JA, Liascovich R. RENAC: Registro Nacional de Anomalías Congénitas de Argentina. Archivos Argentinos de Pediatría. 2013; 111: 484–494. 24196761 [Google Scholar]
- 75.López‐Camelo JS, Castilla EE, Orioli IM. Folic acid flour fortification: impact on the frequencies of 52 congenital anomaly types in three South American countries. American Journal of Medical Genetics Part A. 2010; 152: 2444–2458. [DOI] [PubMed] [Google Scholar]
- 76.Orioli IM, Lima do Nascimento R, López‐Camelo JS, Castilla EE. Effects of folic acid fortification on spina bifida prevalence in Brazil. Birth Defects Research Part A: Clinical and Molecular Teratology. 2011; 91: 831–835. [DOI] [PubMed] [Google Scholar]
- 77.Nazer J, Cifuentes L. Resultados del Programa de Prevención de Defectos de Tubo Neural en Chile mediante la fortificación de la harina con ácido fólico: Período 2001–2010. Revista Médica de Chile. 2013; 141: 751–757. 10.4067/S0034-98872013000600009 [DOI] [PubMed] [Google Scholar]
- 78.Pachajoa H, Ariza Y, Isaza C, Méndez F. Defectos congénitos mayores en un hospital de tercer nivel en Cali, Colombia. Revista de Salud Pública. 2011; 13: 152–162. [PubMed] [Google Scholar]
- 79.Zarante I, Franco L, López C, Fernández N. Frecuencia de malformaciones congénitas: evaluación y pronóstico de 52.744 nacimientos en tres ciudades colombianas. Biomédica. 2010; 30: 65–71. [PubMed] [Google Scholar]
- 80.Ostos H, Astaiza G, Garcia F, Bautista M, Rojas F, Bermúdez A. Disminución de la incidencia de defectos de cierre del tubo neural en el Hospital Universitario de Neiva: posible efecto de la promoción del consumo de ácido fólico. Biomédica. 2000; 20: 18–24. [Google Scholar]
- 81.de la Paz Barboza-Argüello M, Umaña-Solís LM, Azofeifa A, Valencia D, Flores AL, Rodríguez-Aguilar S, et al. Neural Tube Defects in Costa Rica, 1987–2012: origins and Development of Birth Defect Surveillance and Folic Acid Fortification. Maternal and child Health Journal. 2015; 19: 583–590. 10.1007/s10995-014-1542-8 [DOI] [PMC free article] [PubMed] [Google Scholar]
- 82.González-Andrade F, López-Pulles R. Congenital malformations in Ecuadorian children: urgent need to create a National Registry of Birth Defects. The Application of Clinical Genetics. 2010; 3: 29–39. [DOI] [PMC free article] [PubMed] [Google Scholar]
- 83.Acevedo CR, Anzueto ER, Mendez AG, Ramirez FM. Prevalencia de anomalías congénitas mayores externas, en recién nacidos atendidos en hospitales nacionales y regionales de Guatemala 2001–2003. Undergraduate. Thesis, School of Medicine, Universidad de San Carlos de Guatemala. 2004.
- 84.Hernández R, Alvarenga R. Frecuencia de malformaciones congenitas externas en recién nacidos de la Unidad Materno Inantil del Hospital Escuela. Factores de Riesgo. Rev Med Post INAH. 2001; 6: 148–153. [Google Scholar]
- 85.Hernandez-Herrera RJ, Alcala-Galvan LG, Flores-Santos R. Prevalencia de defectos del tubo neural en 248 352 nacimientos consecutivos. Revista Medica del Instituto Mexicano Seguro Social. 2008; 46: 201–204. [PubMed] [Google Scholar]
- 86.Alfaro N, de Jesús Pérez J, Figueroa I, González Y. Malformaciones congénitas externas en la zona metropolitana de Guadalajara. 10 años de estudio. Investigación en Salud, 2004; 6: 180–187. [Google Scholar]
- 87.Navarrete Hernández E, Canún Serrano S, Reyes Pablo AE, del Carmen Sierra Romero M, Valdés Hernández J. Prevalencia de malformaciones congénitas registradas en el certificado de nacimiento y de muerte fetal: México, 2009–2010. Boletín médico del Hospital Infantil de México. 2013; 70: 499–505. [Google Scholar]
- 88.Sanabria Rojas HA, Tarqui-Mamani CB, Arias Pachas J, Lam Figueroa NM. Impacto de la fortificación de la harina de trigo con ácido fólico en los defectos del tubo neural, en Lima, Perú. In Anales de la Facultad de Medicina. 2013; 74:175–180. [Google Scholar]
- 89.Castilla EE, Orioli IM, Lopez‐Camelo JS, da Graça Dutra M, Nazer‐Herrera J. Preliminary data on changes in neural tube defect prevalence rates after folic acid fortification in South America. American Journal of Medical Genetics Part A. 2003; 123: 123–128. [DOI] [PubMed] [Google Scholar]
- 90.Canfield MA, Mai CT, Wang P, O’Halloran A, Marengo LK, Olney RS, et al. The association between race/ethnicity and major birth defects in the United States, 1999–2007. American Journal of Public Health. 2014; e1–e10. [DOI] [PMC free article] [PubMed] [Google Scholar]
- 91.Dey AC, Shahidullah M, Mannan MA, Noor MK, Saha L, Rahman SA. Maternal and neonatal serum zinc level and its relationship with neural tube defects. Journal of Health, Population, and Nutrition. 2010; 28: 343–350. [DOI] [PMC free article] [PubMed] [Google Scholar]
- 92.Sarkar S, Patra C, Dasgupta MK, Nayek K, Karmakar PR. Prevalence of congenital anomalies in neonates and associated risk factors in a tertiary care hospital in eastern India. Journal of Clinical Neonatology. 2013; 2: 131–134. 10.4103/2249-4847.119998 [DOI] [PMC free article] [PubMed] [Google Scholar]
- 93.Sood M, Agarwal N, Verma S, Bhargava SK. Neural tubal defects in an east Delhi hospital. The Indian Journal of Pediatrics. 1991; 58: 363–365. [DOI] [PubMed] [Google Scholar]
- 94.Sharma AK, Upreti M, Kamboj M, Mehra P, Das K, Misra A, et al. Incidence of neural tube defects at Lucknow over a 10 year period from 1982–1991. Indian Journal of Medical Research. 1994; 99: 223–226. [PubMed] [Google Scholar]
- 95.Mahadevan B, Bhat BV. Neural tube defects in Pondicherry. The Indian Journal of Pediatrics. 2005; 72: 557–559. [DOI] [PubMed] [Google Scholar]
- 96.Duttachoudhury A, Pal SK. Congenital abnormalities in Durgapur Steel Plant Hospital with special reference to neural tube defect. Journal of the Indian Medical Association. 1997; 95: 135–141. [PubMed] [Google Scholar]
- 97.Ponne S, Lakshmi UK. Incidence of neural tube defects in Erode town. The Indian Journal of Nutrition and Dietetics. 2006; 43: 272–281. [Google Scholar]
- 98.Grover N. Congenital malformations in Shimla. The Indian Journal of Pediatrics. 2000; 6: 249–251. [DOI] [PubMed] [Google Scholar]
- 99.Taksande A, Vilhekar K, Chaturvedi P, Jain M. Congenital malformations at birth in Central India: A rural medical college hospital based data. Indian Journal of Human Genetics. 2010; 16: 159–163. 10.4103/0971-6866.73412 [DOI] [PMC free article] [PubMed] [Google Scholar]
- 100.Malla BK. One year review study of congenital anatomical malformation at birth in Maternity Hospital (Prasutigriha), Thapathali, Kathmandu. Kathmandu University Medical Journal. 2007; 5: 557–560. [PubMed] [Google Scholar]
- 101.Jaruratanasirikul S, Kor-anantakul O, Limpitikul W, Dissaneevate P, Khunnarakpong N, Sattapanyo A. Prevalence of neural tube defect in southern Thailand: a population-based survey during 2009–2012. Child's Nervous System. 2014; 30: 1269–1275. 10.1007/s00381-014-2410-y [DOI] [PubMed] [Google Scholar]
- 102.Kitisomprayoonkul N, Tongsong T. Neural tube defects: a different pattern in northern Thai population. Journal of the Medical Association of Thailand. 2001; 84: 483–488. [PubMed] [Google Scholar]
- 103.Wasant P, Sathienkijkanchai A. Neural tube defects at Siriraj Hospital, Bangkok, Thailand—10 years review (1990–1999). Journal of the Medical Association of Thailand. 2005; 88; S92–S99. [PubMed] [Google Scholar]
- 104.Flood L, Scheil W, Nguyen AM, Sage L, Scott J. An increase in neural tube defect notifications, South Australia, 2009–2010. Western Pacific Surveillance and Response Journal. 2013; 4: 30–39. 10.5365/WPSAR.2012.3.3.006 [DOI] [PMC free article] [PubMed] [Google Scholar]
- 105.Macaldowie A, Hilder L. Neural tube defects in Australia: prevalence before mandatory folic acid fortification. 2011. Canberra, Australia: Australian Institute of Health and Welfare. [Google Scholar]
- 106.Fan L, Gong T, Cao X, Du Y. Epidemiologic characteristics of birth defects in the Hainan Province from 2000 to 2010, China. Birth Defects Research Part A: Clinical and Molecular Teratology. 2013; 97: 750–754. [DOI] [PubMed] [Google Scholar]
- 107.Yang M, Zhang S, Du Y. Epidemiology characteristics of birth defects in Shenzhen city during 2003 to 2009, China. The Journal of Maternal-Fetal & Neonatal Medicine. 2015; 28: 799–803. [DOI] [PubMed] [Google Scholar]
- 108.Li X, Zhu J, Wang Y, Mu D, Dai L, Zhou G, et al. Geographic and urban—rural disparities in the total prevalence of neural tube defects and their subtypes during 2006–2008 in China: a study using the hospital-based birth defects surveillance system. BMC Public Health. 2013; 13: 161 10.1186/1471-2458-13-161 [DOI] [PMC free article] [PubMed] [Google Scholar]
- 109.Zhang X, Li S, Wu S, Hao X, Guo S, Suzuki K, et al. Prevalence of birth defects and risk-factor analysis from a population-based survey in Inner Mongolia, China. BMC Pediatrics. 2012; 12: 125 10.1186/1471-2431-12-125 [DOI] [PMC free article] [PubMed] [Google Scholar]
- 110.Dai L, Zhu J, Liang J, Wang YP, Wang H, Mao M. Birth defects surveillance in China. World Journal of Pediatrics. 2011; 7: 302–310. 10.1007/s12519-011-0326-0 [DOI] [PubMed] [Google Scholar]
- 111.Zhang XH, Qiu LQ, Huang JP. Risk of birth defects increased in multiple births. Birth Defects Research Part A: Clinical and Molecular Teratology. 2011; 91: 34–38. [DOI] [PubMed] [Google Scholar]
- 112.Chen G, Pei LJ, Huang J, Song XM, Lin LM, Gu X, et al. Unusual patterns of neural tube defects in a high risk region of northern China. Biomedical and Environmental Sciences. 2009; 22: 340–344. 10.1016/S0895-3988(09)60065-9 [DOI] [PubMed] [Google Scholar]
- 113.Li Y, Liu XH, Wang FY, Zhao XL, Zhang X, Zhang YP. Analysis of the birth defects among 61 272 live born infants in Beijing. Journal of Peking University, Health Sciences. 2009; 41: 414–417. [PubMed] [Google Scholar]
- 114.Liu J, Yang GZ, Zhou JL, Cao SP, Chau DH, Kung HF, et al. Prevalence of neural tube defects in economically and socially deprived area of China. Child's Nervous System. 2007; 23: 1119–1124. [DOI] [PubMed] [Google Scholar]
- 115.Cheng N, Bai Y, Hu X, Pei H, Li Y, Zhang W, et al. A base-line survey on birth defects in Gansu province, West China. Annals of Tropical Paediatrics: International Child Health. 2003; 23: 25–29. [DOI] [PubMed] [Google Scholar]
- 116.Chen BY, Hwang BF, Guo YL. Epidemiology of congenital anomalies in a population-based birth registry in Taiwan, 2002. Journal of the Formosan Medical Association. 2009; 108: 460–468. 10.1016/S0929-6646(09)60093-0 [DOI] [PubMed] [Google Scholar]
- 117.Imaizumi Y, Yamamura H, Nishikawa M, Matsuoka M, Moriyama I. The prevalence at birth of congenital malformations at a maternity hospital in Osaka City, 1948–1990. Japanese Journal of Human Genetics, 1991; 36: 275–287. [DOI] [PubMed] [Google Scholar]
- 118.Seto T, Nakagawa H, Morikawa Y, Nishijo M, Miura K, Kadoshima Y. Trend of congenital anomalies over 20 years ascertained by population-based monitoring in Ishikawa Prefecture, Japan. Congenital Anomalies. 2003; 43: 286–293. [DOI] [PubMed] [Google Scholar]
- 119.Kim MA, Yee NH, Choi JS, Choi JY, Seo K. Prevalence of birth defects in Korean livebirths, 2005–2006. Journal of Korean Medical Science. 2012; 27: 1233–1240. 10.3346/jkms.2012.27.10.1233 [DOI] [PMC free article] [PubMed] [Google Scholar]
- 120.Boo NY, Cheah IG, Thong MK. Neural tube defects in Malaysia: data from the Malaysian National Neonatal Registry. Journal of Tropical Pediatrics. 2013; 59: 338–342. 10.1093/tropej/fmt026 [DOI] [PubMed] [Google Scholar]
- 121.Dryden R. Birth defects recognized in 10,000 babies born consecutively in Port Moresby General Hospital, Papua New Guinea. Papua New Guinea Medical Journal. 1997; 40: 4–13. [PubMed] [Google Scholar]
- 122.Shi LM, Chia SE, Chan OY, Chew SK, Foong BH. Prevalence of birth defects and parental work in Singapore live births from 1994 to 1998: a population-based study. Occupational Medicine. 2002; 52: 325–331. [DOI] [PubMed] [Google Scholar]
- 123.Hoang T, Nguyen PVN, Tran DA, Gillerot Y, Reding R, Robert A. External birth defects in southern Vietnam: a population-based study at the grassroots level of health care in Binh Thuan province. BMC Pediatrics. 2013; 13: 67 10.1186/1471-2431-13-67 [DOI] [PMC free article] [PubMed] [Google Scholar]
- 124.Dudin A. Neural tube defect among Palestinians: a hospital-based study. Annals of Tropical Paediatrics. 1997; 17: 217–222. [DOI] [PubMed] [Google Scholar]
- 125.World Health Organization. Countries. 2015. Available: http://www.who.int/countries/en/. Accessed 2015 Jul 8.
- 126.Luquetti DV, Koifman RJ. Validity and reliability of the Brazilian birth defects certificate for reporting birth defects. Journal of Registry Management. 2010; 37: 112–120. [PubMed] [Google Scholar]
- 127.Bower C, Stanley FJ. Dietary folate as a risk for neural-tube defects: evidence from a case-control study in Western Australia. The Medical Journal of Australia. 1989; 150: 613–619. [DOI] [PubMed] [Google Scholar]
- 128.Yan L, Zhao L, Long Y, Zou P, Ji G, Gu A, et al. Association of the maternal MTHFR c677T polymorphism with susceptibility to neural tube defects in offsprings: evidence from 25 case-control studies. PloS One. 2012; 7; e41689 10.1371/journal.pone.0041689 [DOI] [PMC free article] [PubMed] [Google Scholar]
- 129.De Wals P, Tairou F, Van Allen MI, Uh SH, Lowry RB, Sibbald B, et al. Reduction in neural-tube defects after folic acid fortification in Canada. New England Journal of Medicine. 2007; 357: 135–142. [DOI] [PubMed] [Google Scholar]
- 130.Borman B, Cryer C. Fallacies of international and national comparisons of disease occurrence in the epidemiology of neural tube defects. Teratology. 1990; 42: 405–412. [DOI] [PubMed] [Google Scholar]
- 131.WHO/CDC/ICBDSR. Birth defects surveillance: a manual for programme managers. Geneva: World Health Organization; 2014. [Google Scholar]
- 132.WHO/CDC/ICBDSR. Birth defects surveillance: atlas of selected congenital anomalies. Geneva: World Health Organization; 2014. [Google Scholar]
- 133.U.S. Centers for Disease Control and Prevention. Folic acid: Birth Defects COUNT. 2014 Oct 14. Atlanta. Available: http://www.cdc.gov/ncbddd/birthdefectscount/cdc.html. Accessed 2015 Apr 14.
Associated Data
This section collects any data citations, data availability statements, or supplementary materials included in this article.
Supplementary Materials
(DOC)
(DOCX)
Data Availability Statement
All relevant data are within the paper and its Supporting Information files.