Abstract
Cancer stem cells (CSCs) are defined as a subset of slow cycling and undifferentiated cells that divide asymmetrically to generate highly proliferative, invasive, and chemoresistant tumor cells. Therefore, CSCs are an attractive population of cells to target therapeutically. CSCs are predicted to contribute to a number of types of malignancies including those in the blood, brain, lung, gastrointestinal tract, prostate, and ovary. Isolating and enriching a tumor cell population for CSCs will enable researchers to study the properties, genetics, and therapeutic response of CSCs. We generated a protocol that reproducibly enriches for ovarian cancer CSCs from ovarian cancer cell lines (SKOV3 and OVCA429). Cell lines are treated with 20 µM cisplatin for 3 days. Surviving cells are isolated and cultured in a serum-free stem cell media containing cytokines and growth factors. We demonstrate an enrichment of these purified CSCs by analyzing the isolated cells for known stem cell markers Oct4, Nanog, and Prom1 (CD133) and cell surface expression of CD177 and CD133. The CSCs exhibit increased chemoresistance. This method for isolation of CSCs is a useful tool for studying the role of CSCs in chemoresistance and tumor relapse.
Keywords: Medicine, Issue 91, cancer stem cells, stem cell markers, ovarian cancer, chemoresistance, cisplatin, cancer progression
Introduction
Resistance to chemotherapy is a major impediment to the treatment and cure of cancer. Ovarian cancer is the 5th leading cause of cancer-related deaths among women in the United States (American Cancer Society Facts and Figures 2013). Patients initially respond well to chemotherapy, but most patients relapse1. After relapse patients are treated with a variety of additional chemotherapy agents with very little benefit2. General properties of CSCs include unlimited proliferative capabilities, retention of an undifferentiated state, resistance to drug treatment, efficient DNA repair, and ability to generate malignant tumor cells with different phenotypes3. CSCs frequently exhibit expression of stem cell genes such as Nanog, Oct4, Sox2, Nestin, CD133, and CD117. CSCs often express elevated levels of ABCG2, and ALDH genes that may contribute to drug efflux and metabolism3,4.
The first definitive evidence for CSCs was demonstrated by isolating acute myeloid leukemia-initiating cells that were capable of self-renewal and tumor generation5. These leukemic stem cells expressed surface CD34 and generated leukemia in NOD/SCID (immunocompromised) mice5. Since then CSCs have been identified in many cancer types including leukemias/lymphomas, breast, bladder, colorectal, endometrial, sarcomas, hepatocellular carcinoma, melanomas, gliomas, ovarian, pancreatic, prostate, squamous cell carcinoma, and lung6. Therefore, being able to study this subtype of cancer cell is advantageous.
The goal of this study is to create a protocol for the selection and isolation of chemoresistant CSCs. Several methods have been reported for the isolation of CSCs from ovarian cancer cell lines. Non-adherent spheroids isolated from OVCAR-3, SKOV3, or HO8910 cultures demonstrate stem-like properties7,8. Isolation of CD133+ cells from OVCAR-3 cultures also yields CSCs. CSCs have also been selected in culture by treatment with chemotherapeutic agents. Treating tumor cell lines (OVCA433, Hey, and SKOV3 cells) with cisplatin and paclitaxel allows for the expansion and isolation of CSCs4,9. While culture of some cell types in CSC media leads to isolation of CSCs, SKOV3 cells did not survive culture in serum-free media or form sphere cells4. Therefore, treatment of cells with cisplatin and paclitaxel aided the expansion or isolation of this population4.
Using a modification of the procedure presented by Ma and colleagues4 we developed a method to isolate CSCs from the ovarian cancer cell lines. Our protocol is advantageous as it yields more viable cells while using less toxic chemotherapeutic agents. Cells are treated with cisplatin and subsequently grown in serum-free media supplemented with growth factors (stem cell media). We isolate the resulting non-adherent sphere cells and assay them for their expression of stem cell markers. This model enables the study of CSC properties and response to drug therapy.
Protocol
1. Cell Culture and Fluorescent Labeling of Ovarian Cancer Cell Lines
Prepare SKOV3 media: McCoy media supplemented with 10% fetal bovine serum (FBS), 0.1 mM L-glutamine, 50 U/ml penicillin, and 50 μg/ml streptomycin. Maintain OVCA429 cells in minimal essential media (MEM) supplemented with 10% FBS, 1 mM sodium pyruvate, 0.1 mM L-glutamine, 50 U/ml penicillin, and 50 μg/ml streptomycin.
Propagate SKOV3 and OVCA429 cell lines in a humidified incubator at 37 °C with 5% CO2. Grow cells to 40-50% confluency.
- Generate cells expressing red fluorescent protein (RFP) in order to monitor viability in vitro and in vivo.
- To generate SKOV3 cells expressing RFP, add lentiviral particles expressing RFP and 10 μg/ml polybrene to SKOV3 media in the absence of penicillin and streptomycin for 72 hr.
- After 72 hr, select for RFP positive cells by Fluorescence Activated Cell Sorting (FACS) as follows: Trypsinize RFP and non-RFP expressing cells, centrifuge at 125 x g for 5 min, resuspend cells at 107 cells/ml in PBS containing 0.1% BSA. On a cell sorter, use non-RFP cells to determine the sorting parameters. Then collect cells that express high RFP using a 561 nm laser.
- Alternatively, if the lentiviral plasmid expresses an antibiotic resistance cassette, select for RFP expressing cells by culturing in the appropriate antibiotic (such as 10 mg/ml blasticidin). NOTE: The amount of lentiviral particles that needs to be used can vary by batch and by cell type. Proper lentiviral titer should be determined for each cell type.
2. Enrichment of Cancer Stem Cells
Treat SKOV3, SKOV3-RFP, or OVCA429 cell lines with 20 μM of cisplatin for 72 hr. CAUTION: Cisplatin is toxic. Use protective clothing/gloves and avoid contact with skin and mucus membranes. Do not dispose of cisplatin in wastewater.
Prepare CSC media: serum free DMEM/F12 media supplemented with 5 μg/ml insulin, 10 ng/ml human recombinant epidermal growth factor (EGF), 10 ng/ml basic fibroblast growth factor (bFGF), 12 ng/ml leukemia inhibitory factor, and 0.4% bovine serum albumin (BSA).
Trypsinize cells. Culture surviving cells in CSC media. NOTE: After 2 days in culture non-adherent spheroids will form.
Change media every 2 days by collecting media containing cells and centrifuging at 125 x g for 5 min. Then resuspend the pellet in fresh CSC media. Check cells for viability every 2 days by counting cells and performing trypan blue exclusion.
Then collect CSCs for further experiments by centrifuging 129 x g for 5 min and resuspending the pellet in phenol containing guanidinium thiocynate (RNA), phosphate buffered saline (PBS: 137 mM NaCl, 2.7 mM KCl, and 11.9 mM phosphate buffer, pH 7.4) with 0.1% BSA (for flow cytometry), or CSC media to continue culturing the cells.
Monitor CSC cell morphology using a light microscope at 20X and 40X magnifications.
3. CSC Characterization via Gene Expression Analysis for Stem Cell Markers
Collect 3 preparations of CSCs by collecting media containing cells, centrifuging at 129 x g for 5 min, and resuspending the pellet in a solution of phenol containing guanidinium thiocynate (other methods for RNA extraction may be used).
Prepare total RNA using TRIzol according to the manufacturer’s protocol. Synthesize complementary DNA (cDNA) from 0.1-1 µg of RNA using a commercially available cDNA Reverse Transcription kit.
- Perform quantitative reverse transcribed polymerase chain reaction (QRT-PCR).
- Make up master mix for each set of primers containing QRT-PCR mix, primers, and water to total 8 µl per sample (primers with different fluorophores can be amplified in the same well). For example, generate one master mix for Oct4-FAM, Nanog-Hex, and GAPDH-CY5. Generate separate master mixes for Nestin and Prom1. Add 2 µl of cDNA template per sample. NOTE: For this study, QRT-PCR was performed using the primers listed in Table 1.
- Perform all QRT-PCR in duplicate for each sample using a real time PCR thermocycler capable of detecting multiple fluorophores. Include no template controls.
- Normalize stem cell gene expression to GAPDH expression for each sample using the ΔΔCT method.
| Oct-4-FAM | Primer 1: 5′-CCCAAGGAATAGTCTGTAGAAGTG-3′ |
| Primer 2: 5′-TGCATGAGTCAGTGAACAGG-3′ | |
| FAM probe: 5′-CTTCCAAGC/ZEN/TGCCCACCTAACTTCT/3IABkFQ -3′ | |
| Nanog-HEX | Primer 1: 5′-CCTTCTGCGTCACACCATT-3′ |
| Primer 2: 5′-AACTCTCCAACATCCTGAACC-3′ | |
| HEX probe: 5′-CTGCCACCT/ZEN.CTTAGATTTCATTCTCTGGT/3IABkFQ-3′ | |
| GAPDH-CY5 | Primer 1: 5′-TGTAGTTGAGGTCAATGAAGGG-3′ |
| Primer 2: 5′-ACATCGCTCAGACACCATG-3′ | |
| CY5 probe: 5′-AAGGTCGGAGTCAACGGATTTGGTC/3IABRQSP-3′ | |
| NESTIN-FAM | Primer 1: 5′-AGGACCTGAGCGATCTGG-3′ |
| Primer 2: 5′-CGTTGGAACAGAGGTTGGAG-3′ | |
| FAM probe: 5′-AACTTTTCA/ZEN/GTAGCCCGCAGCC/3IABkFQ -3′ | |
| CD133-HEX | Primer 1: 5′-ACTCTCTCCAACAATCCATTCC-3′ |
| Primer 2: 5′-AAACAATTCACCAGCAACGAG-3′ | |
| HEX probe: 5′-ACAATCACT/ZEN/GAGCACTCTATACCAAAGCG/3IABkFQ-3 |
Table 1. Primers used for CSC characterization by QRT-PCR.
4. Analyzing CSCs for Cell Surface Markers CD117 and CD133
Harvest CSCs by collecting media containing cells and centrifuging at 125 x g for 5 min. Add 500 µl of a non-proteolytic cell detachment solution to break-up cells. Centrifuge cells at 125 x g for 5 min to remove cell detachment solution. Then wash cells twice with cold PBS.
Incubate in normal growth media for 1 hr prior to labeling cells. Spin down cells for 5 min at 129 x g. Resuspend cells in PBS with 0.1% BSA with anti-CD133-PE and anti-CD117-FITC.
Fix cells overnight in 1% paraformaldehyde. Caution: Paraformaldehyde is toxic (suspected carcinogen). Make in fume hood and use within a week.
Perform flow cytometry to analyze CD117 (with an anti-CD117 conjugated to FITC) and CD133 (with anti-CD133 conjugated to PE) cell surface expression on a flow cytometer. Collect data on cells in the FL1 (for FITC) and FL3 (for PE) channels. Generate gates for cells expressing both FITC and PE. Generate a dot plot with 4 quadrants (FITC- and PE-, FITC+ PE-, FITC- PE+, and FITC+ and PE+) and determine the number of cells in each quadrant.
5. Analyzing CSCs for Therapeutic Response
Plate 5,000 cells per well (SKOV3, SKOV3-RFP, SKOV3 CSC and SKOV3-RFP CSCs) on 96-well plates overnight.
Treat with cisplatin (0, 1, 10, 100, and 1,000 µM) or paclitaxel (0, 0.01, 0.1, 1, 10, and 100 µM) for 96 hr.
- Perform MTT (3-(4,5-Dimethylthiazol-2-yl)-2,5-diphenyltetrazolium bromide) cell viability assay.
- Plate 5,000 cells per 100 µl per well on a 96-well plate (plate cells in duplicate and include media only control wells).
- After 24 hr, add 10 µl of 10 mg/ml MTT. Incubate at 37 °C for 2-4 hr (until precipitate forms).
- Add 100 µl of MTT solvent 4 mM HCl, 0.1% NP-40 in isopropanol. Incubate for 15 min in dark.
- Read plates at 570 nm on a plate reader.
Representative Results
To demonstrate that we isolated CSCs from epithelial ovarian cancer cell lines using cisplatin treatment, we first acquired images of the cell lines prior to treatment and after selection. We used light microscopy to capture images of adherent (untreated) SKOV3 and OVCA429 cells and SKOV3 and OVCA429 CSCs (Figure 1). CSCs appear round and not attached to the tissue culture plates (Figures 1 and 2). We further show that SKOV3 cells transduced with RFP retain their fluorescence after isolation of the CSCs demonstrating that the cells are viable (Figure 2B).
Viable CSC cultures were assessed for their response to drug therapy. CSCs demonstrated increased resistance to cisplatin (particularly at 100 µM) and paclitaxel (10 µM) (Figure 3). CSCs are often characterized by their expression of stem cell genes. Expression of CD133 (also known as Prom1), Nestin, Nanog, and Oct4 was examined. CD133 was significantly induced in SKOV3 CSC cultures compared to untreated (control) cells (Figure 4A). CD133 was also induced in CSC cultures compared to untreated controls by 16-fold and 13-fold in the OVCA429 and OVCA429-RFP cells (data not shown). In initial experiments Oct4, Nanog, and Nestin were elevated in SKOV3 CSC cultures compared to untreated, but the results were not statistically significant (Figure 4A). Upon repeating these experiments Oct4 and Nanog increased in SKOV3 CSCs compared to parental control cells (Figure 4B). Oct4 was increased by 4.7-fold and 8-fold in the OVCA429 and OVCA429-RFP cells following the CSC enrichment protocol (not shown). Finally, SKOV3 CSCs exhibit increased cell surface expression of the CSC marker CD117 (Figure 5). In conclusion, this method allows for selection of viable spheroid CSCs (expressing stem cell markers) in ovarian cancer cell lines by selection with cisplatin and growth in stem cell media.
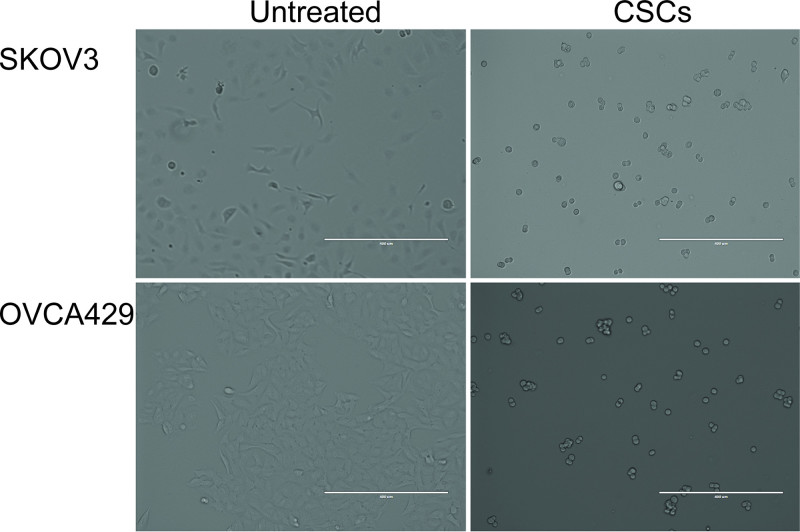 Figure 1. Morphology of SKOV3 and OVCA429 cells and cancer stem cells (CSCs) selected from SKOV3 and OVCA429 cells. Phase contrast microscopy depicts SKOV3 and OVCA429 cells (adherent) that are untreated and have been selected for CSCs (spheroid).
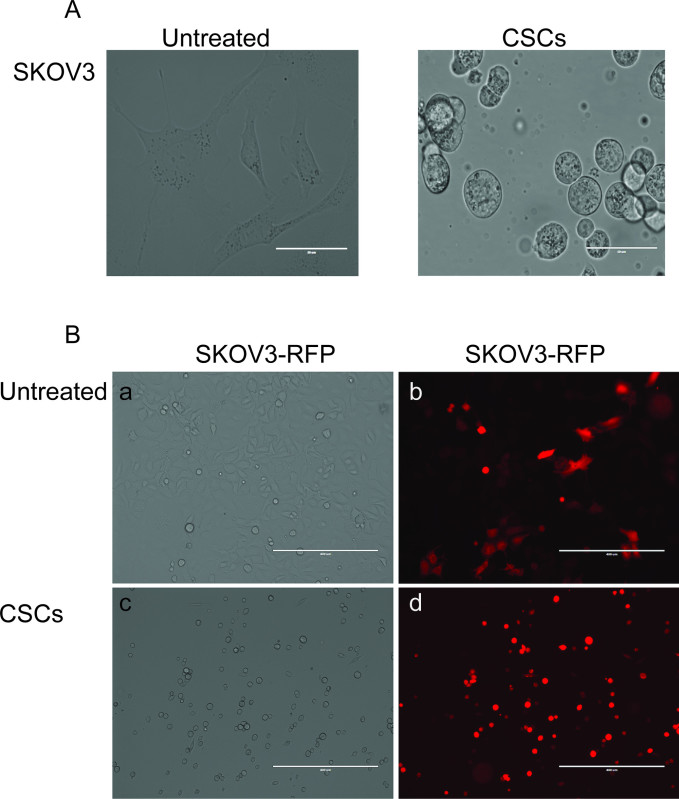 Figure 2. Enrichment for CSCs yields non-adherent spheroids. (A) SKOV3 cells untreated and enriched for CSCs (60X magnification). (B) SKOV3-RFP cells that are untreated (a and b) or enriched for CSCs (c and d). Left panels depict phase contrast images and right panels depict fluorescence. Original magnification 40X. Scale bar = 400 microns.
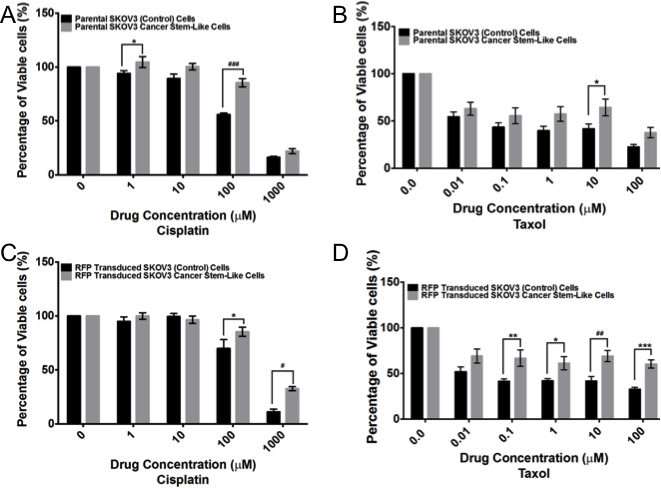 Figure 3. CSCs exhibit increased chemoresistance compared to untreated cell lines. SKOV3 (A and B) and SKOV3-RFP (C and D), SKOV3 CSCs (A and B) and SKOV3-RFP CSCs (C and D) were treated with various concentrations of cisplatin (A and C) or paclitaxel (Taxol) (B and D). 96 hr post treatment MTT assay was performed. Experiments were performed in n≥3 and statistics were calculated using Two Way ANOVA; *p<0.05, ***p<0.0005. Please click here to view a larger version of this figure.
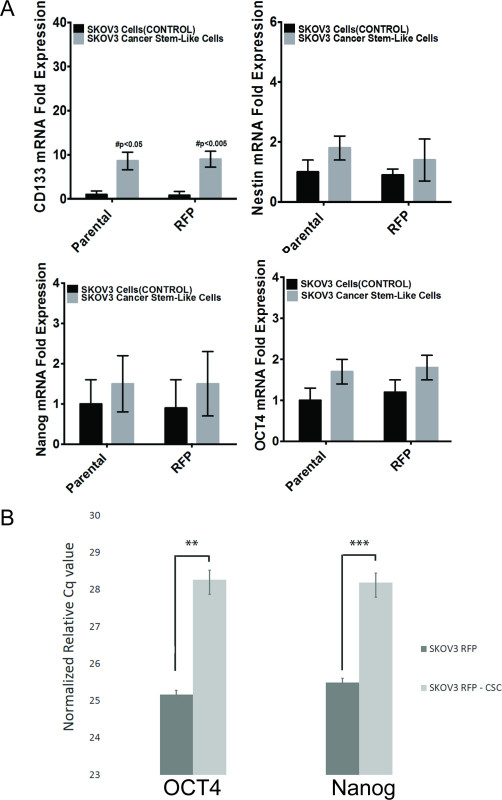 Figure 4. Stem cell marker expression in CSCs compared to untreated cells. QRT-PCR analysis was performed for SKOV3 (control) and SKOV3 CSCs. (A) CD133 (Prom1), Nestin, Nanog, and OCT4 (normalized to GAPDH). (B) An additional experiment demonstrating that the SKOV3-RFP CSCs obtained from this protocol yield cells with elevated OCT4 and Nanog compared to untreated cells. Results were normalized with GAPDH expression. N=3 and statistics were calculated using students T-test; **p<0.02, ***p<0.002.
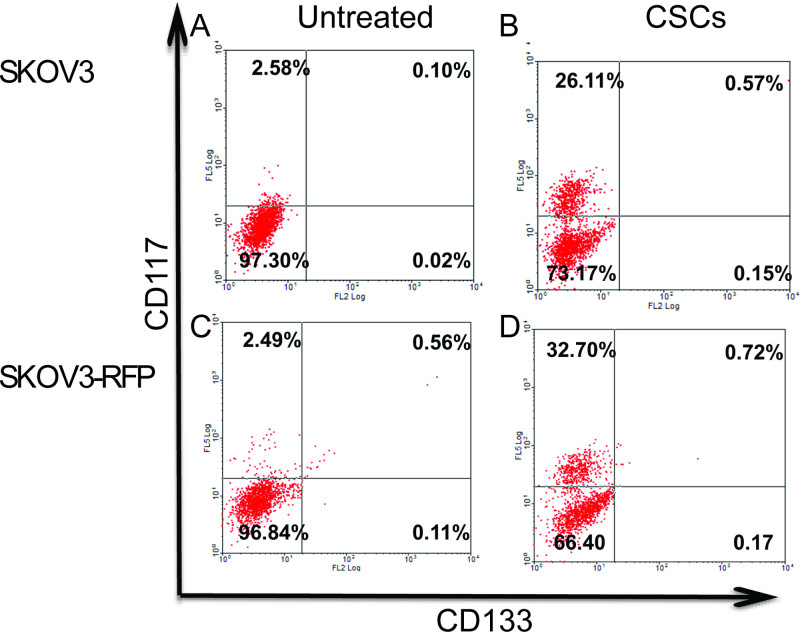 Figure 5. Flow Cytometry Analysis of stem cell markers in SKOV3 cells and SKOV3 CSCs alone or transduced or without RFP. CD133, CD117, and CD133/CD117 expression in (A) SKOV3 (untreated/control) cells, (B) SKOV3 CSCs, (C) SKOV3-RFP untreated cells, and (D) SKOV3-RFP CSCs. Experiments were performed in triplicate. Please click here to view a larger version of this figure.
Discussion
CSCs that are resistant to therapy may be accountable for relapse after treatment of primary tumor. Characterization of CSCs may lead to improved therapies for ovarian cancer. The critical parameters in the establishment of chemoresistant CSCs using the above protocol are timing the length of treatment with chemotherapy and the concentration of chemotherapy. When using the protocol in Ma et al. it was found that after 7 days of treatment with cisplatin and paclitaxel, no viable cells remained4. By reducing the treatment to 3 days (with 20 µM cisplatin instead of 40 µM cisplatin and 10 µM paclitaxel), viable chemoresistant cells and CSCs developed. The length and dose of treatment may need to be altered for different ovarian cancer cell lines.
The major limitation of this protocol is the length that the CSCs remain viable. Using this protocol, the CSCs remain viable for less than a week. Therefore, the types of experiments and analysis for the CSCs need to be carefully timed.
Further characterization of the CSCs needs to be conducted. It would be useful to compare this method of CSCs to other methods of CSC generation to determine the similarity and difference between these cell types. Comparison of stem cell markers, response to therapy, and best system for in vivo analysis needs to be conducted between different methods for generating/selection of CSCs. It has been suggested that there are different types of CSCs with different expression patterns of stem cell markers and different prognosis for patients10-12, thus further definition of what type of CSCs are generated by this protocol may help determine how they relate to human malignancy. Finally, in order to rigorously demonstrate that the CSCs isolated from this protocol are definitive CSCs, cells need to be injected into immunocompromised mice in a limiting dilution assay. This assay demonstrates that CSCs are able to generate ovarian tumors at a low density.
Disclosures
The authors declare they have no competing financial interest.
Acknowledgments
Serene Samyesudhas and Dr. Lynn Roy assisted in preparing samples for filming.
References
- Pennington K, Pulaski H, Pennington M, Liu JR. Too Much of a Good Thing: Suicide Prevention Promotes Chemoresistance in Ovarian Carcinoma. Curr Cancer Drug Targets. 2010;10:575–583. doi: 10.2174/156800910791859498. [DOI] [PubMed] [Google Scholar]
- Thigpen T. A rational approach to the management of recurrent or persistent ovarian carcinoma. Clin Obstet Gynecol. 2012;55:114–130. doi: 10.1097/GRF.0b013e31824b9bc5. [DOI] [PubMed] [Google Scholar]
- Burgos-Ojeda D, Rueda BR, Buckanovich RJ. Ovarian cancer stem cell markers: prognostic and therapeutic implications. Cancer letters. 2012;322:1–7. doi: 10.1016/j.canlet.2012.02.002. [DOI] [PMC free article] [PubMed] [Google Scholar]
- Ma L, Lai D, Liu T, Cheng W, Guo L. Cancer stem-like cells can be isolated with drug selection in human ovarian cancer cell line SKOV3. Acta Biochim Biophys Sin (Shanghai) 2010;42:593–602. doi: 10.1093/abbs/gmq067. [DOI] [PubMed] [Google Scholar]
- Bonnet D, Dick JE. Human acute myeloid leukemia is organized as a hierarchy that originates from a primitive hematopoietic cell. Nature Medicine. 1997;3:730–737. doi: 10.1038/nm0797-730. [DOI] [PubMed] [Google Scholar]
- Alison MR, Lim SM, Nicholson LJ. Cancer stem cells: problems for therapy. The Journal of pathology. 2011;223:147–161. doi: 10.1002/path.2793. [DOI] [PubMed] [Google Scholar]
- Luo X, Dong Z, Chen Y, Yang L, Lai D. Enrichment of ovarian cancer stem-like cells is associated with epithelial to mesenchymal transition through an miRNA-activated AKT pathway. Cell proliferation. 2013;46:436–446. doi: 10.1111/cpr.12038. [DOI] [PMC free article] [PubMed] [Google Scholar]
- Wang L, Mezencev R, Bowen NJ, Matyunina LV, McDonald JF. Isolation and characterization of stem-like cells from a human ovarian cancer cell line. Molecular and cellular biochemistry. 2012;363:257–268. doi: 10.1007/s11010-011-1178-6. [DOI] [PubMed] [Google Scholar]
- Abubaker K, et al. Short-term single treatment of chemotherapy results in the enrichment of ovarian cancer stem cell-like cells leading to an increased tumor burden. Molecular cancer. 2013;12:24. doi: 10.1186/1476-4598-12-24. [DOI] [PMC free article] [PubMed] [Google Scholar]
- Conic I, Dimov I, Tasic-Dimov D, Djordjevic B, Stefanovic V. Ovarian epithelial cancer stem cells. ScientificWorldJournal. 2011;11:1243–1269. doi: 10.1100/tsw.2011.112. [DOI] [PMC free article] [PubMed] [Google Scholar]
- Liu KC, et al. Ovarian cancer stem-like cells show induced translineage-differentiation capacity and are suppressed by alkaline phosphatase inhibitor. Oncotarget. 2013;4(12):2366–2382. doi: 10.18632/oncotarget.1424. [DOI] [PMC free article] [PubMed] [Google Scholar]
- Liu T, Cheng W, Lai D, Huang Y, Guo L. Characterization of primary ovarian cancer cells in different culture systems. Oncology reports. 2010;23:1277–1284. doi: 10.3892/or_00000761. [DOI] [PubMed] [Google Scholar]


