Abstract
Behavioral responses of aquatic organisms to environmental contaminants can be precursors of other effects such as survival, growth, or reproduction. However, these responses may be subtle, and measurement can be challenging. Using juvenile white sturgeon (Acipenser transmontanus) with copper exposures, this paper illustrates techniques used for quantifying behavioral responses using computer assisted video and digital image analysis. In previous studies severe impairments in swimming behavior were observed among early life stage white sturgeon during acute and chronic exposures to copper. Sturgeon behavior was rapidly impaired and to the extent that survival in the field would be jeopardized, as fish would be swept downstream, or readily captured by predators. The objectives of this investigation were to illustrate protocols to quantify swimming activity during a series of acute copper exposures to determine time to effect during early lifestage development, and to understand the significance of these responses relative to survival of these vulnerable early lifestage fish. With mortality being on a time continuum, determining when copper first affects swimming ability helps us to understand the implications for population level effects. The techniques used are readily adaptable to experimental designs with other organisms and stressors.
Keywords: Neuroscience, Issue 108, Behavior, toxicity, copper, video analysis, swimming activity, digital tracking, diluter, white sturgeon, Acipenser transmontanus
Introduction
Understanding how contaminant exposure can affect behavior is at times very challenging and subjective. Behavior is typically defined as a series of overt, observable, whole-body activities that operate through the central nervous system and enable an organism to survive, grow, and reproduce. Changes in behavior due to exposure to a toxicant are among the most sensitive indicators of environmental stress often between 10-100 times more sensitive when compared to survival1. The majority of these studies examined swimming activity, ventilation, and foraging behavior of fish2,3,4. Swimming activity is the most frequently used sublethal endpoint in determining a behavioral change in response to a contaminant in toxicity tests5. Swimming variables include the frequency and duration of movement, speed and distance travelled, the frequency and angle of turns, position in the water column and the pattern of swimming. Swimming activity is an effective measure of swimming behavior when assessing sensitivity to a toxicant based on the criteria proposed in Chapter 9 by Rand6 in the book Fundamentals of Aquatic Toxicology.
This paper presents a toxicological study as an example of how the toxicity of copper to early life-stage white sturgeon (Acipenser transmontanus) at various stages of early development in water-only exposures relative to sturgeon swimming behavior was evaluated and illustrates methods for quantifying swimming behavior.
In previous studies, adverse behavioral responses were evident with early onset during the first few days of acute and chronic exposures to copper and became progressively more severe over exposure duration and concentration7,8,9. The magnitude and timing of the onset of these behavioral responses are likely sufficient to limit long-term survival and thus are of concern given the implications for recruitment failure10. In order to accurately interpret the significance of this sensitivity to metal exposure methods and procedures were developed for quantifying the time course and extent of behavioral impairments relative to copper concentrations.
Test protocols for behavioral function and development were established by analyzing overhead video samples of sturgeon in exposure chambers. The video samples provided qualitative assessment of development and function among copper treatments throughout the exposure period. Behavior and shelter-seeking activity were evaluated during exposures to aqueous copper concentrations to determine the time to effect and to characterize the temporal sequence of impairment that affects shelter seeking, lethargy, swimming coordination, equilibrium, and respiration. In addition, video recordings were made of sturgeon subsampled from each replicate for the purpose of quantitatively documenting spontaneous swimming activity. These endpoints included measures of duration or the time spent moving, swimming speed and distance travelled5,11 using a commercially available digital image analysis software package. This software defines the outline of each image within a field of view and from this, defines the centroid for each image. The software then can track the position of each centroid in a frame by frame succession to determine the paths of movement.
This study complied with all applicable sections of the Final Rules of the Animal Welfare Act regulations (9 CFR) and with all institutional guidelines for the humane treatment of the test organisms during culture and experimentation. Upon termination of the study, all fish were euthanized according to appropriate guidelines as approved by the Institutional Animal Care and Use Committee for the U.S. Geological Survey, Columbia Environmental Research Center.
Protocol
1. Setup Diluter for Larval Sturgeon Exposure to Aqueous Copper Concentrations
Set up exposures using a flow-through system such as a modified Mount and Brungs12 diluter system following guidelines by the ASTM International13,14,15.
Select 25 µg/L as the high copper concentration based on previous test results where effects were observed around 4-6 µg/L. Use reagent grade copper II sulfate pentahydrate (>98% purity) and mix up a test stock solution. NOTE: Example concentration series for the exposures are 25, 12.5, 6.25, 3.125, 1.0625, and 0 µg/L. Using 50% serial dilutions starting with 25 µg/L as the high concentration will target a range of concentrations observed to cause behavioral impairment.
Prepare the test stock solution in a volumetric flask 48 hours prior to the initiation of the exposure and set to deliver to spike the diluter mixing chamber using an automated syringe dispenser.
Use a spreadsheet template to determine the weight of chemical to be added to 1 L of deionized water that will result in 25 µg/L copper concentration, when diluter mixing chamber is spiked with 1 ml of the test stock solution. NOTE: Figure 1 depicts an example of a spreadsheet template for chemical stock preparation for diluter toxicity tests.
Weigh out 195 mg of reagent grade copper II sulfate pentahydrate using an analytical balance and pour into a 1 L volumetric flask and mix with 1 L of deionized water for a stock concentration of 48.65 mg/L.
Place the intake tube from the automated syringe dispenser into the test stock solution and set the spike volume to 1 ml and turn the diluter on by flipping the power switch and let cycle for 48 hr allow it to equilibrate to the corresponding copper concentration prior to stocking sturgeon.
Attach an in-line 4-way flow splitter16 to each delivery line to partition water flow to each of the four replicate exposure chambers in the diluter water bath. Gravity feed the water. Cycle the water through the diluter when the power to the diluter turns on and a solenoid valve is opened allowing water to flow to the dilution tanks. Set chiller unit to 15 °C and turn on water pump to circulate water in the diluter water bath. NOTE: This process is regulated by the use of an automated timer.
Set the diluter to cycle every 30 min using the automated timer and to deliver 250 ml of test water with each cycle, resulting in 12 volume additions per day to each replicate test chamber.
Select exposure test chambers based on the size of the sturgeon to maintain acceptable loading rate which is <10 g fish wet weight/L in any chamber at any given time. For example, to conduct exposures with 30 day-post-hatch (dph) white sturgeon (average weight in grams 0.17 g) use 12 x 21.5 cm2 glass jars with a 4 cm hole in the side. Cover this side with a 30 micron mesh stainless steel screen to allow for flow through of the test water. The volume of test water in the exposure jars is 1 L.
Using a 50 ml plastic syringe take two replicate 50 ml water samples at each concentration for a total of 12 samples and dispense test water into 100 ml glass beakers and measure dissolved oxygen (DO), temperature, conductivity, pH, alkalinity, hardness, total ammonia, major cations, major anions and dissolved organic carbon using standard commercial equipment and follow the manufacturer's instructions. NOTE: samples should be taken at the initiation and end of exposure.
To collect sub-samples for chemical analysis, use a 25 ml plastic syringe, draw up approximately 24 ml of test water from the exposure chambers using a sipper straw attached to the syringe instead of a needle.
Remove the sipper straw from the syringe and place a polypropylene filter cartridge housing a 0.45 µm pore size, polyethersulfone membrane on the plastic syringe.
Push 4 ml of test water through the filter and dispose.
Dispense the remaining 20 ml of test water through the filter into an acid-cleaned polyethylene bottle and acidify to 1% volume/volume with high-purity, 16 M nitric acid for storage of up to 3 months. NOTE: Samples for chemical analysis should be taken at the initiation, middle and end of exposure to confirm copper concentrations.
Perform chemical analysis using inductively coupled plasma mass spectrometry following U.S. Environmental Protection Agency Method 6020a17
After taking all water samples and the diluter is cycling, stock 10 (random, haphazardly) sturgeon in each replicate test chamber. Collect the sturgeon from the culture tank where they are housed using a small mesh non-abrasive net. Place sturgeon in a small bucket with culture water. A total of 240 fish are needed to start the exposure.
Do not feed the fish during the exposure. NOTE: Please refer to Figure 1 for a visual setup of the diluter layout.
Read the test every day for the duration of the exposure and record fish mortality and monitor swimming behavior. NOTE: Other endpoints to look for include lethargy, loss of equilibrium, changes in respiration, changes in pigmentation, position fish are in the water column, hiding activity and any other abnormalities that can be visually identified. NOTE: Read the test at the same time each day for consistency.
Measure and quantify swimming activity (time fish spent moving, velocity and the distance moved) using a commercially available digital tracking software program.
2. Observations and Mortality Counts During Exposure
Visually inspect each test chamber and note mortality and observations of abnormal behavior using a behavioral checklist (Table 1) on the datasheets approximately at the same time daily during the 96 hr exposure, preferably in the morning. NOTE: Behaviors that are strikingly, uncharacteristically, subjectively, qualitatively different from the controls are considered abnormal. Optimally the observer is unaware of the treatments. NOTE: The loss of equilibrium is defined as the inability of fish to maintain an upright position within the water column and immobility is defined as the inability of fish to move or swim unless prodded. Other abnormalities such as lethargy, hyperactivity, increases or decreases in respiration, color changes, tremors, spasms, bloated abdomens, position in the water column and any other unusual swimming patterns should also be recorded on the data sheet. NOTE: Refer to Video 1 for examples of abnormal behavior.
Record and remove dead sturgeon daily.
Using a hand held Dissolved Oxygen (DO) meter with probe measure the dissolved oxygen in situ and record water temperature in two replicates of each exposure concentration and record on the data sheet.
3. Videotaping Swimming Activity
Capture video data samples using a hand-held video camera mounted to a tripod positioned directly overhead of the testing chamber to document behavioral abnormalities.
To quantify swimming activity, cut a piece of PVC pipe 13 cm in diameter and 13 cm tall to use as the test arena (Figure 1). Place the PVC pipe in the diluter within each corresponding copper concentration exposure tanks. Use the area within the PVC pipe as the test arena as this is large enough for sturgeon to swim about freely.
At the end of the 96 hr exposure, randomly subsample 5 surviving sturgeon from each copper concentration to measure for swimming activity and place them in to the test arena using a small mesh net. NOTE: In the higher test concentrations where sturgeon mortality was prevalent, any remaining surviving sturgeon should be used to measure swimming activity and in some cases might be less than 5.
After placing the fish in to the test arena, allow the fish to acclimate for a period of 30 min. NOTE: Successful, error free analysis of the video requires a high contrast image of the fish against a background with a minimum of structure that might obscure or hide the image of the fish. The image of the fish must be in good focus and must be free of surface glare or free of distortions due to moving water so the diluter system must be turned off.
After 30 min, turn the video camera ON and set to REC to record the swimming activity for a period of 2 min.
Euthanize the fish after taking the video recordings to determine behavior.
Place sturgeon in a concentrated solution of tricaine methanesulfonate (MS222) water for at least 10 min to allow for cessation of opercular movement. NOTE: A concentration of at least 250 mg/L is recommended and might be much higher for certain species.
Place the euthanized sturgeon in a plastic zip lock bag and place in the freezer for disposal at a later time. Turn the video camera OFF and transfer all video files to a computer for post processing using digital tracking software.
4. Measures of Swimming Activity from Video Playback
Locate the data sheet and video data files for the experiment to be analyzed. Convert video files to a compatible format the digital analysis software can handle.
Upload all files to be processed into software. Open tracking software by clicking on the icon. Click on the "New default experiment" under the "Create a new experiment" option on main screen.
Enter name for experiment in "New Experiment" dialog box that appears on screen. Choose location experiment file is to be saved. Click "OK". Choose "Experiment Settings" option under "Setup".Choose "From video file" under "Video Source".
Select "1" for "Number of arenas". Select "3" for "Number of subjects per arena". Select "Center-point detection" under "Tracked Features". Select desired units.
Select "Trial list" option under "Setup". Click "Add Videos" at top of screen. Choose "Alphabetical order" under "Sort order" option on "Add Videos" dialog box that appears on screen. Click "Browse". Navigate to folder where video files are located.
Highlight all video files. Click "Open". Click "Add Variable" at top of screen. Enter "Concentration" into "Label" box. Enter "Copper concentration in micrograms/L" into "Description" box.
Choose "Numerical" from drop down list for "Type". Click on "Predefined Values" box. Choose "Define Individual values" option in the "Predefine Numerical Values" dialog box that appears.
Enter "0", "3", "6", "13", "25", and "50" in "Predefined Value" space. Click "Add >>" between each number addition. Uncheck "Allow other values" option. Click "OK".
Choose "Trial" from drop down menu in "Scope" box. Enter appropriate concentration for each trial in boxes provided. Click "Add Variable" at top of screen. Enter "Replicate" into "Label" box. Enter "Replicate number" into "Description" box. Choose "Numerical" from drop down list for "Type".
Click on "Predefined Values" box. Choose "Define Individual values" option in the "Predefine Numerical Values" dialog box. Enter "1", "2", "3" and "4" in "Predefined Value" space. Click "Add >>" between each number addition. Uncheck "Allow other values" option.Click "OK".
Choose "Trial" from drop down menu in "Scope" box. Enter appropriate replicate number for each trial in boxes provided. Choose "Arena Settings" under "Setup" tab at top of screen. Name first setting "Trial 1". Click "Grab Background Image" option from "Arena Settings (Trial 1)" dialog box.
Click "Browse" on the "Grab Background Image" dialog box. Locate video file for Trial 1 and click "Open". Click "Grab" option in the "Grab Background Image" dialog box after video appears. Click the white circle icon near top of screen under "Arena Settings".
Manipulate circle that appears so that entire swimming area is enclosed in the circle. Hatch marks appear where the arena area is defined. Click "Calibration Scale" icon near top of screen under "Arena Settings". Left click on one edge of arena. Hold and drag mouse over to opposite end of arena. Release left click.
Enter "10.5" in "Real world distance" box in the "Calibration Distance" dialogue box that appears. Click "OK". If necessary, adjust calibration line so that it spans the entire diameter of circular arena.
Click "Validate Arena Settings" option on "Arena Settings (Trial 1)" dialogue box. Address any issues if settings are not validated. Right click "Arena Settings" under "Setup" option from the "Experiment Explorer" toolbar on left of screen and choose "New" from menu.
Repeat steps 4.11-4.15 until arena settings have been created for each trial. Be sure to choose the appropriate video file for each trial. Choose "Detection Settings" under "Setup" option from the "Experiment Explorer" toolbar on left of screen.
Choose "Dynamic Subtraction" from dropdown menu under "Method" in the "Detection Settings: Detection Settings 1" dialogue box that appears.Choose different fill colors for each subject under "Subject Identification" in the "Detection Settings: Detection Settings 1" dialogue box.
Choose "Select Video" and locate video for Trial 1.Click "Open".Select "5.9941" from "Sample rate" box under "Video" in the "Detection Settings: Detection Settings 1" dialogue box. Click "Settings" for the "Reference image" option under "Detection" in the "Detection Settings: Detection Settings 1" dialogue box.
Click "Start Learning (C)" option in the "Reference Image" dialogue box.Wait for program to learn reference image. Once the image in "Reference Image" dialogue box appears without animals, click "Use dynamic reference image" under "Acquisition settings" within the dialogue box.
Click "Close". Choose "Darker" from the drop down menu for "Subject is" under "Detection" in the "Detection Settings: Detection Settings 1" dialogue box. Set smaller number to "33" and larger number to "153" for "Dark contrast" under "Detection" "Detection Settings: Detection Settings 1" dialogue box.
Click "Save Changes" at bottom right of "Detection Settings: Detection Settings 1" dialogue box. Click the play button on the "Playback Control" dialogue box and confirm that software is successfully tracking animals as opposed to shadows or debris. Adjust numbers for "Dark contrast" as necessary.
Once tracking is appropriate, click "Save Changes" at bottom right of "Detection Settings: Detection Settings 1" dialogue box. Choose "Acquisition" under "Setup" option from the "Experiment Explorer" toolbar on left of screen.
Click "Track next planned trial" in the "Acquisition Settings" dialogue box. Confirm the correct trial, video and arena setting is displayed under "Settings" in the "Acquisition Settings" dialogue box.
Check the "Detection determines speed" option in the "Acquisition Control" dialogue box. Click the button with the green circle enclosed in a white square to begin the acquisition process. Repeat steps 4.22-4.23 until all trials have been tracked.
Click "Data Profiles" under "Analysis" option from the "Experiment Explorer" toolbar on left of screen.Choose "Time" under "Nesting" option in the "Components" toolbar. Adjust "To" to "0:02:00" under the "Select track time interval" heading in the "Time" dialogue box. Click "OK".
Drag the "Nest" box between the "Start" box and the "Result 1" box in the "Data Profiles" area on the right side of the screen. Click "Analysis Profile" under the "Analysis" option from the "Experiment Explorer" toolbar on left of screen. Click "Velocity" under the "Distance and Time" heading in the "Dependent Variables" toolbar that appears.
Click "Add" on the "Velocity" dialogue box. Click "Distance moved" under the "Distance and Time" heading in the "Dependent Variables" toolbar. Click "Add" on the "Distance moved" dialogue box. Click "Movement" under the "Individual Behavior" heading in the "Dependent Variables" toolbar.
Adjust "Averaging interval" to "1" under the "Outlier filter" heading in the "Movement" dialogue box. Adjust "Start velocity" to "2.00" and "Stop velocity" to "1.75" under the "Threshold" heading in the "Movement" dialogue box.
Check both boxes for "Moving" and "Not moving" under the "Calculate statistics for" heading in the "Movement" dialogue box. Click "Add" at the bottom of the "Movement" dialogue box. Click "Analysis Output" under "Results" option in the "Experiment Explorer" toolbar on left of screen. Click "Calculate" at top of screen.
Once dependent variables are calculated, click "Export" at top of screen. Choose destination folder in "Export Analysis Output" dialogue box. Select "Excel" from "File type" dropdown menu in the "Export Analysis Output" dialogue box. Click "OK".
Click "Save Experiment" under the "File" tab at the top of the screen. Close the digital tracking software. Import the data to a spreadsheet file and analyze using a commercial statistical analysis software package.
Representative Results
Manually processing the visual observational data showed percent abnormalities increased with increasing copper concentration after just 72 hr of exposure initiated with 2 day post hatch (dph) sturgeon (Figure 2). The video samples documented the extreme impact of copper exposure on sturgeon swimming behavior (Video 2) and aided in defining the behavioral impairment as a result. In another example, sturgeon at 30 dph proved sensitive to copper exposure with a 96 hr median lethal effect concentration (LC50) of 40.3 µg/L based on mortality only. However, when sublethal behavioral endpoints of loss of equilibrium and immobilization are included along with mortality the sensitivity increases with an estimated 96 hr median effect concentration (EC50) ranging from 2.4 to 5.0 µg/L. Video documentation captured these sublethal effects and further validated human observations of behavioral abnormalities recorded during the exposure. The use of digital tracking software reduced the post processing time significantly when analyzing swimming activity. Fish swimming speed, the time spent moving, and the distance travelled all significantly decreased (Figure 3) with increasing copper concentration. Swimming paths were also reduced with increasing copper concentration (Figure 4).
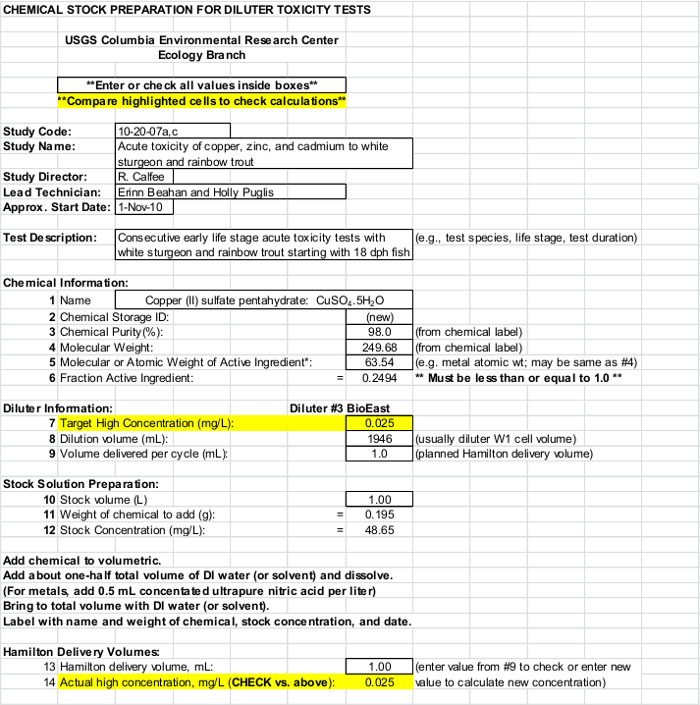 Figure 1: Computer screenshot of a spreadsheet template used to determine test stock solution concentration. Chemical stock preparation for the diluter toxicity tests was determined using a spreadsheet template based on a target concentration. Please click here to view a larger version of this figure.
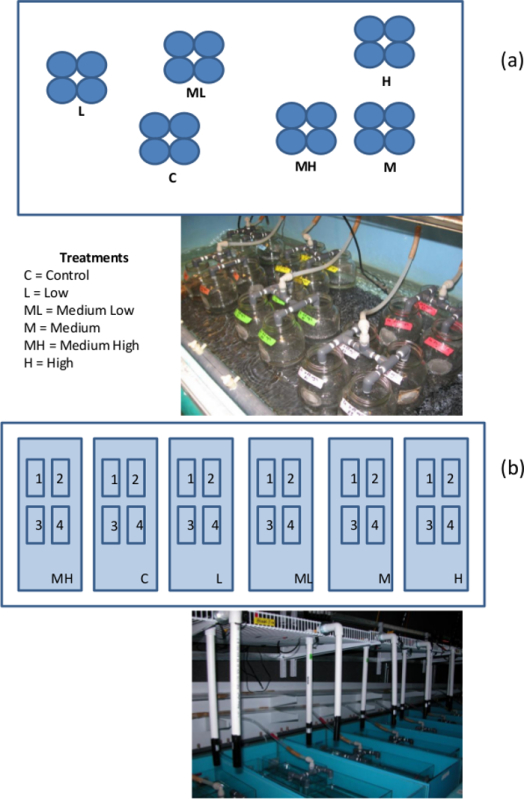 Figure 2: Diluter setup and experimental design. Various life-stages of white sturgeon were exposed to copper. The size of diluter used for the exposures was selected based on the size of the fish. (a) Early life-stage sturgeon were exposed using a small diluter setup and (b) older life-stage sturgeon were exposed using a large diluter setup.
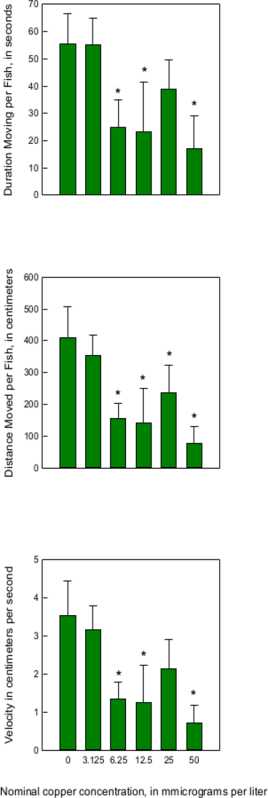 Figure 3: Swimming behavior results from an early life-stage white sturgeon (Acipenser transmontanus) 72 hr copper exposure (starting with 30 day post hatch [dph] fish). Swimming activity endpoints (a) duration of movement among 30 dph white sturgeon; (b) speed of swimming; and (c) distance moved declined with increasing copper concentration among white sturgeon exposed for 96 hr. Asterisk indicates significant difference from control, error bars represent standard deviation.
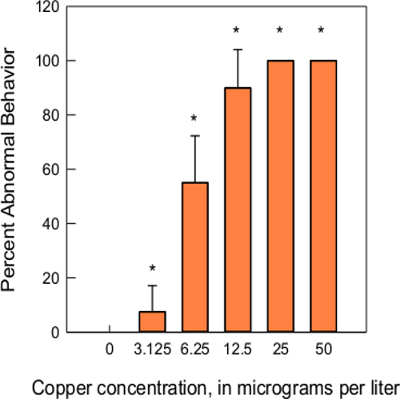 Figure 4: Results from an early life-stage white sturgeon (Acipenser transmontanus) 96 hr copper exposure (starting with 2 day post hatch [dph] fish). Surviving white sturgeon at 2 dph exhibiting loss of equilibrium and immobilization after 72 hr of a 96 hr exposure with increasing copper concentration. Asterisk indicates significant difference from control, error bars represent standard deviation.
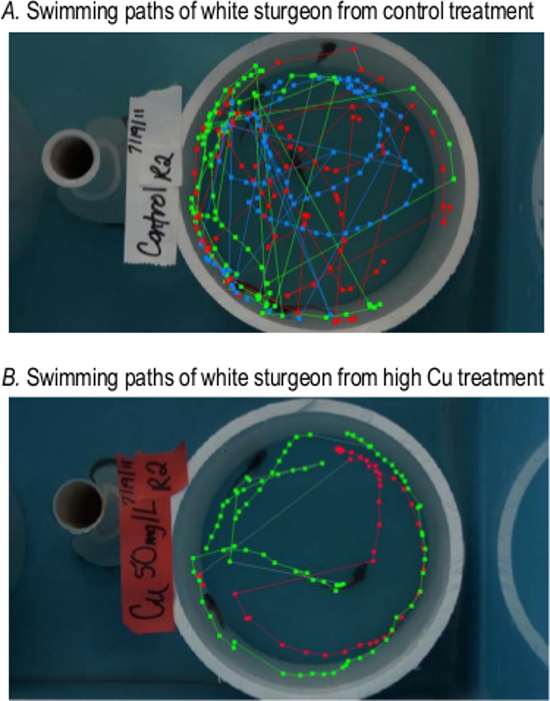 Figure 5: Example swimming path results from an early life-stage white sturgeon (Acipenser transmontanus) 96 hr copper exposure (staring with 30 day post hatch [dph] fish). Swimming paths of sturgeon digitized using digital tracking software from (a) control replicate (n = 5 fish) and (b) from a high treatment (50 µg/L) replicate (n = 3 fish) after a 96 hr exposure. Note the number of swimming paths does not represent the number of fish present in the chamber because of some fish were inactive. Please click here to view a larger version of this figure.
| Quantifiable Parameter | Observational Parameters |
| Velocity | Lethargy/Hyperactivity |
| Distance Moved | Loss of equilibrium |
| Duration of time spent in zone | Spasms/tremors/upside down |
| Zone transition-number of times organism moves between selected zones | Position in the water column |
| Heading to point-calculates the deviation of the animal’s path towards a point of interest | Respiration (fast/slow) |
| Heading calculates the heading of the selected body point | Coloration |
| Turn angle-difference in heading between two samples | Hiding |
| Angular velocity-calculated by dividing the turn angle by the sample interval | |
| Meander-calculated by dividing the turn angle by the distance moved. Used to compare turning in animals moving at different speeds | |
| Time spent moving | |
| Mobility state-calculates the duration for which the complete area detected as animal is changing, even if the center point remains the same | |
| Rotation-one rotation is completed when the selected body point has a cumulative turn angle of 360°. Turns in the opposite direction of less than the threshold are ignored. | |
| Mobility continuous-calculates the percentage of mobility for the complete area of the detected animal, even if the center point remains the same. | |
| Distance between subjects-calculates distance between all actors and the selected receivers | |
| Proximity-calculates the duration for which the actor is or is not in proximity to the receiver | |
| Relative Movement | |
| Net weighted movement-The movement of the actor to (positive) and from (negative) the receiver, weighted by the distance between them | |
| Weighted movement from-movement of the actor from the receiver, weighted by the distance between them. | |
| Weighted movement to- movement of the actor to the receiver, weighted by the distance between them | |
| Trial control state- period between two events of the Trial Control elements, or within one element | |
| Trial control event-moment in which an event within an element you have defined in Trial Control occurs. |
Table 1: Behavioral endpoints quantified through digital tracking software. These endpoints can be used on individuals or groups and also serve as a list for visual observational checks of behavioral impairment during the exposure.
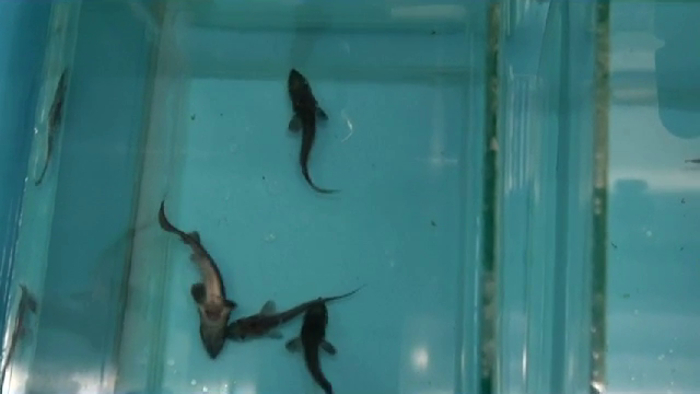 Video 1: Visual definition of abnormal behavior exhibited by affected white sturgeon. (Right click to download) A daily observational check list was used to document abnormalities. The loss of equilibrium and immobilization were the most prevalent abnormalities observed during the exposures. Modified from Calfee et al.7
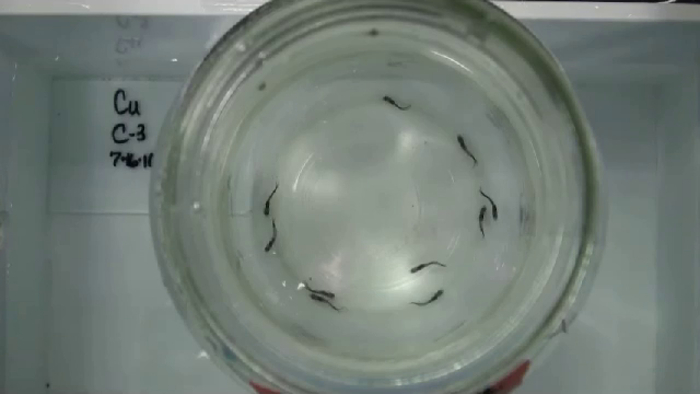 Video 2: Visual documentation highlighting an example of white sturgeon swimming behavior. (Right click to download) White sturgeon swimming activity was greatly reduced with exposure to increasing copper concentration. The sturgeon depicted in this video are from a control, medium low, and a high treatment at the end of a 96 hr aqueous copper exposure.Although the white sturgeon were still alive it is evident the fish were greatly impaired in the treatments compared to the controls. Modified from Calfee et al.7
Discussion
Changes in behavior due to exposure to a contaminant are often used as an endpoint for sub-lethal toxicity, but can be difficult to measure. Generally, behavior responses are measured by visual observations and manual data analysis which requires a lot of time to process. However with advancing technology, methods for quantifying swimming activity have focused on using videography18 and motion analysis or digital tracking software which reduces the processing and analysis time. During analysis of the video captured data, quantifying swimming variables manually would have been very time consuming so the use of video data recordings and fish tracking software provided a more effective and efficient way for analyzing sturgeon swimming behavior. Although the procedure highlighted swimming behavior of a fish, customizing for other organisms such as amphibians and aquatic invertebrates would require simple modifications. Depending on what behavioral endpoints are being addressed, experimental design and camera systems can be developed for use with just about any commercially available tracking software package.
The method is demonstrated using dissolved copper, but is applicable to other aqueous contaminants or characteristics such as temperature or oxygen content. The protocols developed and presented in this paper utilized a simple digital video camera as the recording device. The digital files are easily transferred to a computer and uploaded in to the motion analysis software. The methods are constantly being modified and refined to streamline the quantification process. It is imperative that the video quality be in high definition in order for the analysis software to identify each individual fish for tracking. Any background that does not contrast with the fish will cause problems when trying to process the data files. Another common problem with two dimensional video tracking is identifying individuals when swimming paths cross. This can be corrected manually by identifying each fish during the path crossing and linking up the path segments within the software. Alternatively, total activity can be determined from each replicate chamber as a group average. Several individual chambers with each one containing one fish can be filmed in the same field of view to calculate movements of individual fish.
Currently we have upgraded to using a series of overhead surveillance cameras above the exposure chambers that are linked to a high definition digital video recording device (HD-DVR). However, the use of any camera system that can record high definition MPEG-4 videos will work. The HD-DVR can be set to record at a specified time and programmed for up to 7 days. This hands-off automated approach allows the capture of several videos at the same time to maintain consistency while minimizing external disturbances which could compromise fish behavior. The HD-DVR systems are connected to an internal network so transferring of files is relatively simple. While the automated camera system is a much improved technique for quantifying swimming behavior, it is still beneficial to conduct visual observations to serve as additional supporting information for documenting behavioral impairment during toxicity tests.
There is a long history of literature documenting altered fish behavior resulting from exposure to metals dating back to the early 1960s19,20,21. Copper has been shown to cause changes in activity levels such as hypoactivity in bluegill22 (Lepomis macrochirus rafinesque) and changes in locomotor and feeding activity of brook trout23 (Salvelinusfontinalis). At least some juvenile fish rely on their sense of smell to detect and avoid predators, and copper-induced chemosensory deprivation may impact behaviors related to detecting alarm chemicals24,25,26. The olfactory epithelium is damaged due to copper exposure thereby affecting sensory mechanisms which could result in disorientation, behavioral avoidance, reduced feeding and any other behaviors that are guided by olfaction27. These altered behaviors were consistent with what was observed during the exposures.
The swimming behavior of white sturgeon was greatly impacted during sublethal exposure to aqueous copper concentrations.. These results illustrate how behavior is affected at sublethal concentrations of copper and can be used as an indicator of toxic stress. The video based analysis proved effective in quantifying swimming behavior and also served as qualitative visual documentation of the severe impacts on sturgeon exposed to copper. The analysis software is also capable of quantifying other various behavioral endpoints. Please refer to Table 1 for a list. The exposure system can be modified to address each endpoint in real-time mode and can be used to quantify differences in behavior associated with exposure to various contaminants of concern.
The use of behavioral endpoints in aquatic toxicological research is increasingly employed and should be considered when evaluating the effects of contaminants because adaptive behavioral function is crucial in the determination of environmental injury9. The impacts of environmental contaminants to fish behavior is often subjective and challenging particularly when dealing with sublethal endpoints in the absence of standard methods..
Swimming activity as quantified by using these methods can be rigorously monitored, is non-destructive with minimal stress to the organism and can be repeated. Swimming behavior is a valid and consistent index of sublethal toxicity that should be incorporated in test protocols to expand the sensitivity of standard toxicity tests5.
Disclosures
Any use of trade, firm, or product names is for descriptive purposes only and does not imply endorsement by the U.S. Government.
Acknowledgments
We thank the staff in the Ecology Branch, Toxicology Branch and Environmental Chemistry Branch of the U.S. Geological Survey, Columbia Environmental Research Center for technical and analytical assistance. Funding provided in part by Teck American Incorporated through an agreement with the US Environmental Protection Agency (USEPA) Region 10 with funds provided by USEPA to US Geological Survey (USGS) through the Department of Interior Central Hazmat Fund.
References
- Gerhardt A. Aquatic behavioral ecotoxicology-prospects and limitations. Hum Ecol Risk Assess: An International Journal. 2007;13(3):481–491. [Google Scholar]
- Beitinger TL. Behavioral reactions for the assessment of stress in fishes. J Great Lakes Res. 1990;16:495–528. [Google Scholar]
- Beitinger TL, McCauley RW. Whole-animal and physiological processes for the assessment of stress in fishes. J Great Lakes Res. 1990;16:542–575. [Google Scholar]
- Dell'Omo G, editor. Behavioural Ecotoxicology. Chichester, UK: J Wiley & Sons; 2002. [Google Scholar]
- Little EE, Finger SE. Swimming behavior as an indicator of sublethal toxicity in fish. Environ Toxicol Chem. 1990;9:13–19. [Google Scholar]
- Rand GM. Behavior. In: Rand GM, Petrocelli SR, editors. Fundamentals of Aquatic Toxicology: Methods and Applications. New York: Hemisphere Publishing; 1985. pp. 221–256. [Google Scholar]
- Calfee RD, et al. Acute sensitivity of white sturgeon (Acipenser transmontanus) and rainbow trout (Onchorhynchus mykiss) to copper, cadmium, or zinc in water-only laboratory exposures. Environ Toxicol Chem. 2014;33(10):2259–2272. doi: 10.1002/etc.2684. [DOI] [PMC free article] [PubMed] [Google Scholar]
- Little EE, Calfee RD, Linder G. Toxicity of smelter slag-contaminated sediments from Upper Lake Roosevelt and associated metals to early life stage White Sturgeon (Acipenser transmontanus Richardson, 1836) J Appl Ichthyol. 2014. pp. 1–11.
- Wang N, et al. Chronic sensitivity of white sturgeon (Acipenser transmontanus) and rainbow trout (Onchorhynchus mykiss) to cadmium, copper, lead or zinc in water-only laboratory exposures. Environ Toxicol Chem. 2014;33(10):2246–2258. doi: 10.1002/etc.2641. [DOI] [PubMed] [Google Scholar]
- Little EE. Behavioral measures of injuries to fish and aquatic organisms: regulatory considerations. In: Dell'Omo G, editor. Behavioural Ecotoxicology. Chichester, UK: J Wiley & Sons; 2002. pp. 411–431. [Google Scholar]
- Little EE, Brewer SK. Neurobehavioral toxicity in fish. In: Schlenk D, Benson WH, editors. Target Organ Toxicity in Marine and Freshwater Teleosts New Perspectives: Toxicology and the Environment. Volume 2. London and New York: Taylor and Francis; 2001. pp. 139–174. [Google Scholar]
- Mount DI, Brungs WA. A simplified dosing apparatus for fish toxicological studies. Water Res. 1967;1:21–29. [Google Scholar]
- Annual.Book of ASTM International Standards. Volume 11.06. West Conshohocken, PA: ASTM International; 2013. Standard guide for performing early life-stage toxicity tests with fishes; pp. 1241–1305. SOURCE: http://www.astm.org/Standards/E1241.htm (2014a) [Google Scholar]
- Annual.Book of ASTM Standards. Volume 11.06. West Conshohocken, PA: ASTM International; 2014. Standard guide for measurement of behavior during fish toxicity tests; p. 1711. SOURCE: http://www.astm.org/Standards/E1711.htm (2014b) [Google Scholar]
- Annual.Book of ASTM Standards. Volume 11.06. West Conshohocken, PA: ASTM International; 2014. Standard guide for conducting acute toxicity tests on test materials with fishes, macroinvertebrates, and amphibians; pp. 729–796. SOURCE: http://www.astm.org/Standards/E729.htm (2014c) [Google Scholar]
- Brunson , et al. Assessing bioaccumulation of contaminants from sediments from the upper Mississippi River using field-collected oligochaetes and laboratory-exposed Lumbriculus variegatus. Arch Environ ConTox. 1998;5:191–201. doi: 10.1007/s002449900367. [DOI] [PubMed] [Google Scholar]
- Brumbaugh WG, May TW, Besser JM, Allert AL, Schmitt CJ. Assessment of elemental concentrations in streams of the New Lead Belt in southeastern Missouri, 2002-05. U.S. Geological Survey Scientific Investigations Report 2007-5057. 2007.
- Kane AS, Salierno JD, Gipson GT, Molteno TCA, Hunter C. A video-based movement analysis system to quantify behavioral stress responses of fish. Water Res. 2004;38:3993–4001. doi: 10.1016/j.watres.2004.06.028. [DOI] [PubMed] [Google Scholar]
- Sprague JB. Avoidance of Copper-Zinc Solutions by Young Salmon in the Laboratory. JWater Pollut Control Fed. 1964;36(8):990–1004. [Google Scholar]
- Saunders RL, Sprague JB. Effects of copper-zinc mining pollution on a spawning migration of Atlantic salmon. Water Res. 1967;1(6):419–432. [Google Scholar]
- Barron MG. Environmental contaminants altering behavior. In: Dell'Omo G, editor. Behavioural Ecotoxicology. Chichester, UK: Wiley & Sons; 2002. pp. 167–186. [Google Scholar]
- Ellgaard EG, Guillot JL. Kinetic analysis of the swimming behavior of bluegill sunfish, Lepomis macrochirus rafinesque, exposed to copper: hypoactivity induced by sublethal concentrations. J Fish Biol. 1998;33:601–608. [Google Scholar]
- Drummond RA, Spoor WA, Olson GG. Some short-term indicators of sublethal effects of copper on brook trout, Salvelinus fontinalis. J Fish Res Board Can. 1973;30:698–701. [Google Scholar]
- Hansen JA, Rose JD, Jenkins RA, Gerow KG, Bergman HL. Chinook salmon (Oncorhynchus tshawytscha) and rainbow trout (Oncorhynchus mykiss) exposed to copper: neurophysiological and histological effects on the olfactory system. Environl Toxicol Chem. 1999;18:1979–1991. [Google Scholar]
- Sandahl JF, Baldwin DH, Jenkins JJ, Scholz NL. A sensory system at the interface between urban stormwater runoff and salmon survival. Environ Sci Technol. 2007;41(8):2998–3004. doi: 10.1021/es062287r. [DOI] [PubMed] [Google Scholar]
- McIntyre JK, Baldwin DH, Beauchamp DA, Scholz NL. Low-level copper exposures increase visibility and vulnerability of juvenile coho salmon to cutthroat trout predators. Ecol Appl. 2012;22(5):1460–1471. doi: 10.1890/11-2001.1. [DOI] [PubMed] [Google Scholar]
- Green WW, Mirza RS, Wood CM, Pyle GG. Copper binding dynamics and olfactory impairment in fathead minnows (Pimephales promelas) Environ Sci Technol. 2010;44(4):1431–1437. doi: 10.1021/es9023892. [DOI] [PubMed] [Google Scholar]


