

Abstract
Brain parenchymal lesions are frequently observed on conventional magnetic resonance imaging (MRI) scans of patients with neuromyelitis optica (NMO) spectrum disorder, but the specific morphological and temporal patterns distinguishing them unequivocally from lesions caused by other disorders have not been identified. This literature review summarizes the literature on advanced quantitative imaging measures reported for patients with NMO spectrum disorder, including proton MR spectroscopy, diffusion tensor imaging, magnetization transfer imaging, quantitative MR volumetry, and ultrahigh-field strength MRI. It was undertaken to consider the advanced MRI techniques used for patients with NMO by different specialists in the field. Although quantitative measures such as proton MR spectroscopy or magnetization transfer imaging have not reproducibly revealed diffuse brain injury, preliminary data from diffusion-weighted imaging and brain tissue volumetry indicate greater white matter than gray matter degradation. These findings could be confirmed by ultrahigh-field MRI. The use of nonconventional MRI techniques may further our understanding of the pathogenic processes in NMO spectrum disorders and may help us identify the distinct radiographic features corresponding to specific phenotypic manifestations of this disease.
Over the past decade, new clinical definitions and diagnostic criteria, facilitated by a specific biomarker, aquaporin-4 (AQP4)–reactive autoantibodies (AQP4-IgG), led to the recognition that there is a broader clinical spectrum of syndromes reasonably classified as being related to neuromyelitis optica (NMO); these are now referred to as NMO spectrum disorders. Serum IgG1 antibodies against the water channel AQP4 are highly specific for NMO spectrum disorders, the clinical features of which include inflammation of the optic nerve, spinal cord, and specific brain areas, which frequently are sites of high AQP4 expression.1–5 Magnetic resonance imaging (MRI) represents the most important nonserological paraclinical parameter to facilitate the diagnosis of NMO spectrum disorder. During the acute disease phase, MRI of the affected optic nerve and spinal cord may reveal swelling and contrast enhancement caused by blood-brain barrier breakdown. These features are hypothesized to be triggered by damage to astrocytic end-feet at the glia limitans of the blood-brain barrier.
The spinal cord lesions in patients with multiple sclerosis (MS) usually span less than 1 vertebral segment and are commonly peripherally located within the white matter (WM) of the cervical spinal cord. By comparison, the spinal cord lesions in patients with NMO spectrum disorder are typically centrally located in the cross section, extend longitudinally over 3 or more contiguous vertebral segments, and occasionally span most of the length of the spinal cord.6 Cerebral lesions in patients with NMO spectrum disorder detected by use of conventional MRI are most commonly clinically silent and nonspecific in appearance; however, lesions of the diencephalon, periaqueductal region, and brainstem are more specific for NMO. The clinical features of hypersomnolence, anorexia, amenorrhea, or intractable hiccups prompt consideration of NMO. Hence, a more comprehensive description of brain parenchymal abnormalities is needed for NMO spectrum disorder and may provide enhanced metrics for distinguishing NMO spectrum disorder from other WM disorders.
Multiple studies7–15 have focused on spinal cord and brain MRI findings regarding NMO spectrum disorders using conventional MRI techniques. During the last decade, several groups have evaluated the use of nonconventional brain and spinal cord MRI techniques, including ultrahigh-field strength MRI, proton MR spectroscopy (1H-MRS), diffusion and diffusion tensor imaging, magnetization transfer imaging (MTI), and functional MRI (fMRI).16,17 Although all of these techniques are currently applied in neurological diseases such as MS, they are still exclusive to research and not widely used in daily clinical practice. Nevertheless, these advanced MRI techniques may help distinguish NMO spectrum disorders from MS and elucidate the pathophysiology of NMO spectrum disorders. Herein, we review the current status of advanced MRI techniques for patients with NMO spectrum disorder.
Exploration of Normal-Appearing WM and Normal-Appearing Gray Matter
Proton MR Spectroscopy
Metabolic parameters quantified by use of 1H-MRS (eg, ratios of N-acetylaspartate to creatine and choline to creatine, and absolute concentrations of the metabolites) have been reported to be unaltered in the normal-appearing cerebral WM and normal-appearing cerebral gray matter (GM) of patients with NMO spectrum disorder compared with patients with MS.18–20 However, a recent case study of NMO spectrum disorders by Ciccarelli et al21 demonstrated lower myo-inositol levels normalized to creatine levels in the lesional cervical spinal cords of patients with NMO spectrum disorder in comparison with patients with MS and matched healthy controls. Myo-inositol is a molecule located in astrocytes; low levels of myo-inositol estimated by use of 1H-MRS are therefore believed to indicate astrocytic damage.21 Ciccarelli et al21 hypothesize that this lesional pathology is distinctive among patients with MS. Nevertheless, this finding needs confirmation by a larger study and preferably also additional data on brain lesions. So far, there is insufficient evidence that 1H-MRS is specifically sensitive to NMO spectrum disorder–related brain parenchymal alterations and may thus facilitate the distinction of these alterations from MS.
Diffusion Tensor Imaging
Diffusion tensor imaging indirectly characterizes the tissue’s integrity and structure in vivo by probing the microscopic diffusion of water molecules in the tissue (Figure 1).22 The 2 most commonly quoted coefficients are the mean diffusivity and the fractional anisotropy. The mean diffusivity measures the average diffusivity of water molecules. It is therefore affected by the cell size and tissue integrity. Fractional anisotropy measures the degree of directional anisotropy of the diffusion process and is useful for assessing the structural integrity of WM and the degree of structural alignment within fiber tracts. Studies of animal models have shown that 2 other coefficients, parallel diffusivity and perpendicular diffusivity, provide additional information on WM structures that is more specific to underlying histological processes than fractional anisotropy or mean diffusivity.23 Parallel diffusivity may reflect diffusivity along the axon (ie, axonal integrity), whereas perpendicular diffusivity represents diffusivity perpendicular to the axon (ie, myelination).
Figure 1. Diffusion Tensor Imaging.

A, Fiber bundles are composed of axons with myelinated sheaths. B, The corresponding diffusion tensor is modeled by an ellipsoid. Parallel diffusivity (Dpar) corresponds to the diffusivity in the main direction of the fiber bundle (reflecting axonal integrity), and perpendicular diffusivity (Dper) is related to the diffusivity orthogonal to this direction (reflecting the myelination).
In the brain and spinal cord tissues of patients with NMO spectrum disorder, both a decrease24 and an increase in mean diffusivity and perpendicular diffusivity have been reported in different studies. Furthermore, a heightened variance of parallel diffusivity and a decrease in fractional anisotropy were stated in a comparison with healthy controls,25,26 potentially reflecting both axonal and myelin damage.24,25,27–31 The normal-appearing WM abnormalities described thus far seem to predominate in optic radiations and corticospinal tracts (spinal cord and posterior limb of the internal capsule),27 although more widespread normal-appearing WM abnormalities in the brain and spinal cord were also detected by use of diffusion tensor imaging.25,26,28 Confirmation from larger studies will be necessary. Normal-appearing GM abnormalities have been observed in the thalamus and putamen.31 Normal-appearing WM and GM abnormalities may be the consequence of both Wallerian degeneration and focal demyelination in the brain. With regard to spinal cord lesions, higher radial diffusivity within spinal cord tracts was present in patients with NMO spectrum disorder compared with patients with MS, which is consistent with the more pronounced tissue destruction observed in patients with NMO spectrum disorder.24 An association between WM diffusion changes and clinical parameters (the Expanded Disability Status Scale and disease duration) has been reported for patients with NMO spectrum disorder.25,32
In summary, radiological and pathological correlation studies are needed to clarify the precise relationship between the alterations within diffusion tensor imaging–derived measures and the underlying histopathological processes. Although not yet established in routine clinical application, diffusion tensor imaging may have the potential to serve as an imaging surrogate marker in emerging NMO clinical trials (as a secondary or exploratory end point).
Magnetization Transfer Imaging
Magnetization transfer imaging applies an additional off-resonance pulse to saturate protons associated with macromolecules. Saturated protons may enter the pool of free (water) protons and transfer their magnetization, causing a signal decrease in macromolecule-rich areas such as the brain parenchyma. By comparison, the signal of more fluid components is preserved. Thus, MTI may reveal tissue damage due to demyelination.
Two of 3 small studies using MTI to evaluate patients with NMO spectrum disorder have observed no differences between affected individuals and healthy controls.17,33 However, Rocca et al34 found lower magnetization transfer ratio histogram–derived metrics for patients with NMO compared with healthy controls, and the changes were exclusive to normal-appearing GM and correlated with increased mean diffusivity. Unfortunately, this study34 was conducted prior to the availability of AQP4 antibody testing. Consequently, diagnostic misclassification may have biased the results. In summary, owing to the very limited number of studies and patients included, a conclusive answer to the value of MTI for patients with NMO spectrum disorder remains open and requires larger prospective studies.
Volumetric Evaluation
For patients with MS, MRI-detected abnormalities are typically accompanied by decreased brain volume of the WM and GM.35 This atrophy correlates with the level of physical disability and cognitive impairment.35 Several studies36–39 have investigated changes in the WM and/or GM volume in patients with NMO. Analyses of global volumetric atrophy demonstrated a markedly decreased WM volume in patients with NMO spectrum disorder compared with healthy participants.36,37 Blanc et al36 demonstrated correlations between WM focal atrophy and cognitive impairment in 28 patients with NMO. Focal WM atrophy included the optic chiasm, pons, cerebellum, corpus callosum, and parts of the frontal, temporal and parietal lobes, including the superior longitudinal fasciculus.
In another study,38 the Expanded Disability Status Scale and disease duration were not significantly correlated with brain volume for 30 patients with NMO. Although global GM atrophy has not been described for patients with NMO spectrum disorder, focal thalamic and prefrontal GM atrophy was identified in this small study38 of patients with NMO, although it was less severe than in patients with MS.37,39 Moreover, the anatomical regional distribution of the described focal GM and/or WM atrophy seems to differ between patients with NMO spectrum disorder and patients with MS.39 This finding is consistent with the study by Saji et al,40 who showed that cognitive decline can develop early in patients with NMO spectrum disorder.
In aggregate, the data suggest the presence of diffuse WM and focal GM atrophy in patients with NMO spectrum disorder, even in those patients without cerebral T2-weighted hyperintense lesions. Although technically feasible, atrophy measurements have not become part of the clinical practice for patients with MS or NMO. As with MS, for which numerous clinical trials with new therapeutic compounds have applied atrophy measurements mostly as secondary or exploratory end points, the effect of new NMO therapies on brain atrophy could be assessed in upcoming clinical trials.
Functional MRI
Functional MRI is a neuroimaging procedure that measures neural activity based on changes in deoxyhemoglobin levels (blood oxygen level–dependent [BOLD] signal). Two general approaches are used: (1) activation fMRI, which measures the deoxyhemoglobin signal modification during specified tasks, and (2) resting-state fMRI, which correlates the synchrony of low-frequency fluctuations of the BOLD signal in various regions while the brain is at rest (Figure 2). The latter technique can be used to determine the functional connectivity of neural networks.41 While both fMRI techniques have been applied to patients with MS,42,43 there has been only one study44 to date on the use of activation fMRI for patients with NMO spectrum disorder. The study44 showed an abnormal pattern of movement-associated cortical activation in patients with NMO spectrum disorder (similar to that in patients with MS) that extended beyond the “classical” sensorimotor network and involved visual areas devoted to motion processing. The correlation between fMRI changes and the extent of spinal cord damage suggests that such functional cortical changes might play an adaptive role in limiting the clinical outcome of the pathology of NMO spectrum disorder.43
Figure 2. Resting-State Functional Magnetic Resonance Imaging.

A, Axial (left) and sagittal (right) views of the brain functional network. Nodes are located toward the coordinates of the regional centroids of the automated anatomical labeling template. Short-distance connections corresponding to the red edges are predominantly in the posterior cortex, whereas the long-distance connections shown in blue are between the frontal cortex and the regions of the parietal and temporal association cortex. B, Expanded Disability Status Scale (EDSS) as a function of the hub disruption index. A hub disruption index of 0 corresponds to a normal network. The farther the index deviates from 0, the more significant the reorganization of the network (in terms of topology). A correlation score highlights the fact that the reorganization of the brain network is a marker of the severity of the disease. The solid line represents the linear regression fit across all participants.
In patients with NMO spectrum disorder, the regions of functional impairment and adaptation have been described by resting-state fMRI studies despite the otherwise preserved global brain integrity.42,44 Liu et al42 showed that patients with NMO spectrum disorder had a reduced amplitude of low-frequency fluctuation in the precuneus, posterior cingulate cortex, and lingual gyrus and increased amplitude of low-frequency fluctuation in the middle frontal gyrus, caudate nucleus, and thalamus compared with normal controls. Moreover, a moderate negative correlation was observed between the Expanded Disability Status Scale and the amplitude of low-frequency fluctuation in the left middle frontal gyrus.42
From resting-state fMRI data, it is possible to model large-scale human brain networks of regional cortical and subcortical nodes with models such as the graph theory.45 Hemmert et al46 hypothesized that global network properties were conserved in patients with NMO but that regional networks were reorganized. This reorganization could be a marker of disease severity because the authors found a reasonable correlation between disability and the hub disruption index.46 These results indicate that functional connectivity is modified in patients with NMO spectrum disorder and that resting-state graph analysis may highlight brain plasticity associated with network reorganization. Besides fair evidence of alterations in brain functional networks, further longitudinal studies are needed to determine the role of fMRI in NMO spectrum disorders.
Ultrahigh-Field and High-Field MRI
Striking advances in in vivo brain lesion imaging have been made by the application of ultrahigh-field strength MRI. The use of 7-T MRI enables an unprecedented view of brain structures and pathology on a submillimeter scale owing to a high signal to noise ratio.46 White matter lesions are present in nearly 70% of patients with NMO spectrum disorder who have a longstanding disease. The pattern of lesion distribution may conform to brain regions known to have high AQP4 expression, but in many patients, the lesion pattern remains nonspecific.47 In MS, no target antigen has been identified, so the distribution of the lesions relative to the target antigen cannot be addressed. Brain lesions in patients with MS are characteristically located in perivenular regions, whereas this is not the case in patients with NMO spectrum disorder (Figure 3); this observation may be helpful in differentiating NMO- from MS brain lesions.48,49
Figure 3. Optic Radiations.
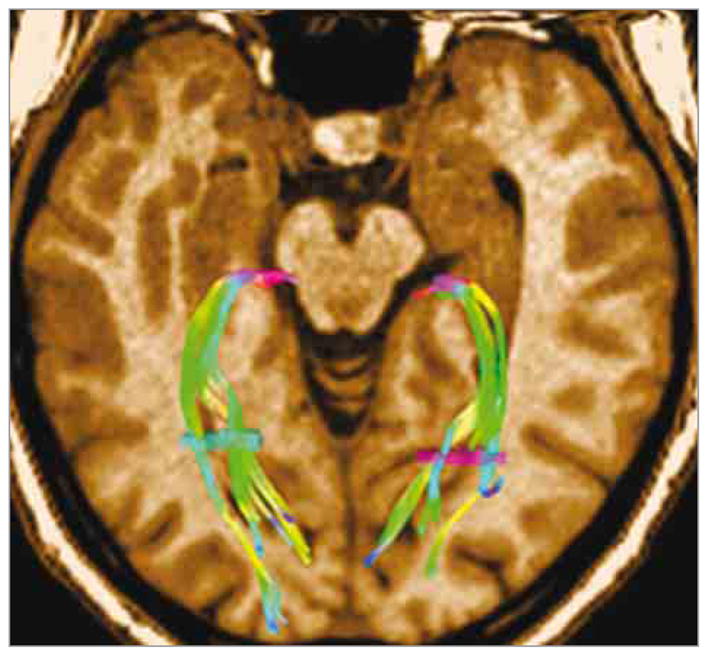
Optic radiation tractography was performed using a diffusion tensor imaging/magnetic resonance imaging (MRI) scan (Siemens Avanto 1.5-T MRI scanner, with 30 directions). Two seed points (the brightly colored fiber bundles) have been defined, the first one in the lateral geniculate body and the second one in the white matter at the posterior part of the occipital horn of the lateral ventricle. The fiber bundles are color coded according to their directions of impulse transmission.
In one 7-T MRI study of NMO spectrum disorders,50 the veins coursing through the lesions were rare, and the central intralesional veins were absent (with only few exceptions). Furthermore, a hypointense rim surrounding WM lesions, hypothesized to represent iron-loaded macrophages and activated microglia, was a common finding in patients with MS, but it was not detectable in patients with NMO spectrum disorder (Figure 4).47 The majority of lesions (>85%) in patients with NMO spectrum disorder were subcortical,46 and no periventricular lesions or “Dawson’s fingers,” a characteristic feature of MS,51 were observed.52 Interestingly, none of these studies described the macroscopic cortical pathology of NMO spectrum disorders,53 despite the description of microscopic meningeal inflammation, cortical demyelination, and neuronal loss in histological analyses.54,55
Figure 4. Magnetic Resonance Imaging Scans of Neuromyelitis Optica (NMO) and Multiple Sclerosis (MS) Lesions at 7 T.

Multiple sclerosis lesions are characteristically centered on a small vein in T2*-weighted sequences (blue arrowheads pointing to lesion surface and yellow arrowheads pointing to central intralesional vein) (A), a finding not present in 7-T magnetic resonance imaging scans of patients with NMO spectrum disorder who have brain parenchymal lesions (blue arrowheads) (B).
No evidence of a specific cortical pathology or of a specific morphology or distribution of brain parenchymal lesions could be found using ultrahigh-field MRI. Nevertheless, the characterization of near-microscopic lesions facilitates distinguishing NMO spectrum disorders from MS.
Conclusions
In contrast to studies of MS using advanced MRI techniques, studies of NMO spectrum disorders are still scarce, with often a limited number of patients included (Table 1). Moreover, previous cohorts were highly heterogeneous with respect to the proportion of AQP4 antibody–seropositive and –seronegative patients, which precludes definite conclusions on distinct imaging features in these 2 subgroups. A variety of advanced MRI measures are discussed with regard to their capacity to detect nonovert tissue damage and to facilitate the distinction of NMO spectrum disorders from MS (Table 2). Although quantitative measures such as 1H-MRS or MTI have not reproducibly revealed diffuse brain injury, diffusion-weighted imaging and brain tissue volumetry indicate more WM injury than GM injury. These findings were confirmed by use of ultrahigh-field MRI. With highly resolving 7-T MRI, nonspecific cerebral WM lesions were detectable, but GM pathology was absent.
Table 1.
Survey of NMOSD Studies That Used Advanced MRI Techniquesa
| Study, Year | Patients With NMSOD | Healthy Controls, No. | |
|---|---|---|---|
| Total No. | No. Tested for AQP4-IgG | ||
| Pichiecchio et al,17 2012 | 8 | 6b | 7 |
| Aboul-Enein et al,18 2010 | 8 | 8 | 8 |
| Bichuetti et al,19 2008 | 16 | NA | 16 |
| de Seze et al,20 2010 | 24 | 17 | 12 |
| Ciccarelli et l,21 2013 | 5 | 5 | 11 |
| Klawiter et al,24 2012 | 10 | 7 | 10 |
| Liu et al,25 2012 | 27 | NA | 27 |
| Rueda Lopes et al,26 2012 | 17 | NA | 17 |
| Jeantroux et al,27 2012 | 20 | NA | 25 |
| Liu et al,28 2012 | 26 | 18c | 26 |
| Yu et al,29 2008 | 19 | NA | 19 |
| Yu et al,30 2006 | 16 | NA | 16 |
| Zhao et al,31 2012 | 24 | NA | 24 |
| Qian et al,32 2011 | 10 | NA | 12 |
| Filippi et al,33 1999 | 8 | NA | 9 |
| Rocca et al,34 2004 | 10 | NA | 15 |
| Blanc et al,36 2012 | 28 | 18 | 28 |
| Chanson et al,37 2013 | 30 | 17 | 30 |
| Duan et al,38 2013 | 20 | NA | 20 |
| Duan et al,39 2012 | 26 | NA | 26 |
| Saji et al,40 2013 | 14 | 14 | 37 |
| Liu et al,42 2011 | 17 | NA | 17 |
| Liang et al,45 2011 | 17 | NA | 17 |
| Hemmert et al,46 2013 | 12 | NA | 20 |
| Kister et al,47 2013 | 10 | 10 | 0 |
| Sinnecker et al,48 2012 | 10 | 9 | 0 |
| Matthews et al,52 2013 | 44 | 44 | 0 |
Abbreviations: AQP4, aquaporin 4; MRI, magnetic resonance imaging; NA, not available; NMOSD, neuromyelitis optica spectrum disorder.
To our knowledge, no longitudinal studies on the use of advanced MRI techniques for patients with NMSOD have been published.
Four patients tested positive.
Sixteen patients tested positive.
Table 2.
Summary of a Variety of Advanced MRI Measures
| Technique | Exemplary Marker | Interpretation | Use for Distinguishing NMOSD From MS |
|---|---|---|---|
| Proton MR spectroscopy | NAA, MI | Marker molecules for neurons (NAA) or astrocytes (MI) are often expressed as ratios to creatine or choline. | Poor |
| Diffusion tensor imaging | MD, FA | Indirectly characterizes tissue integrity and structure. Can be used to reconstruct CNS fiber tracts. | Potentially relevant, confirmation studies needed |
| Magnetization transfer imaging | Magnetization transfer ratio | Applies additional off-resonance pulse to saturate protons associated with macromolecules. May reveal demyelination and remyelination. | Poor |
| Brain volumetry | Brain parenchymal fraction | Brain volumetry is an established marker for neurodegenerative processes. Various techniques are applied. | Potentially relevant, confirmation studies needed |
| Functional MRI | BOLD signal | Assesses focal brain activity by changes in oxygen consumption and local blood perfusion during tasks or at resting state. | Poor |
| Ultrahigh-field MRI | Morphological imaging | Ultrahigh-field MRI enables near-microscopic resolution in vivo, as well as increased sensitivity to T2* contrast. | Good, characteristics of MS-specific lesion not present in NMOSD |
Abbreviations: BOLD, blood oxygen level–dependent; CNS, central nervous system; FA, fractional anisotropy; MD, mean diffusivity; MI, myo-inositol; MRI, magnetic resonance imaging; MS, multiple sclerosis; NAA, N-acetylaspartate; NMOSD, neuromyelitis optica spectrum disorder.
The discrepancy between the macroscopic GM findings on ultrahigh-field MRI scans and the microscopic pathology found in patients with NMO spectrum disorder suggests that some fMRI changes may result from an occult microscopic brain pathology. The disease specificity of these changes, however, is not yet clear. Future longitudinal studies using age-matched and disease-matched controls are warranted to elucidate the specificity of the cerebral MRI findings regarding NMO spectrum disorders. However, because these types of studies have not yet been conducted, patients with definite or suspected NMO should not be routinely subjected to advanced imaging techniques outside observational studies; instead, in unclear cases of central nervous system demyelination, testing for AQP4 antibodies in highly sensitive and specific assays and conventional MR imaging of the brain and the entire spinal cord should be initiated to help establish or rule out a diagnosis of NMO spectrum disorder.56 Future observational trials should strive for more homogeneous patient cohorts in order to investigate possible differences in imaging features between seropositive and seronegative patients. Emerging interventional trials of NMO with strict inclusion and exclusion criteria could provide an excellent opportunity to enhance our understanding of the association between disease pathology and advanced imaging findings.
The GJCF NMO International Clinical Consortium and Biorepository
include Philippe Cabre, MD, PhD; Romain Marignier, MD, PhD; Thomas Tedder, PhD; Danielle van Pelt, MD; Simon Broadley, MD, PhD; Tanuja Chitnis, MD; Dean Wingerchuk, MD; Lekha Pandit, MD, PhD; Maria Isabel Leite, MD, PhD; Metha Apiwattanakul, MD; Ingo Kleiter, MD; Naraporn Prayoonwiwat, MD; May Han; Kerstin Hellwig, MD; Katja van Herle, MD; Gareth John, VetMB, PhD; D. Craig Hooper, PhD; Ichiro Nakashima, MD, PhD; Douglas Sato, MD, PhD; Michael R. Yeaman, PhD; Emmanuelle Waubant, MD, PhD; Scott Zamvil, MD, PhD; Olaf Stüve, MD, PhD; Orhan Aktas, MD; Terry J. Smith, MD; Anu Jacob, MD; Kevin O’Connor, PhD.
Affiliations of The GJCF NMO International Clinical Consortium and Biorepository
Department of Neurology, Oxford University Hospital Trust, Oxford, England (Leite); Department of Neurology, Massachusetts General Hospital, Harvard Medical School, Boston (Chitnis); Department of Neurology and Neurotherapeutics, University of Texas Southwestern Medical Center, Dallas (Stüve); Department of Pediatrics, University of Texas Southwestern Medical Center, Dallas (Stüve); Department of Multiple Sclerosis Therapeutics, Tohoku University Graduate School of Medicine, Sendai, Japan (Nakashima, Sato); CHU de Fort de France, Martinique (Cabre); CHU, Lyon, France (Marignier); Duke University School of Medicine, Durham, North Carolina (Tedder); Erasmus MC, Rotterdam, the Netherlands (van Pelt); Griffith University, Southport, Queensland, Australia (Broadley); Mayo Clinic, Scottsdale, Arizona (Wingerchuk); Nitte University, Mangalore, Karnataka, India (Pandit); Prasat Neurological Institute, Bangkok, Thailand (Apiwattanakul); Ruhr University, Bochum, Germany (Kleiter); Siriraj Hospital, Mahidol University, Bangkok, Thailand (Prayoonwiwat); Stanford University School of Medicine, Palo Alto, California (Han); St Josef Hospital, Bochum, Germany (Hellwig); The GJCF, San Diego, California (van Herle); Mount Sinai Hospital, New York, New York (John); Thomas Jefferson University, Philadelphia, Pennsylvania (Hooper); University of California, Los Angeles (Yeaman); University of California, San Francisco (Waubant, Zamvil); University of Düsseldorf, Düsseldorf, Germany (Aktas); University of Michigan, Ann Arbor (Smith); Walton Center, Liverpool, England (Jacob); Yale University School of Medicine, New Haven, Connecticut (O’Connor).
Author Contributions
Dr Wuerfel had full access to all of the data in the study and takes responsibility for the integrity of the data and the accuracy of the data analysis. As senior authors, Drs de Seze and Wuerfel contributed equally to the work.
Study concept and design: Kremer, Achard, Palace, Klawiter, Villoslada, Saiz, Schippling, Paul, Kim, de Seze, Wuerfel, Cabre, van Pelt, Broadley, Pandit, Apiwattanakul, Prayoonwiwat, Han, van Herle, John, Stüve, Smith.
Acquisition, analysis, or interpretation of data: Kremer, Renard, Lana-Peixoto, Palace, Asgari, Tenembaum, Banwell, Greenberg, Bennett, Levy, Fujihara, Chan, Wuerfel, Marignier, Tedder, Chitnis, Wingerchuk, Leite, Kleiter, Hellwig, Hooper, Nakashima, Sato, Yeaman, Waubant, Zamvil, Aktas, Jacob, O’Connor.
Drafting of the manuscript: Kremer, Lana-Peixoto, Paul, de Seze, Wuerfel.
Critical revision of the manuscript for important intellectual content: All authors.
Statistical analysis: Renard, Achard.
Administrative, technical, or material support: Kremer, Lana-Peixoto, Palace, Greenberg, Levy, Chan, Paul, Broadley, Yeaman, Stüve.
Study supervision: Villoslada, Saiz, Schippling, Paul, de Seze, Wuerfel, Pandit, van Herle, Waubant, Smith, Jacob.
Conflict of Interest Disclosures
Dr Kim has given talks, consulted, and received honoraria and/or research support from Bayer Schering Pharma, Biogen Idec, Genzyme, Kael-GemVax, Merck Serono, Novartis, Teva-Handok, and UCB. He serves on a steering committee for MedImmune. Dr Paul has received funding from the German Research Council, the German Ministry of Education and Research (Competence Network Multiple Sclerosis [KKNMS]), and the GJCF. He has received travel compensation, speaker honoraria, and research support from Biogen Idec, Bayer, Teva, Merck, Novartis, and Sanofi and has served as a steering committee member of the OCTIMS study sponsored by Novartis. Dr Tenembaum has provided consulting services to Genzyme Corp and Biogen Idec and has received lecture fees from Merck Serono. Dr Palace is partly funded by highly specialized services to run a national congenital myasthenia service and a neuromyelitis service. She has received support for scientific meetings and honoraria for advisory work from Merck Serono, Biogen Idec, Novartis, Teva, Chugai Pharma, and Bayer Schering and unrestricted grants from Merck Serono, Novartis, Biogen Idec, and Bayer Schering. Her hospital trust receives funds for her role as clinical leader for the RSS, and she has received grants from the National MS Society and the GJCF for unrelated research studies. Dr Klawiter has received research funding from Roche. He has received consulting fees and/or speaking honoraria from Biogen Idec, Bayer Healthcare, Genzyme Corp, and Teva Neuroscience. Dr Sato receives a scholarship from the Ministry of Education, Culture, Sports, Science and Technology in Japan and has received research support from the Ichiro Kanehara Foundation. Dr de Seze has received honoraria from Bayer Schering, Biogen Idec, LFB, Merck Serono, Novartis, Sanofi, and Teva. He serves as a consultant for Alexion and Chugai. Dr Wuerfel serves on advisory boards for Novartis and Biogen Idec. He received a research grant from Novartis and speaker honoraria from Bayer, Novartis, and Biogen Idec. He is supported by the German Ministry of Science (BMBF/KKNMS). Dr Banwell serves as a senior editor for Multiple Sclerosis and Related Disorders and on the editorial board of Neurology. She serves as a consultant for Biogen Idec, Novartis, Teva Neuroscience, and Merck Serono. She has been funded by the Canadian MS Research Foundation, the Canadian MS Society, and the Canadian Institutes of Health Research. Dr Greenberg serves as a section editor for JAMA Neurology. He has received consulting fees or honoraria from the Multiple Sclerosis Association of America, DioGenix, Amplimmune, Novartis, and Biogen. He has received grant funding from the National Institutes of Health, the Patient-Centered Outcomes Research Institute, the GJCF, Acorda Therapeutics, and Biogen Idec. Dr Bennett serves as a consultant for Novartis Pharmaceuticals, Alnaylam Pharmaceuticals, MedImmune, Chugai Pharmaceuticals, EMD Serono, AbbVie, Genentech, Genzyme, Apsara Therapeutics, and Questcor Pharmaceuticals; receives license royalties for a patent regarding “Compositions and Methods for the Treatment of Neuromyelitis Optica”; and serves on the editorial boards of the Multiple Sclerosis Journal and the Journal of Neuro-Ophthalmology. Dr Levy receives research support from the National Institutes of Health, the GJCF, Viropharma, Acorda, Sanofi, NeuralStem, and Genentech and serves as a consultant for Chugai Pharmaceuticals, GlaxoSmithKline, and MedImmune. Dr Villoslada serves as a board member for Roche, Novartis, Neurotec Pharma, and Bionure Farma and as a consultant for Novartis, Roche, TFS, Heidelberg Engineering, MedImmune, Digna Biotec, and Neurotec Pharma. He has received research support from the European Commission, the Instituto Salud Carlos III, Marato TV3, Novartis, and Roche and travel expenses from Novartis. He holds patents with Digna Biotec and Bionure Farma and stock/stock options of Bionure Farma. Dr Saiz has received compensation for consulting services and speaking from Bayer Schering, Merck Serono, Biogen Idec, Sanofi, Teva Pharmaceutical Industries, and Novartis. Dr Fujihara serves on scientific advisory boards for Bayer Schering Pharma, Biogen Idec, Mitsubishi Tanabe Pharma Corp, Novartis Pharma, Chugai Pharmaceutical, Ono Pharmaceutical, Nihon Pharmaceutical, Merck Serono, Alexion Pharmaceuticals, MedImmune, and Medical Review; has received funding for travel and speaker honoraria from Bayer Schering Pharma, Biogen Idec, Eisai, Mitsubishi Tanabe Pharma Corp, Novartis Pharma, Astellas Pharma, Takeda Pharmaceutical Company Limited, Asahi Kasei Medical, Daiichi Sankyo, and Nihon Pharmaceutical; serves as an editorial board member of Clinical and Experimental Neuroimmunology (2009 to the present) and an advisory board member of the Sri Lanka Journal of Neurology; has received research support from Bayer Schering Pharma, Biogen Idec Japan, Asahi Kasei Medical, The Chemo-Sero-Therapeutic Research Institute, Teva Pharmaceutical, Mitsubishi Tanabe Pharma, Teijin Pharma, Chugai Pharmaceutical, Ono Pharmaceutical, Nihon Pharmaceutical, and Genzyme Japan; and is funded as the secondary investigator (grant 22229008, 2010-2015) by the Grants-in-Aid for Scientific Research from the Ministry of Education, Science and Technology in Japan and as the secondary investigator by the Grants-in-Aid for Scientific Research from the Ministry of Health, Welfare and Labour of Japan (2010 to the present). Dr Stüve serves on the editorial boards of JAMA Neurology, the Multiple Sclerosis Journal, and Therapeutic Advances in Neurological Disorders. He has received grant support from Teva Pharmaceuticals and Opexa Therapeutics. Dr Stüve has served on data monitoring committees for Pfizer and Sanofi without monetary compensation. He is funded by a Merit grant from the US Department of Veterans Affairs. Dr Aktas receives research support from the German Research Council (DFG), the German Ministry of Education and Research (BMBF-EDEN), Bayer, Biogen Idec, Merck Serono, Novartis, and Teva and serves on an advisory board for MedImmune. He is an academic editor for PLOS ONE. Dr Wingerchuk has received research support from Alexion, Terumo BCT, and the GJCF; receives financial compensation for participation in a relapse adjudication panel for MedImmune; and has served as a consultant to Alexion, MedImmune, and Chugai Pharmaceuticals. No other disclosures are reported.
Additional Contributions
We thank the GJCF for its support in organizing the NMO International Clinical Consortium and Biorepository.
References
- 1.Ito S, Mori M, Makino T, Hayakawa S, Kuwabara S. “Cloud-like enhancement” is a magnetic resonance imaging abnormality specific to neuromyelitis optica. Ann Neurol. 2009;66(3):425–428. doi: 10.1002/ana.21753. [DOI] [PubMed] [Google Scholar]
- 2.Makino T, Ito S, Mori M, Yonezu T, Ogawa Y, Kuwabara S. Diffuse and heterogeneous T2-hyperintense lesions in the splenium are characteristic of neuromyelitis optica. Mult Scler. 2013;19(3):308–315. doi: 10.1177/1352458512454772. [DOI] [PubMed] [Google Scholar]
- 3.Pittock SJ, Weinshenker BG, Lucchinetti CF, Wingerchuk DM, Corboy JR, Lennon VA. Neuromyelitis optica brain lesions localized at sites of high aquaporin 4 expression. Arch Neurol. 2006;63(7):964–968. doi: 10.1001/archneur.63.7.964. [DOI] [PubMed] [Google Scholar]
- 4.Quinn MP, Kremenchutzky M, Menon RS. Venocentric lesions: an MRI marker of MS? Front Neurol. 2013;4:98. doi: 10.3389/fneur.2013.00098. [DOI] [PMC free article] [PubMed] [Google Scholar]
- 5.Yonezu T, Ito S, Mori M, et al. “Bright spotty lesions” on spinal magnetic resonance imaging differentiate neuromyelitis optica from multiple sclerosis. Mult Scler. 2014;20(3):331–337. doi: 10.1177/1352458513495581. [DOI] [PubMed] [Google Scholar]
- 6.Wingerchuk DM, Lennon VA, Pittock SJ, Lucchinetti CF, Weinshenker BG. Revised diagnostic criteria for neuromyelitis optica. Neurology. 2006;66(10):1485–1489. doi: 10.1212/01.wnl.0000216139.44259.74. [DOI] [PubMed] [Google Scholar]
- 7.Cabrera-Gómez J, Saiz-Hinarejos A, Graus F, et al. Brain magnetic resonance imaging findings in acute relapses of neuromyelitis optica spectrum disorders. Mult Scler. 2008;14(2):248–251. doi: 10.1177/1352458507082617. [DOI] [PubMed] [Google Scholar]
- 8.Cabrera-Gomez JA, Kister I. Conventional brain MRI in neuromyelitis optica. Eur J Neurol. 2012;19(6):812–819. doi: 10.1111/j.1468-1331.2011.03565.x. [DOI] [PubMed] [Google Scholar]
- 9.Kim JE, Kim SM, Ahn SW, et al. Brain abnormalities in neuromyelitis optica. J Neurol Sci. 2011;302(1–2):43–48. doi: 10.1016/j.jns.2010.12.001. [DOI] [PubMed] [Google Scholar]
- 10.Kim W, Kim SH, Huh SY, Kim HJ. Brain abnormalities in neuromyelitis optica spectrum disorder. Mult Scler Int. 2012;2012:735486. doi: 10.1155/2012/735486. [DOI] [PMC free article] [PubMed] [Google Scholar]
- 11.Pires CE, Silva CM, Lopes FC, et al. Brain MRI abnormalities in Brazilian patients with neuromyelitis optica. J Clin Neurosci. 2012;19(7):969–974. doi: 10.1016/j.jocn.2011.10.009. [DOI] [PubMed] [Google Scholar]
- 12.Pittock SJ, Lennon VA, Krecke K, Wingerchuk DM, Lucchinetti CF, Weinshenker BG. Brain abnormalities in neuromyelitis optica. Arch Neurol. 2006;63(3):390–396. doi: 10.1001/archneur.63.3.390. [DOI] [PubMed] [Google Scholar]
- 13.Sahraian MA, Radue EW, Minagar A. Neuromyelitis optica: clinical manifestations and neuroimaging features. Neurol Clin. 2013;31(1):139–152. doi: 10.1016/j.ncl.2012.09.010. [DOI] [PubMed] [Google Scholar]
- 14.Wang F, Liu Y, Duan Y, Li K. Brain MRI abnormalities in neuromyelitis optica. Eur J Radiol. 2011;80(2):445–449. doi: 10.1016/j.ejrad.2010.06.024. [DOI] [PubMed] [Google Scholar]
- 15.Wingerchuk DM, Lennon VA, Lucchinetti CF, Pittock SJ, Weinshenker BG. The spectrum of neuromyelitis optica. Lancet Neurol. 2007;6(9):805–815. doi: 10.1016/S1474-4422(07)70216-8. [DOI] [PubMed] [Google Scholar]
- 16.Barnett Y, Sutton IJ, Ghadiri M, Masters L, Zivadinov R, Barnett MH. Conventional and advanced imaging in neuromyelitis optica. AJNR Am J Neuroradiol. 2014;35(8):1458–1466. doi: 10.3174/ajnr.A3592. [DOI] [PMC free article] [PubMed] [Google Scholar]
- 17.Pichiecchio A, Tavazzi E, Poloni G, et al. Advanced magnetic resonance imaging of neuromyelitis optica: a multiparametric approach. Mult Scler. 2012;18(6):817–824. doi: 10.1177/1352458511431072. [DOI] [PubMed] [Google Scholar]
- 18.Aboul-Enein F, Krssák M, Höftberger R, Prayer D, Kristoferitsch W. Diffuse white matter damage is absent in neuromyelitis optica. AJNR Am J Neuroradiol. 2010;31(1):76–79. doi: 10.3174/ajnr.A1791. [DOI] [PMC free article] [PubMed] [Google Scholar]
- 19.Bichuetti DB, Rivero RL, de Oliveira EM, et al. White matter spectroscopy in neuromyelitis optica: a case control study. J Neurol. 2008;255(12):1895–1899. doi: 10.1007/s00415-009-0940-0. [DOI] [PubMed] [Google Scholar]
- 20.de Seze J, Blanc F, Kremer S, et al. Magnetic resonance spectroscopy evaluation in patients with neuromyelitis optica. J Neurol Neurosurg Psychiatry. 2010;81(4):409–411. doi: 10.1136/jnnp.2008.168070. [DOI] [PubMed] [Google Scholar]
- 21.Ciccarelli O, Thomas DL, De Vita E, et al. Low myo-inositol indicating astrocytic damage in a case series of neuromyelitis optica. Ann Neurol. 2013;74(2):301–305. doi: 10.1002/ana.23909. [DOI] [PubMed] [Google Scholar]
- 22.Kremer S, Renard F, Noblet V, et al. Diffusion tensor imaging in human global cerebral anoxia: correlation with histology in a case with autopsy. J Neuroradiol. 2010;37(5):301–303. doi: 10.1016/j.neurad.2009.12.008. [DOI] [PubMed] [Google Scholar]
- 23.Song SK, Sun SW, Ramsbottom MJ, Chang C, Russell J, Cross AH. Dysmyelination revealed through MRI as increased radial (but unchanged axial) diffusion of water. Neuroimage. 2002;17(3):1429–1436. doi: 10.1006/nimg.2002.1267. [DOI] [PubMed] [Google Scholar]
- 24.Klawiter EC, Xu J, Naismith RT, et al. Increased radial diffusivity in spinal cord lesions in neuromyelitis optica compared with multiple sclerosis. Mult Scler. 2012;18(9):1259–1268. doi: 10.1177/1352458512436593. [DOI] [PMC free article] [PubMed] [Google Scholar]
- 25.Liu Y, Duan Y, He Y, et al. A tract-based diffusion study of cerebral white matter in neuromyelitis optica reveals widespread pathological alterations. Mult Scler. 2012;18(7):1013–1021. doi: 10.1177/1352458511431731. [DOI] [PubMed] [Google Scholar]
- 26.Rueda Lopes FC, Doring T, Martins C, et al. The role of demyelination in neuromyelitis optica damage: diffusion-tensor MR imaging study. Radiology. 2012;263(1):235–242. doi: 10.1148/radiol.12111241. [DOI] [PubMed] [Google Scholar]
- 27.Jeantroux J, Kremer S, Lin XZ, et al. Diffusion tensor imaging of normal-appearing white matter in neuromyelitis optica. J Neuroradiol. 2012;39(5):295–300. doi: 10.1016/j.neurad.2011.10.003. [DOI] [PubMed] [Google Scholar]
- 28.Liu Y, Duan Y, He Y, et al. Altered topological organization of white matter structural networks in patients with neuromyelitis optica. PLoS One. 2012;7(11):e48846. doi: 10.1371/journal.pone.0048846. [DOI] [PMC free article] [PubMed] [Google Scholar]
- 29.Yu C, Lin F, Li K, et al. Pathogenesis of normal-appearing white matter damage in neuromyelitis optica: diffusion-tensor MR imaging. Radiology. 2008;246(1):222–228. doi: 10.1148/radiol.2461062075. [DOI] [PubMed] [Google Scholar]
- 30.Yu CS, Lin FC, Li KC, et al. Diffusion tensor imaging in the assessment of normal-appearing brain tissue damage in relapsing neuromyelitis optica. AJNR Am J Neuroradiol. 2006;27(5):1009–1015. [PMC free article] [PubMed] [Google Scholar]
- 31.Zhao DD, Zhou HY, Wu QZ, et al. Diffusion tensor imaging characterization of occult brain damage in relapsing neuromyelitis optica using 3.0T magnetic resonance imaging techniques. Neuroimage. 2012;59(4):3173–3177. doi: 10.1016/j.neuroimage.2011.11.022. [DOI] [PubMed] [Google Scholar]
- 32.Qian W, Chan Q, Mak H, et al. Quantitative assessment of the cervical spinal cord damage in neuromyelitis optica using diffusion tensor imaging at 3 Tesla. J Magn Reson Imaging. 2011;33(6):1312–1320. doi: 10.1002/jmri.22575. [DOI] [PubMed] [Google Scholar]
- 33.Filippi M, Rocca MA, Moiola L, et al. MRI and magnetization transfer imaging changes in the brain and cervical cord of patients with Devic’s neuromyelitis optica. Neurology. 1999;53(8):1705–1710. doi: 10.1212/wnl.53.8.1705. [DOI] [PubMed] [Google Scholar]
- 34.Rocca MA, Agosta F, Mezzapesa DM, et al. Magnetization transfer and diffusion tensor MRI show gray matter damage in neuromyelitis optica. Neurology. 2004;62(3):476–478. doi: 10.1212/01.wnl.0000106946.08741.41. [DOI] [PubMed] [Google Scholar]
- 35.Grassiot B, Desgranges B, Eustache F, Defer G. Quantification and clinical relevance of brain atrophy in multiple sclerosis: a review. J Neurol. 2009;256(9):1397–1412. doi: 10.1007/s00415-009-5108-4. [DOI] [PubMed] [Google Scholar]
- 36.Blanc F, Noblet V, Jung B, et al. White matter atrophy and cognitive dysfunctions in neuromyelitis optica. PLoS One. 2012;7(4):e33878. doi: 10.1371/journal.pone.0033878. [DOI] [PMC free article] [PubMed] [Google Scholar]
- 37.Chanson JB, Lamy J, Rousseau F, Blanc F, Collongues N, Fleury M, et al. White matter volume is decreased in the brain of patients with neuromyelitis optica. Eur J Neurol. 2013;20(2):361–367. doi: 10.1111/j.1468-1331.2012.03867.x. [DOI] [PubMed] [Google Scholar]
- 38.Duan Y, Liu Y, Liang P, et al. White matter atrophy in brain of neuromyelitis optica: a voxel-based morphometry study. Acta Radiol. 2014;55(5):589–593. doi: 10.1177/0284185113501815. [DOI] [PubMed] [Google Scholar]
- 39.Duan Y, Liu Y, Liang P, et al. Comparison of grey matter atrophy between patients with neuromyelitis optica and multiple sclerosis: a voxel-based morphometry study. Eur J Radiol. 2012;81(2):e110–e114. doi: 10.1016/j.ejrad.2011.01.065. [DOI] [PubMed] [Google Scholar]
- 40.Saji E, Arakawa M, Yanagawa K, et al. Cognitive impairment and cortical degeneration in neuromyelitis optica. Ann Neurol. 2013;73(1):65–76. doi: 10.1002/ana.23721. [DOI] [PubMed] [Google Scholar]
- 41.van den Heuvel MP, Hulshoff Pol HE. Exploring the brain network: a review on resting-state fMRI functional connectivity. Eur Neuropsychopharmacol. 2010;20(8):519–534. doi: 10.1016/j.euroneuro.2010.03.008. [DOI] [PubMed] [Google Scholar]
- 42.Liu Y, Liang P, Duan Y, et al. Abnormal baseline brain activity in patients with neuromyelitis optica: a resting-state fMRI study. Eur J Radiol. 2011;80(2):407–411. doi: 10.1016/j.ejrad.2010.05.002. [DOI] [PubMed] [Google Scholar]
- 43.Rocca MA, Valsasina P, Absinta M, et al. Default-mode network dysfunction and cognitive impairment in progressive MS. Neurology. 2010;74(16):1252–1259. doi: 10.1212/WNL.0b013e3181d9ed91. [DOI] [PubMed] [Google Scholar]
- 44.Rocca MA, Agosta F, Mezzapesa DM, et al. A functional MRI study of movement-associated cortical changes in patients with Devic’s neuromyelitis optica. Neuroimage. 2004;21(3):1061–1068. doi: 10.1016/j.neuroimage.2003.10.013. [DOI] [PubMed] [Google Scholar]
- 45.Liang P, Liu Y, Jia X, et al. Regional homogeneity changes in patients with neuromyelitis optica revealed by resting-state functional MRI. Clin Neurophysiol. 2011;122(1):121–127. doi: 10.1016/j.clinph.2010.05.026. [DOI] [PubMed] [Google Scholar]
- 46.Hemmert C, Achard S, Renard F, et al. Resting-state functional MRI demonstrates brain network reorganisation in neuromyelitis optica. Paper presented at: 29th Congress of the European Committee for Treatment and Research in Multiple Sclerosis/18th Annual Conference of Rehabilitation in MS; October 2–5, 2013; Copenhagen, Denmark. [Google Scholar]
- 47.Kister I, Herbert J, Zhou Y, Ge Y. Ultrahigh-field MR (7 T) imaging of brain lesions in neuromyelitis optica. Mult Scler Int. 2013;2013:398259. doi: 10.1155/2013/398259. [DOI] [PMC free article] [PubMed] [Google Scholar]
- 48.Sinnecker T, Dörr J, Pfueller CF, et al. Distinct lesion morphology at 7-T MRI differentiates neuromyelitis optica from multiple sclerosis. Neurology. 2012;79(7):708–714. doi: 10.1212/WNL.0b013e3182648bc8. [DOI] [PubMed] [Google Scholar]
- 49.Sinnecker T, Bozin I, Dörr J, et al. Periventricular venous density in multiple sclerosis is inversely associated with T2 lesion count: a 7 Tesla MRI study. Mult Scler. 2013;19(3):316–325. doi: 10.1177/1352458512451941. [DOI] [PubMed] [Google Scholar]
- 50.Tallantyre EC, Dixon JE, Donaldson I, et al. Ultra-high-field imaging distinguishes MS lesions from asymptomatic white matter lesions. Neurology. 2011;76(6):534–539. doi: 10.1212/WNL.0b013e31820b7630. [DOI] [PMC free article] [PubMed] [Google Scholar]
- 51.Kuchling J, Sinnecker T, Bozin I, et al. Ultrahigh field MRI in context of neurological diseases [in German] Nervenarzt. 2014;85(4):445–458. doi: 10.1007/s00115-013-3967-5. [DOI] [PubMed] [Google Scholar]
- 52.Matthews L, Marasco R, Jenkinson M, et al. Distinction of seropositive NMO spectrum disorder and MS brain lesion distribution. Neurology. 2013;80(14):1330–1337. doi: 10.1212/WNL.0b013e3182887957. [DOI] [PMC free article] [PubMed] [Google Scholar]
- 53.Kister I, Ge Y, Herbert J, Sinnecker T, Wuerfel J, Paul F. Distinction of seropositive NMO spectrum disorder and MS brain lesion distribution. Neurology. 2013;81(22):1966. doi: 10.1212/01.wnl.0000436079.95856.1f. [DOI] [PMC free article] [PubMed] [Google Scholar]
- 54.Popescu BF, Parisi JE, Cabrera-Gómez JA, et al. Absence of cortical demyelination in neuromyelitis optica. Neurology. 2010;75(23):2103–2109. doi: 10.1212/WNL.0b013e318200d80c. [DOI] [PMC free article] [PubMed] [Google Scholar]
- 55.Absinta M, Sati P, Gaitán MI, et al. Seven-tesla phase imaging of acute multiple sclerosis lesions: a new window into the inflammatory process. Ann Neurol. 2013;74(5):669–678. doi: 10.1002/ana.23959. [DOI] [PMC free article] [PubMed] [Google Scholar]
- 56.Jarius S, Wildemann B, Paul F. Neuromyelitis optica: clinical features, immunopathogenesis and treatment. Clin Exp Immunol. 2014;176(2):149–164. doi: 10.1111/cei.12271. [DOI] [PMC free article] [PubMed] [Google Scholar]
- 57.Roemer SF, Parisi JE, Lennon VA, et al. Pattern-specific loss of aquaporin-4 immunoreactivity distinguishes neuromyelitis optica from multiple sclerosis. Brain. 2007;130(pt 5):1194–1205. doi: 10.1093/brain/awl371. [DOI] [PubMed] [Google Scholar]