

Abstract
Scope
Down syndrome (DS), caused by trisomy of human chromosome 21 (Hsa21), is characterized by a spectrum of phenotypes including skeletal abnormalities. The Ts65Dn DS mouse model exhibits similar skeletal phenotypes as humans with DS. DYRK1A, a kinase encoded on Hsa21, has been linked to deficiencies in bone homeostasis in DS mice and individuals with DS. Treatment with Epigallocatechin-3-gallate (EGCG), a known inhibitor of Dyrk1a, improves some skeletal abnormalities associated with DS in mice. EGCG supplements are widely available but the effectiveness of different EGCG-containing supplements have not been well studied.
Methods and results
Six commercially available supplements containing EGCG were analyzed, and two of these supplements were compared with pure EGCG for their impact on skeletal deficits in a DS mouse model. The results demonstrate differential effects of commercial supplements on correcting skeletal abnormalities in Ts65Dn mice. Different EGCG-containing supplements display differences in degradation, polyphenol content and effects on trisomic bone.
Conclusions
This work suggests that the dose of EGCG and composition of EGCG-containing supplements may be important in correcting skeletal deficits associated with DS. Careful analyses of these parameters may lead to a better understanding of how to improve skeletal and other deficits that impair individuals with DS.
Keywords: Down syndrome, Epigallocatechin-3-gallate, mouse model, skeletal deficits, supplements
1. Introduction
Bone abnormalities associated with Down syndrome
Down syndrome (DS), is caused by three copies of human chromosome 21 (Hsa21) and affects approximately 1 in 700 births [1]. Though it is most associated with cognitive and cardiac abnormalities, craniofacial and skeletal deficits are among the hallmarks of DS [2]. Skeletal deficiencies and lack of accrual of bone mass during development and childhood predispose individuals with DS to fragility fractures and osteoporosis at later ages [3-6]. As the average expected lifespan for individuals with DS has increased from 9 years in 1929 to 60 or more years currently [7-9], there is an increasing and important need to address the problems of fractures and osteoporosis in this population.
Bone abnormalities in Ts65Dn DS mice
The Ts(1716)65Dn mouse (Ts65Dn), the most widely used and well characterized DS model, displays segmental trisomy of distal mouse chromosome 16 (Mmu16) and carries approximately half the genes conserved between Hsa21 and Mmu16 [10, 11]. Ts65Dn DS male mice exhibit bone deficits that are similar to those seen in individuals with DS [12, 13]. Femurs from Ts65Dn mice display significantly lower bone mineral density (BMD), bone mineral content (BMC) and deficits in trabecular microarchitecture when compared to euploid littermates [12]. The cortical bone of Ts65Dn mice shows significantly lower total cross-sectional area and periosteal perimeter. Bone formation rate (BFR) and mineral apposition rate (MAR) have both been shown to be significantly lowered due to a reduction in osteoblasts and osteoclast activity [13]. Overall, the combination of trabecular and cortical structural phenotypes in the Ts65Dn mouse femur suggest a reduction in the size and strength of the trisomic long bone.
Genetic origins of DS bone abnormalities
It has been hypothesized that DYRK1A (dual specificity tyrosine-regulated kinase 1A), the product of a gene found in three copies in humans with DS as well as in Ts65Dn mice, significantly affects DS phenotypes including skeletal malformations [14]. Dyrk1a transgenic mice with an additional copy of human DYRK1A under the control of an endogenous promoter exhibit a low bone mass osteoporotic phenotype characterized by reduced bone volume fraction (BV/TV) and altered trabecular microarchitecture as well as osteoclast and osteoblast deficiencies [15]. We have shown that subtracting one copy of Dyrk1a from an otherwise trisomic Ts65Dn mice by breeding (Ts65Dn × Dyrk1a+/−) mice, normalizes many of the skeletal deficits in this trisomic mouse model [16].
EGCG is a known inhibitor of DYRK1A and rescues bone deficits
Epigallocatechin-3-gallate (EGCG), a green tea polyphenol, inhibits the kinase activity of Dyrk1a [17] and is thought to act by binding to the ATP binding site on Dyrk1a [18]. EGCG has been hypothesized to contribute to the beneficial effects in bone health because of a positive correlation between tea drinking and increased BMD in some women [19-25]. EGCG exhibits low toxicity, absorbs in the gastrointestinal tract, crosses the blood-brain barrier and no adverse side effects have been reported in habitual green tea drinkers [26-28]. Green tea polyphenols given to mice and rats with skeletal loss generally improved the bone [29-32].
In DS mouse models, treatment with EGCG-containing supplements has been shown to rescue brain defects induced by Dyrk1a overexpression [26, 33, 34]. EGCG treatment has also been shown to mildly improve cognitive phenotypes in individuals with DS [35]. We have shown that a three week treatment of EGCG ameliorates the bone deficits of three week old Ts65Dn mice when compared to age matched euploid mice [16].
Many available EGCG-containing supplements are marketed as dietary supplements and not regulated by government agencies. As with many herbal supplements, the specific activity, purity, and overall effectiveness of each batch of product may vary. In the present study, we established a protocol for quantifying EGCG content in EGCG-containing supplements. We also tested the effects of two EGCG-containing supplements on the rescue of bone phenotypes associated with DS in Ts65Dn mice and compared them with the corrective effects of pure EGCG. We hypothesized that supplements with a lower concentration of EGCG would be less effective in ameliorating the bone deficits than pure EGCG. We show that in addition to containing differing amounts of EGCG, the supplements exhibit different rates of loss of EGCG in solution. EGCG-containing supplements also have differential effects on bone structure and mechanical properties.
2. Materials and methods
Animals
Female B6EiC3Sn a/A-Ts(1716)65Dn (Ts65Dn—stock number 001924) and male B6C3F1 (stock number 100010) mice were purchased from the Jackson Laboratory (Bar Harbor, ME). Ts65Dn males were generated at Indiana University-Purdue University Indianapolis (IUPUI) by crossing Ts65Dn females with B6C3F1 males and were genotyped using a breakpoint PCR protocol [36]. Ts65Dn (approximate 50% C57BL/6 and 50% C3H background with small marker [trisomic] chromosome) mothers generated the 41 trisomic and 51 euploid male mice used for this study. Only male mice were used due to the subfertile nature of Ts65Dn male mice and importance of Ts65Dn female mice in colony maintenance. All animal use and protocols were approved by the IUPUI School of Science IACUC SC213R.
EGCG sample evaluation and quantification
EGCG samples were collected from six different commercially available products that had a stated content of 50 to 100% EGCG (Supplemental Table 1). LC/MS analysis was performed on all samples and components of each supplement were compared to >95% pure EGCG, ECG, EGC (Sigma-Aldrich) and EC (Fluka). Based upon LC/MS results, more rigorous analyses were performed on EGCG (Sigma-Aldrich), and supplements “EGCG-A” (EA; Label declaration: 50% EGCG, 98% Total Polyphenols, 80% Catechins with 25% Decaffeinated Green Tea Leaf) and “EGCG-B” (EB; Label declaration: 90% EGCG, caffeine free) and these products were further used in this study. EGCG, EA and EB supplements were diluted in tap water to a concentration of 1mg/ml EGCG according to EGCG content on the label, and dilutions were left at room temperature and light for 1, 24 and 48 hours. Degradation of EGCG in the samples was analyzed using an Agilent 1200SL HPLC coupled with an Agilent 6520 quadrupole time-of-flight mass spectrometer (MS). Samples were separated using reverse phase chromatography with a Zorbax Eclipse Plus C18 column (2.1 × 50 mm, 1.8 μm particle size) operating at a temperature of 40°C. Solvents of A (water with 0.1% formic acid) and B (acetonitrile with 0.1% formic acid) were used starting with 10% solvent B held for 0.1 min, followed by a stepwise gradient ending with 95% solvent B over five minutes. Calibration curves were prepared using EGCG with concentrations ranging from 0.1-1.1 mg/mL. UV absorption was used to quantify the organic EGCG product at a wavelength of 230 nm.
Because herbal supplements are not regulated by the government, manufacturers are not required to quantify components of the supplements. To quantify and validate the reported amount of EGCG found in EA, EB and EGCG, a standard curve was created that correlated UV absorption with known concentrations of pure EGCG. EGCG standards were prepared from a 1.1 mg/mL stock solution (0.275, 0.55, 0.825, 1.0, and 1.1mg/mL). EGCG-containing supplements were prepared at 1mg/ml of EGCG according to EGCG content on the label. The standard solutions and EGCG-containing supplements analyses were performed using an Agilent 1100 HPLC coupled to an Agilent 6130 MSD (LC/MS). Samples were separated using a Poroshell C18 column (EC-C18 2.1 × 50 mm, 2.7 μm) and a diode array detector at 230 nm using the same mobile phases and gradients described above. This column was selected because it performs very similar to the Zorbax column described above, but operates at a lower backpressure. The peak height was used to determine the area under the curve for EGCG of pure EGCG, EA and EB.
MS using electrospray ionization was used to confirm the mass of the EGCG peak and provide clues to the identity of other components found in these analyses. Results were analyzed using MassHunter or Chemstation software packages. All analyses were performed in triplicate.
EGCG treatment
For treatment, the EGCG was dissolved in a small volume of PBS, and the EGCG in PBS as well as EA and EB were dissolved in tap water to make solutions of a final concentration of 0.124 mg/ml EGCG according to the concentration listed on the supplement label. The three week old mice were given free access to 20-25 ml of the treatment (or tap water for controls) and the fluids were measured and changed every 48 hrs for three weeks. Trisomic (Ts) and euploid (Eu) mice were randomly assigned to groups and treated with EGCG, EA, EB or water (Ts+H2O n=10, Eu+H2O n=18, Ts+EGCG n=10, Eu+EGCG n=10, Ts+EA n=10, Eu+EA n=10, Ts+EB n=11 and Eu+EB n=13). After accounting for actual EGCG concentration and degradation, the mice, on average, received 9 (EGCG), 3.7 (EA) and 3 (EB) mg/kg/day EGCG (see results). At the end of the three week treatment period, the animals were euthanized and femurs were extracted. The right femur was placed in 0.9% saline solution and the left femur in 70% ethanol. The femurs were frozen and stored at −20 °C until further use.
Dual energy X-ray absorptiometry (DXA)
The bone mineral density (BMD), bone mineral content (BMC), and area of the left femurs were analyzed using the Lunar Piximus DXA densitometer (PIXImus Lunar Corp., Madison, WI) using the protocol previously described [12].
MicroCT imaging and analysis
The left femurs were imaged using the SkyScan 1172 microCT (SkyScan, Bruker microCT, Belgium) with the following parameters: voltage 60 kV, resolution 6 μm, binning mode 2 k and filter Al 0.5 mm. The distal and midshaft portion of the femur were scanned to obtain data for trabecular thickness, separation, number, percent bone volume, and cortical parameters as previously described [12]. A reconstruction analysis was performed using NRecon and CTan software (SkyScan, Bruker microCT, Belgium). The region of interest was selected to compose the boundary between the trabecular bone in the distal femur and 1 mm of tissue, proximal to the growth plate. For cortical bone analysis, the bone at the midshaft was analyzed. The regions of interest for femurs were kept constant across genotype and treatment groups.
Mechanical testing
The mechanical properties of the femur were determined by 3-point bending using a mechanical testing machine (100 R250 Modular Test System, TestResources Inc, Shakopee, MN). The femurs were thawed to room temperature, placed posterior side down on the lower supports of the 3-point bending apparatus held apart at 7 mm and the force was applied to the midpoint of the bone at all times. The femur was preloaded using 0.1 N to establish contact with the bone. Once preloaded, the bone was monotonically tested to failure at a displacement rate of 0.1 mm/s. The mechanical strength, stiffness, and structural work (energy dissipation to failure) were determined from the resulting force-displacement curves. Yield was determined as a 15% loss in the initial secant stiffness.
Statistical analysis
Differences in degradation were analyzed in IBM SPSS Statistics 22 (IBM, Armonk, NY). A two way mixed ANOVA was used to examine the concentration after 1, 24 and 48 hours of EGCG, with EGCG source as a grouping factor and time as the repeated measure. Post-hoc Tukey’s HSD tests were used to establish differences between EGCG sources. DXA, Micro CT and mechanical data were analyzed in Matlab (MathWorks, Natick, MA) using a custom designed code. Assumptions of normality and homogeneity were assessed, and violations corrected with transformations. A two way ANOVA was used to determine the main effects of genotype, treatment and their interaction. A one way ANOVA with post-hoc Tukey’s HSD tests were performed to investigate differences with treatment in the trisomic mice.
3. Results
EGCG characterization
Six EGCG-containing supplements all had a major peak corresponding to EGCG (mass=458) as well as inert and insoluble components that were not identified by our mass spectrometry comparisons. Smaller peaks were observed that corresponded to epicatechin (EC, mass=290), epigallocatechin (EGC, mass=306) and/or epicatechin gallate (ECG, mass=442) in each of the supplements (Supplemental Table 1). We decided to concentrate on two supplements having a lower and higher percentage of EGCG as well as more or fewer observed catechins, respectively, with > 95% pure EGCG. Samples from EA and EB were prepared to contain 1 mg/ml EGCG using the EGCG content as stated on the label. EA had a significantly higher actual concentration of EGCG at 0h than EB (Figure 1A).
Figure 1.
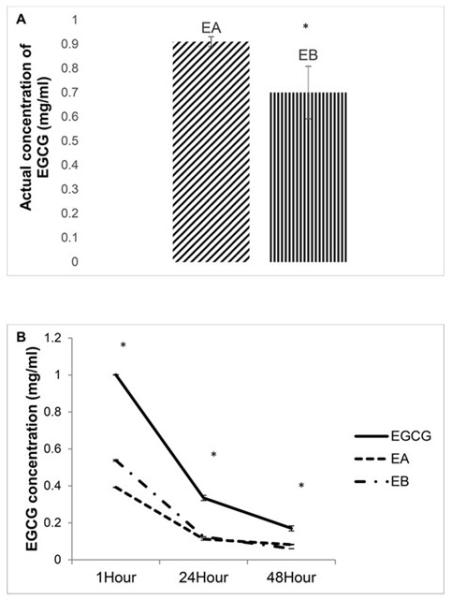
Concentration of EGCG found in supplements. (A) ECGC-containing supplements EA and EB were prepared and normalized to 1mg/ml according to the EGCG content on the label. HPLC analysis was immediately performed and compared to a standard curve made from pure EGCG. Mean of the actual concentration in the sample shown (n = 3 samples each) * represents significant difference at p<0.05. (B) EGCG and EGCG-containing supplements were suspended in water and EGCG concentration was measured after 1, 24 or 48 hours by HPLC (n= 3 samples each time point). * represents significant differences of a post-hoc Tukey’s HSD (p<0.05). At all timepoints, EGCG>EA and EB; no difference was found between EA and EB. Data represented as mean ± SEM.
To study potential bioavailability of different EGCG containing products, we conducted a degradation analysis of EGCG-containing supplements by LC/MS. After normalizing the EGCG content to 1.0 mg/ml as above, we measured EGCG concentration after 1, 24 and 48 h at room temperature and light. Significant differences were observed in EGCG content between pure EGCG and the supplements at each time point (Figure 1B).
DXA analysis of Ts65Dn femurs
The different composition of the supplements led us to test the effects of EA and EB on correcting bone abnormalities seen in Ts65Dn DS mice. Using measured liquid consumption and degradation data, the estimated EGCG intake in mice was ~9 (EGCG), 3.7 (EA) and 3 (EB) mg/kg/day. Bone mineral density (BMD), bone mineral content (BMC) and bone area data were obtained from DXA scanning and analyzed to find the differential effects of each treatment. Femurs of Ts65Dn mice treated with either EGCG, EA or EB or given water (control) were compared to euploid animals that underwent the same treatments. Two way ANOVAs comparing all animals with all treatments showed that there was a significant genotype effect, and BMD (p<0.001), BMC (p<0.003), and area (p<0.001, not shown) were all lower in trisomic as compared to euploid mice. Treatment was not a significant factor for BMD or BMC among Ts65Dn mice (p=0.161 for both BMD and BMC, one way ANOVA) and treatment with EA or EB was not better than EGCG for trisomic mice (Figure 2).
Figure 2.
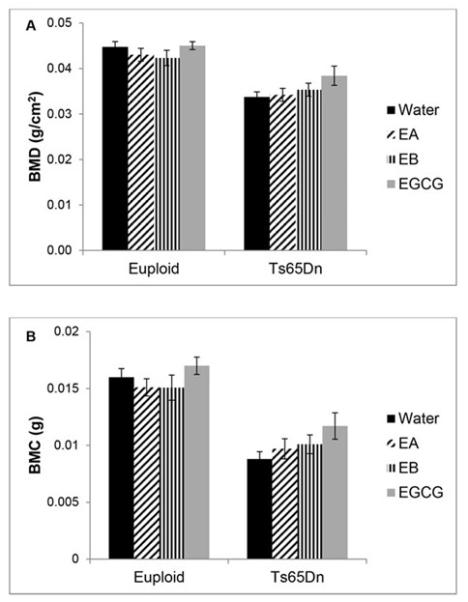
Bone mineral density and content of trisomic and euploid femurs treated with EGCG-containing supplements or water. A significant genotype effect was seen in (A) bone mineral density (BMD) or (B) bone mineral content (BMC) of trisomic or euploid 6 week old femurs treated with EGCG or water (Euploid+water, n=18 ; Euploid+EA, n=10; Euploid+EB, n=13; Euploid+EGCG, n=10; Ts65Dn+water, n=10; Ts65Dn+EA, n=10; Ts65Dn+EB, n=10; Ts65Dn+EGCG, n=10). Data represented as mean ± SEM.
MicroCT analysis of femurs
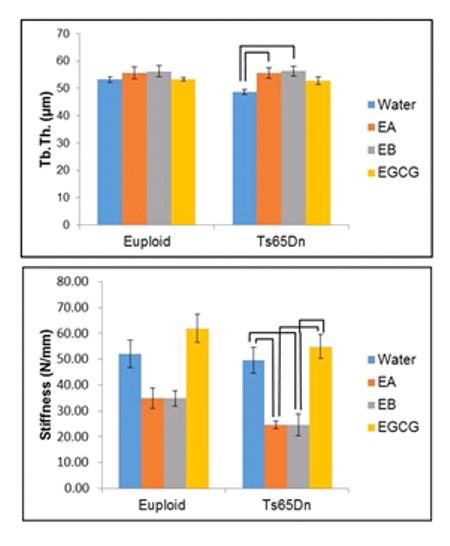
In the present study, all trisomic mice had a significantly lower BV/TV than euploid mice (p<0.001). Treatment significantly increased BV/TV (p=0.017) in all animals and post-hoc analysis indicated that EA treated trisomic mice had significantly improved BV/TV compared to untreated trisomic mice (Figure 3A). For trabecular thickness, only a treatment effect was observed (p=0.001, two way ANOVA) when all animals were considered together. When comparing just Ts65Dn mice, treatment with either EA or EB produced a significantly increased trabecular thickness compared to untreated Ts65Dn mice (Figure 3B). For trabecular number, both a genotype (p<0.001) and a treatment effect (p=0.05) were observed with euploid mice showing a significantly increased trabecular number compared to trisomic mice. In trisomic mice, treatment with EA showed a significant increase in trabecular number when compared to untreated Ts65Dn mice (Figure 3C). For trabecular separation when comparing all mice, there was an interaction between genotype and treatment (p=0.014, two way ANOVA). When Ts65Dn mice were analyzed together, the treatment significantly affected trabecular separation (p=0.001), but no treatment was significantly better than another (Figure 3D). There were significant genotype (p<0.001) and treatment (p<0.001) effects for polar moment of inertia with euploid mice exhibiting a significantly larger polar moment of inertia compared to trisomic mice. One way ANOVA of trisomic mice showed a treatment effect (p<0.001) with treatment with EA and EB significantly increased polar moment of inertia over EGCG treatment or water (Figure 3E). Bone perimeter showed significant genotype (p<0.001) and treatment (p<0.001) effects with two way ANOVA when all animals were compared together. In contrast to our previous studies showing limited improvements in bone perimeter in Ts65Dn mice treated with EGCG, we saw significant improvements in bone perimeter (p<0.001) with EA and EB treatment. When trisomic mice were compared with a one way ANOVA, both EA and EB treated animals had significantly greater bone perimeter than EGCG or untreated trisomic animals (Figure 3F).
Figure 3.
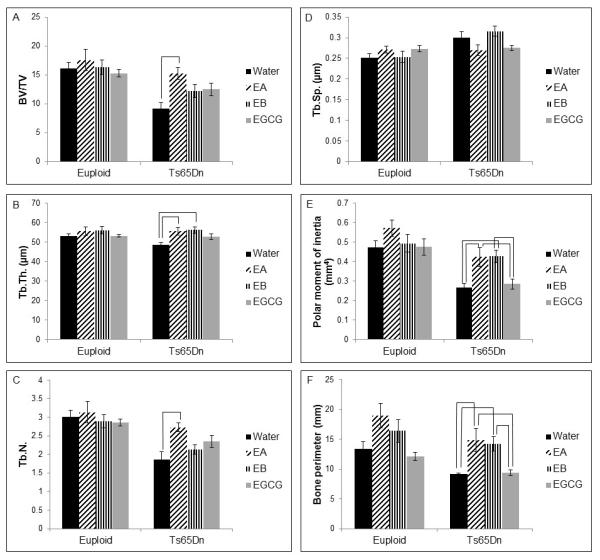
Bone microstructure of euploid and Ts65Dn mice treated with EGCG-containing supplements or water. (A) Bone volume/total volume (BV/TV; bar indicates significant difference between Ts65Dn+water and Ts65Dn+EA, p=0.002, one way ANOVA), (B) trabecular thickness (Tb.Th.; bars indicate significant difference between Ts65Dn+water and both Ts65Dn+EA and Ts65Dn+EB, p=0.004, one way ANOVA); (C) trabecular number (Tb.N.; bar indicates significant difference between Ts65Dn+water and Ts65Dn+EA, p=0.005, one way ANOVA); (D) trabecular separation (Tb.Sp.); for Euploid+water, n=17 ; Euploid+EA, n=7; Euploid+EB, n=9; Euploid+EGCG, n=10; Ts65Dn+water, n=10; Ts65Dn+EA, n=9; Ts65Dn+EB, n=9; Ts65Dn+EGCG, n=9. (E) Polar moment of inertia; and (F) bone perimeter are from Euploid+water, n=18; Euploid+EA, n=10; Euploid+EB, n=12; Euploid+EGCG, n=10; Ts65Dn+water, n=10; Ts65Dn+EA, n=10; Ts65Dn+EB, n=10; Ts65Dn+EGCG, n=10 mice. Bars indicate significant differences between groups after post-hoc analyses of one way ANOVA. Data represented as mean ± SEM.
Bone mechanical properties after EGCG-containing treatments
Ultimate force (measuring general strength of the bone) was significantly reduced in Ts65Dn as compared to euploid mice (p<0.001) and there also was a significant treatment effect (p<0.001) when comparing all mice together (two way ANOVA). When only trisomic animals were compared, treatment was significant (p<0.001, one way ANOVA) and Ts65Dn bones from animals receiving treatment with EGCG had a higher ultimate force than Ts65Dn animals treated with EA or EB (Figure 4A). Similarly, when bone stiffness was quantified, bones from Ts65Dn animals were less stiff than euploid animals (p=0.017) and treatment significantly influenced stiffness (p<0.001). When trisomic mice were compared, mice that received either EA or EB had significantly reduced stiffness as compared to mice that received EGCG or water in post-hoc tests after one way ANOVA (Figure 4B).
Figure 4.
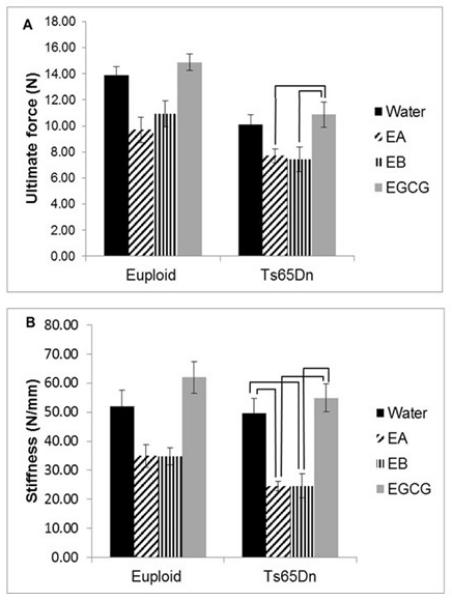
Mechanical properties reduced by EGCG-containing supplements. (A) Ultimate force and (B) stiffness are both significantly reduced in the femurs of 6 week old Ts65Dn mice receiving EA or EB as compared to EGCG for three weeks (Euploid+water, n=15; Euploid+EA, n=9; Euploid+EB, n=11; Euploid+EGCG, n=9; Ts65Dn+water, n=8; Ts65Dn+EA, n=10; Ts65Dn+EB, n=8; Ts65Dn+EGCG, n=9). Bars indicate significant differences between groups after post-hoc analyses of one way ANOVA. Data represented as mean ± SEM.
When yield force (a measure of the ability of bone to resist permanent deformation), deformation to yield (measuring how much the bone elastically deforms), and work to yield (measuring energy absorbed by the structure prior to yielding) were quantified, significant interactive effects between genotype and treatment were found (p=0.034, p=0.004 and p=0.004, respectively)(Figure 5). Treatment of trisomic mice was significant (p=0.01) and in Ts65Dn mice, treatment with EGCG or water alone was significantly better in yield force than treatment with EA (Figure 5A). Deformation to yield was significant among trisomic animals (p<0.001) with EB treatment giving a significantly higher value than no treatment or treatment with EGCG (Figure 5B). There was a significant genotype effect in work to yield, with euploid absorbing more energy than trisomic mice. There were no significant treatment effects for work to yield (Figure 5C).
Figure 5.

Brittleness of bones from Ts65Dn and euploid mice treated with EGCG-containing supplements or water. (A) Yield force, (B) deformation to yield, and (C) work to yield from Euploid+water, n=15; Euploid+EA, n=9; Euploid+EB, n=11; Euploid+EGCG, n=9; Ts65Dn+water, n=8; Ts65Dn+EA, n=10; Ts65Dn+EB, n=8; Ts65Dn+EGCG, n=9 mice. Bars indicate significant differences between groups after post-hoc analyses of one way ANOVA. Data represented as mean ± SEM.
The trisomic genotype significantly decreased post yield deformation (p=0.049), failure deformation (p=0.031), post yield work (p<0.001) and total work (p<0.001) indicating trisomic bones that are less able to tolerate damage accrual and that is generally associated with brittle behavior. Treatment with any EGCG-containing supplement caused a significant increase in post yield deformation (p=0.018) and failure deformation (p=0.004), but due to a high amount of variability in these measurements, interpretation of these results was difficult.
4. Discussion
Our analyses demonstrate some improvement of trabecular microarchitecture in trisomic, young adult mice by EGCG-containing supplements. Mice receiving EA showed significant improvement in BV/TV and trabecular number. Treatment with EA or EB showed significantly increased trabecular thickness. Treatment with EA or EB also increased bone perimeter and mean polar moment of inertia above that found with EGCG treatment. Based on these results, it would appear that EA or EB treatment might be better for some skeletal parameters than EGCG alone.
In contrast with these positive results for bone microarchitecture, there were significant differences and deficits in bone strength when EA or EB treatments were given. Ultimate force, bone stiffness and yield force were all reduced, even below control (water treatment) levels, with EA or EB treatment. EA and EB treatment, however, improved deformation to yield. From these results, it appears that treatment with EA or EB may decrease bone strength. Though EA and EB treatment improved deformation to yield, it also seemed to negatively affect the work to yield when the treatment was given to normal mice.
The differences observed between the inherent properties of the three sources of EGCG may account for the dissimilarities in the results of treatment. The strong antioxidant nature of EGCG results in its rapid degradation and poor bioavailability [37]. Variation between capsules (samples) within the same lot could also account for variation between EGCG concentrations within a sample. We chose to provide treatment ad libitum in water because similar methodologies were used in other studies testing the effectiveness of EGCG for DS phenotypes in mice [26, 35, 38]. From our degradation analysis, the amount of EGCG consumed by mice from the EA and EB treatments is less than half for the mice treated with pure EGCG. Treatments with differing amounts of EGCG may account for the differential effects on the bone properties, and less EGCG may improve bone microarchitecture but not improve bone strength. Increasing EGCG’s bioavailability, by acidification or other method [37], may lead to increased and longer concentration in the body. The dose and bioavailability of EGCG appear to be critical parameters important in the effect on multiple DS related phenotypes [38].
The presence of different polyphenols in EA or EB, as well as degradation products, could also account for the different effects on bone. Green tea contains a high level of catechins consisting primarily of EGCG, but also EGC, ECG and EC [39]. We observed masses corresponding to EGC and ECG in significant amount in EA along with a small amount of epicatechin (EC). A much smaller peak corresponding to ECG (>10% the value seen in EA) was also seen in EB along with a small amount of epicatechin. Small amounts of ECG and epicatechin were also seen in our pure EGCG over time and these small amounts of other polyphenols in all of the supplements possibly represent degradation products. Interaction between EGCG and other catechins in EA or EB could amplify its action in trabecular bone, but decrease bioavailability and overall strength of bone. Treatment of 1-2% green tea extract containing EGCG, EGC, ECG and EC with caffeine resulted in reduced BMC, cortical volume and thickness in obese and lean wildtype male C57BL/6 littermates [31]. In contrast, using 50mg/kg/day pure EGCG treatment, female C57BL/6 ovariectomized mice showed increased BV/TV, trabecular number and marginally decreased trabecular separation [32]. A limitation of our study is that we do not know the concentration of each catechin at the time of ingestion or in the bloodstream. Our efforts to quantify EGCG in the bloodstream found the EGCG concentration after three weeks treatment at a level below our ability to detect EGCG. Treatment with separate catechins in Ts65Dn and euploid mice using similar protocols as the present study would be beneficial in testing these hypotheses.
Another limitation of our study is that differences in bone have only been quantified in Ts65Dn male mice, due to the subfertile nature of the Ts65Dn mouse model. It is unknown if there is a sexual dimorphism in DS-related bone deficits or if there is an interaction between sex and treatment in DS mouse models. These hypotheses will be important to test in future experiments.
Overall, our analyses show that different EGCG containing supplements display differences in degradation, polyphenol content and effects on trisomic bone. Because products containing EGCG are widely available, individuals desiring the beneficial effects of these supplements should view all studies examining improvements in phenotypes, including those associated with DS, with care. If multiple studies continue to show the beneficial effects of EGCG, more research will be necessary to better understand the effects of different green tea polyphenols and other components that are often mixed with EGCG in correcting DS-associated phenotypes [38]. Additionally, EGCG concentration should be precisely quantified to assure the actual EGCG dosage used in different experiments. We have shown that even when EGCG content stated is similar, there are widely varying effects in the skeletal phenotypes in a mouse model of DS. These data provide information about how EGCG-containing supplements may differentially affect alterations in bone structure, and the selection of EGCG treatment options for DS phenotypes.
Supplementary Material
Acknowledgments
Funding
This work was supported by grants from the Jerome Lejeune Foundation (R.J.R.), Research Support Funds Grant from IUPUI (R.J.R), and the NIH Bridges to the Baccalaureate in Central Indiana Grant 5R25GM083848 (J.T. and R.J.R.).
Abbreviations
- ANOVA
analysis of variance
- BFR
bone formation rate
- BMC
bone mineral content
- BMD
bone mineral density
- BV/TV
bone volume to tissue volume fraction
- DS
Down syndrome
- DYRK1A
dual specificity tyrosine-regulated kinase 1A
- EC
epicatechin
- ECG
epicatechin gallate
- EGC
epigallocatechin
- EGCG
Epigallocatechin-3-gallate
- GCG
gallocatechin
- MAR
mineral apposition rate
- LC/MS
liquid chromatography/mass spectrometry
Footnotes
Author contributions
I.A., J.T., T.M.G., K.J.D. and R.J.R conceived and designed the experiments, performed the experiments and collected the data. I.A., J.T., T.M.G., A.G.B., M.A.H., K.J.D., J.M.W. and R.J.R analyzed and interpreted the data. I.A., J.T., T.M.G., A.G.B., K.J.D., J.M.W. and R.J.R wrote the manuscript. R.J.R., K.J.D. and J.M.W. supervised the study. The authors are grateful to G. Chism for a critical reading of the manuscript.
7. Conflict of interest statement
The authors declare no competing financial interests.
5. References
- [1].Parker SE, Mai CT, Canfield MA, Rickard R, et al. Updated National Birth Prevalence estimates for selected birth defects in the United States, 2004-2006. Birth Defects Res A Clin Mol Teratol. 2010;88:1008–1016. doi: 10.1002/bdra.20735. [DOI] [PubMed] [Google Scholar]
- [2].Epstein C. Down syndrome (trisomy 21). The metabolic and molecular bases of inherited disease. McGraw Hill; New York: 2001. [Google Scholar]
- [3].Baptista F, Varela A, Sardinha LB. Bone mineral mass in males and females with and without Down syndrome. Osteoporos Int. 2005;16:380–388. doi: 10.1007/s00198-004-1687-1. [DOI] [PubMed] [Google Scholar]
- [4].Barnhart RC, Connolly B. Aging and Down syndrome: implications for physical therapy. Phys Ther. 2007;87:1399–1406. doi: 10.2522/ptj.20060334. [DOI] [PubMed] [Google Scholar]
- [5].Hawli Y, Nasrallah M, El-Hajj Fuleihan G. Endocrine and musculoskeletal abnormalities in patients with Down syndrome. Nat Rev Endocrinol. 2009;5:327–334. doi: 10.1038/nrendo.2009.80. [DOI] [PubMed] [Google Scholar]
- [6].Center J, Beange H, McElduff A. People with mental retardation have an increased prevalence of osteoporosis: a population study. American journal of mental retardation : AJMR. 1998;103:19–28. doi: 10.1352/0895-8017(1998)103<0019:PWMRHA>2.0.CO;2. [DOI] [PubMed] [Google Scholar]
- [7].Baird PA, Sadovnick AD. Life tables for Down syndrome. Hum Genet. 1989;82:291–292. doi: 10.1007/BF00291175. [DOI] [PubMed] [Google Scholar]
- [8].Bittles AH, Glasson EJ. Clinical, social, and ethical implications of changing life expectancy in Down syndrome. Dev Med Child Neurol. 2004;46:282–286. doi: 10.1017/s0012162204000441. [DOI] [PubMed] [Google Scholar]
- [9].Weijerman ME, de Winter JP. Clinical practice. The care of children with Down syndrome. Eur J Pediatr. 2010;169:1445–1452. doi: 10.1007/s00431-010-1253-0. [DOI] [PMC free article] [PubMed] [Google Scholar]
- [10].Reeves RH, Irving NG, Moran TH, Wohn A, et al. A mouse model for Down syndrome exhibits learning and behaviour deficits. Nat Genet. 1995;11:177–184. doi: 10.1038/ng1095-177. [DOI] [PubMed] [Google Scholar]
- [11].Sturgeon X, Gardiner KJ. Transcript catalogs of human chromosome 21 and orthologous chimpanzee and mouse regions. Mamm Genome. 2011;22:261–271. doi: 10.1007/s00335-011-9321-y. [DOI] [PubMed] [Google Scholar]
- [12].Blazek JD, Gaddy A, Meyer R, Roper RJ, Li J. Disruption of bone development and homeostasis by trisomy in Ts65Dn Down syndrome mice. Bone. 2011;48:275–280. doi: 10.1016/j.bone.2010.09.028. [DOI] [PMC free article] [PubMed] [Google Scholar]
- [13].Fowler TW, McKelvey KD, Akel NS, Vander Schilden J, et al. Low bone turnover and low BMD in Down syndrome: effect of intermittent PTH treatment. PLoS One. 2012;7:e42967. doi: 10.1371/journal.pone.0042967. [DOI] [PMC free article] [PubMed] [Google Scholar]
- [14].Arron JR, Winslow MM, Polleri A, Chang CP, et al. NFAT dysregulation by increased dosage of DSCR1 and DYRK1A on chromosome 21. Nature. 2006;441:595–600. doi: 10.1038/nature04678. [DOI] [PubMed] [Google Scholar]
- [15].Lee Y, Ha J, Kim HJ, Kim YS, et al. Negative feedback Inhibition of NFATc1 by DYRK1A regulates bone homeostasis. J Biol Chem. 2009;284:33343–33351. doi: 10.1074/jbc.M109.042234. [DOI] [PMC free article] [PubMed] [Google Scholar]
- [16].Blazek JD, Abeysekera I, Li J, Roper RJ. Rescue of the abnormal skeletal phenotype in Ts65Dn Down syndrome mice using genetic and therapeutic modulation of trisomic Dyrk1a. Hum Mol Genet. 2015;24:5687–5696. doi: 10.1093/hmg/ddv284. [DOI] [PubMed] [Google Scholar]
- [17].Bain J, McLauchlan H, Elliott M, Cohen P. The specificities of protein kinase inhibitors: an update. Biochem J. 2003;371:199–204. doi: 10.1042/BJ20021535. [DOI] [PMC free article] [PubMed] [Google Scholar]
- [18].Adayev T, Chen-Hwang MC, Murakami N, Wegiel J, Hwang YW. Kinetic properties of a MNB/DYRK1A mutant suitable for the elucidation of biochemical pathways. Biochemistry. 2006;45:12011–12019. doi: 10.1021/bi060632j. [DOI] [PubMed] [Google Scholar]
- [19].Hamdi Kara I, Aydin S, Gemalmaz A, Akturk Z, et al. Habitual tea drinking and bone mineral density in postmenopausal Turkish women: investigation of prevalence of postmenopausal osteoporosis in Turkey (IPPOT Study) Int J Vitam Nutr Res. 2007;77:389–397. doi: 10.1024/0300-9831.77.6.389. [DOI] [PubMed] [Google Scholar]
- [20].Hegarty VM, May HM, Khaw KT. Tea drinking and bone mineral density in older women. Am J Clin Nutr. 2000;71:1003–1007. doi: 10.1093/ajcn/71.4.1003. [DOI] [PubMed] [Google Scholar]
- [21].Muraki S, Yamamoto S, Ishibashi H, Oka H, et al. Diet and lifestyle associated with increased bone mineral density: cross-sectional study of Japanese elderly women at an osteoporosis outpatient clinic. J Orthop Sci. 2007;12:317–320. doi: 10.1007/s00776-007-1143-0. [DOI] [PubMed] [Google Scholar]
- [22].Wu CH, Yang YC, Yao WJ, Lu FH, et al. Epidemiological evidence of increased bone mineral density in habitual tea drinkers. Arch Intern Med. 2002;162:1001–1006. doi: 10.1001/archinte.162.9.1001. [DOI] [PubMed] [Google Scholar]
- [23].Chen Z, Pettinger MB, Ritenbaugh C, LaCroix AZ, et al. Habitual tea consumption and risk of osteoporosis: a prospective study in the women's health initiative observational cohort. Am J Epidemiol. 2003;158:772–781. doi: 10.1093/aje/kwg214. [DOI] [PubMed] [Google Scholar]
- [24].Devine A, Hodgson JM, Dick IM, Prince RL. Tea drinking is associated with benefits on bone density in older women. Am J Clin Nutr. 2007;86:1243–1247. doi: 10.1093/ajcn/86.4.1243. [DOI] [PubMed] [Google Scholar]
- [25].Hoover PA, Webber CE, Beaumont LF, Blake JM. Postmenopausal bone mineral density: relationship to calcium intake, calcium absorption, residual estrogen, body composition, and physical activity. Can J Physiol Pharmacol. 1996;74:911–917. [PubMed] [Google Scholar]
- [26].Guedj F, Sebrie C, Rivals I, Ledru A, et al. Green tea polyphenols rescue of brain defects induced by overexpression of DYRK1A. PLoS One. 2009;4:e4606. doi: 10.1371/journal.pone.0004606. [DOI] [PMC free article] [PubMed] [Google Scholar]
- [27].Chu KO, Wang CC, Chu CY, Choy KW, et al. Uptake and distribution of catechins in fetal organs following in utero exposure in rats. Human reproduction. 2007;22:280–287. doi: 10.1093/humrep/del353. [DOI] [PubMed] [Google Scholar]
- [28].Isbrucker RA, Edwards JA, Wolz E, Davidovich A, Bausch J. Safety studies on epigallocatechin gallate (EGCG) preparations. Part 3: teratogenicity and reproductive toxicity studies in rats. Food Chem Toxicol. 2006;44:651–661. doi: 10.1016/j.fct.2005.11.002. [DOI] [PubMed] [Google Scholar]
- [29].Shen CL, Cao JJ, Dagda RY, Tenner TE, Jr., et al. Supplementation with green tea polyphenols improves bone microstructure and quality in aged, orchidectomized rats. Calcif Tissue Int. 2011;88:455–463. doi: 10.1007/s00223-011-9477-1. [DOI] [PubMed] [Google Scholar]
- [30].Shen CL, Yeh JK, Stoecker BJ, Chyu MC, Wang JS. Green tea polyphenols mitigate deterioration of bone microarchitecture in middle-aged female rats. Bone. 2009;44:684–690. doi: 10.1016/j.bone.2008.11.018. [DOI] [PubMed] [Google Scholar]
- [31].Iwaniec UT, Turner RT, Koo SI, Kaur R, et al. Consumption of green tea extract results in osteopenia in growing male mice. J Nutr. 2009;139:1914–1919. doi: 10.3945/jn.109.107201. [DOI] [PMC free article] [PubMed] [Google Scholar]
- [32].Lee SH, Kim BJ, Choi HJ, Cho SW, et al. (−)-Epigallocathechin-3-gallate, an AMPK activator, decreases ovariectomy-induced bone loss by suppression of bone resorption. Calcif Tissue Int. 2012;90:404–410. doi: 10.1007/s00223-012-9584-7. [DOI] [PubMed] [Google Scholar]
- [33].Pons-Espinal M, Martinez de Lagran M, Dierssen M. Environmental enrichment rescues DYRK1A activity and hippocampal adult neurogenesis in TgDyrk1A. Neurobiol Dis. 2013;60C:18–31. doi: 10.1016/j.nbd.2013.08.008. [DOI] [PubMed] [Google Scholar]
- [34].de la Torre R, Dierssen M. Therapeutic approaches in the improvement of cognitive performance in Down syndrome: past, present, and future. Prog Brain Res. 2012;197:1–14. doi: 10.1016/B978-0-444-54299-1.00001-7. [DOI] [PubMed] [Google Scholar]
- [35].De la Torre R, De Sola S, Pons M, Duchon A, et al. Epigallocatechin-3-gallate, a DYRK1A inhibitor, rescues cognitive deficits in Down syndrome mouse models and in humans. Mol Nutr Food Res. 2014;58:278–288. doi: 10.1002/mnfr.201300325. [DOI] [PubMed] [Google Scholar]
- [36].Reinholdt LG, Ding Y, Gilbert GJ, Czechanski A, et al. Molecular characterization of the translocation breakpoints in the Down syndrome mouse model Ts65Dn. Mamm Genome. 2011;22:685–691. doi: 10.1007/s00335-011-9357-z. [DOI] [PMC free article] [PubMed] [Google Scholar]
- [37].Ferruzzi MG, Peters CM, Green RJ, Janle EM. Formulation with ascorbic acid and sucrose modulates catechin bioavailability from green tea. Food research international. 2010;43:95–102. doi: 10.1016/j.foodres.2009.08.016. [DOI] [PMC free article] [PubMed] [Google Scholar]
- [38].Souchet B, Guedj F, Penke-Verdier Z, Daubigney F, et al. Pharmacological correction of excitation/inhibition imbalance in Down syndrome mouse models. Frontiers in behavioral neuroscience. 2015;9:267. doi: 10.3389/fnbeh.2015.00267. [DOI] [PMC free article] [PubMed] [Google Scholar]
- [39].Khokhar S, Venema D, Hollman PC, Dekker M, Jongen W. A RP-HPLC method for the determination of tea catechins. Cancer letters. 1997;114:171–172. doi: 10.1016/s0304-3835(97)04653-3. [DOI] [PubMed] [Google Scholar]
Associated Data
This section collects any data citations, data availability statements, or supplementary materials included in this article.