Abstract
The oxidation of glucagon, which is one of the key hormones in glucose homeostasis, was studied at electrodes modified with carbon nanotubes (CNT) that were dispersed in a polysaccharide adhesive chitosan (CHIT). Such electrodes displayed improved resistance to fouling, which allowed for the investigation of both the electrolysis/mass spectrometry and electroanalysis of glucagon. The off-line electrospray ionization and tandem mass spectrometric analyses showed that the -4 Da mass change to glucagon upon electrolysis at CNT was due to the electrooxidation of its tryptophan (W25) and dityrosine (Y10, Y13) residues. The methionine residue of glucagon did not contribute to its oxidation. The amperometric determination of glucagon yielded the limit of detection equal to ~20 nM (E = 0.800 V, pH 7.40, S/N = 3), sensitivity of 0.46 A M−1 cm−2, linear dynamic range up to 2.0 μM (R2 = 0.998), response time <5 s, and good signal stability. Free tryptophan and tyrosine yielded comparable analytical figures of merit. The direct amperometric determination of unlabeled glucagon at CHIT-CNT electrodes is the first example of a rapid alternative to the complex analytical assays of this peptide.
Graphical abstract
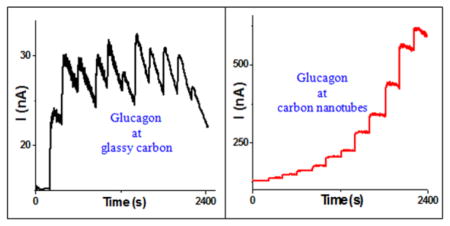
Direct amperometric determination of unlabeled glucagon is a rapid alternative to the complex analytical assays of this peptide hormone.
1. Introduction
Glucagon is a peptide hormone (MW, 3483 Da), which is secreted from pancreatic αcells in response to a low level of blood glucose. It helps in the maintenance of glucose homeostasis by raising the concentration of glucose in the bloodstream, which is opposite to the glucose-lowering effect of insulin. Glucagon is a therapeutic agent that counteracts hypoglycemia, a serious complication of insulin-treated diabetes. The abnormal regulation of glucagon may play a role in type 2 diabetes. It has been recently proposed that “glucagon excess, rather than insulin deficiency, is the sine qua non of diabetes”.1,2 For these reasons, there is a growing interest in the development of rapid analytical methods for the determination of glucagon. Typically, glucagon has been determined by complex indirect assays that require its labeling with optical3,4 or radioactive tags.5,6 Electrochemical methods are potentially useful for direct determination of glucagon; however, little is known about the electrochemistry of this peptide.
In this paper, we report the first example of the direct amperometric determination of unlabeled glucagon at electrodes modified with carbon nanotubes (CNT) and polysaccharide chitosan (CHIT). Such electrodes are promising alternative to other carbon- and metal-based electrodes to study the electrolysis of solvent-exposed amino acids of peptides and proteins for structural studies with mass spectrometry.7–9 Here, we provide insight into the electrochemistry of glucagon by conducting bulk electrolysis of its solutions at CHIT-CNT film electrodes in conjunction with off-line electrospray ionization mass spectrometry (ESI-MS) and higher-energy collision dissociation.
2. Experimental section
2.1 Reagents and glucagon solutions
Multi-walled carbon nanotubes (CNT, synthesized via chemical vapor deposition, ~95 % nominal purity) were purchased from Nanolab (Brighton, MA). They had a diameter of 15 ± 5 nm and length of 1–5 μm. Chitosan (CHIT, MW ~1 × 10⁶ Da; ~80 % deacetylation), glucagon, ammonium formate, and dimethylformamide were purchased from Sigma-Aldrich. Other chemicals, NaH2PO4·H2O, Na2HPO4, HCl, and NaOH were from Fisher. The stock solution of glucagon (0.45 mM) was prepared by dissolving powdered glucagon in 0.020 M HCl to take the advantage of its better solubility in acidic than neutral solutions. Glucagon solutions were prepared by diluting aliquots of the glucagon stock solutions with a background electrolyte solution (sodium phosphate or ammonium formate buffer). All solutions were prepared using 18-MΩ-cm deionized water that was purified with a Synergy Millipore cartridge system.
2.2 Solutions of chitosan and suspensions of carbon nanotubes
A 0.10 wt. % CHIT stock solution was prepared by dissolving chitosan flakes in a hot (80-90 °C) aqueous solution of 0.10 M HCl.10 The solution was cooled to room temperature and its pH was adjusted to 3.5 using NaOH solutions. The chitosan solutions were filtered using a 0.45-μm Millex-HA syringe filter unit (Millipore) and stored in a refrigerator (4 °C) until use. The colloidal suspensions of carbon nanotubes in chitosan solutions were prepared by a 15 min bath sonication.
2.3 Film electrodes
The preparation of film electrodes was optimized in order to maximize the signal-to-noise ratio for the oxidation of glucagon and minimize the extent of electrode fouling during glucagon oxidation. The CHIT-CNT film electrodes were formed by casting 20 μL of 0.10 wt. % CHIT solution, which contained CNT (1.0 mg CNT mL−1), on the surface of a stationary glassy carbon (GC) electrode. After evaporation of water for 2 h at room temperature, a robust composite film was formed that contained 20 μg CNT and 20 μg CHIT. The films were circular with ~5-mm diameter (~0.20 cm2), which completely covered the 3.0-mm diameter (0.071 cm2) GC disk that was embedded in an insulating body of electrode. The control experiments showed that voltammetric peaks of a model system Fe(CN)63-/4- were ~3 times larger at a CHIT-CNT film than at a bare glassy carbon electrode, which was close to the ratio of their geometric areas (0.20/0.071). This implied that, on the experimental time scale, the diffusion layers at individual CNT overlapped resulting in a global diffusion layer covering the entire geometric area of CHIT-CNT electrode.
The CNT-films without CHIT were formed by casting 10.0 μL-aliquots of CNT suspension (2 mg mL−1) in dimethylformamide on the surface of stationary GC electrodes and drying for 2 h at room temperature. The large CHIT-CNT film rod electrodes (0.60 cm−2) for the bulk electrolysis of glucagon were prepared by dipping a 5.0-mm diameter glassy carbon rod into a 0.10 wt. % CHIT solution that contained 1.0 mg CNT mL−1 and drying it for 2 h at room temperature.
The CNT were used as received because their purification had no effect on the electrooxidation of glucagon. This finding is consistent with our previous studies on the electrooxidation of hormone insulin at CNT,11 which showed that the removal of metal catalysts and amorphous carbon from CNT by heating in concentrated acids and extracting with organic solvents did not impact the voltammograms of insulin.
2.4 Electrochemical measurements
A CHI 832B workstation (CH Instruments, Inc.) was used to collect the voltammetric and amperometric data. The hydrodynamic voltammograms were recorded by applying a series of constant potential values to a stationary working electrode and measuring a current due to the electrooxidation of glucagon in a stirred solution. Experiments were performed at room temperature (20 ± 1 °C) in a conventional three-electrode system with 3.0-mm-diameter glassy carbon (GC) disk working electrode (Bioanalytical Systems, Inc.), a platinum wire as the auxiliary electrode, and a Ag/AgCl/3MNaCl (BAS) reference electrode. Prior to use, the glassy carbon electrodes were wet polished on an Alpha A polishing cloth (Mark V Lab) with successively smaller particles (0.3 and 0.05 μm diameter) of alumina. The slurry that accumulated on the electrode surface was removed by a bath ultrasonication for 30 s in methanol and deionized water.
Phosphate buffer solution (0.050 M, pH 7.40) served as a background electrolyte for the cyclic voltammetric and amperometric experiments. Ammonium formate buffer solution (0.050 M, pH 8.40) was used as a background electrolyte for the bulk electrolysis of glucagon. The experiments were repeated at least three times and the means of measurements are presented with the standard deviations or relative standard deviations.
2.5 Electrolysis of glucagon solutions
The glucagon solutions for electrolysis were prepared in ammonium formate buffer (0.050 M, pH 8.40) to improve the compatibility with the subsequent ESI mass spectrometry experiments. For bulk electrolysis, 10.0 mL of 10.0 μM solution of glucagon in the ammonium formate buffer was stirred in a plastic beaker and electrolyzed at a constant potential of 0.700 V using a glassy carbon rod electrode coated with the CHIT-CNT film. Glass beakers were not used to avoid sodium ions, which have a negative effect on ESI mass spectral data. The electrolysis lasted ~4-5 h until the current dropped to ~1 % of its initial value after which a fresh CHIT-CNT film rod electrode was used to continue the electrolysis of the same glucagon solution. Four CHIT-CNT rod electrodes were used in order to electrolyze one glucagon solution. After each electrolysis, a ~200-μL aliquot of glucagon solution was withdrawn and stored in a freezer at −80 °C before the ESI mass spectrometric analysis. The aliquots of the intact 10.0 μM solution of glucagon were stored at either room temperature 21 °C or −80 °C and used in the control experiments.
2.6 Mass spectrometric analyses of glucagon solutions
Before the mass spectrometric analysis, 10.0 μM glucagon solutions were diluted 100-fold to 100 nM with an aqueous solution of methanol (50 vol. %) containing 0.10 vol. % acetic acid. The data were collected on an LTQ-Orbitrap Elite mass spectrometer equipped with a nanospray source (Thermo Scientific) and operated in the positive ionization mode. The 100 nM glucagon in a 50/49.9/0.1 % methanol/water/acetic acid solution was introduced into the nanospray source via syringe pump at a flow rate of 0.50 μL min−1. The instrument parameters were maintained at optimal values for each experiment unless otherwise indicated: source voltage, 2.3 kV; vaporizer temperature, 180 °C; capillary temperature, 200 °C. The Orbitrap was set to 60K resolution for all data collection. The calibration was performed externally in the range 250 ≤ m/z≤ 2000 using Pierce® LTQ Velos ESI Positive Ion Calibration Solution (Thermo Scientific). Mass spectra were an average of 5 minutes of scans with an automatic gain control target value of 1 × 10⁶ ions or maximum injection time of 100 ms. The data were processed using Qual Browser Xcalibur 2.2 (Thermo Fisher Scientific Inc.).
To identify the oxidized amino acid residues, peaks corresponding to the +4 charge state of unmodified glucagon (m/z 871.7 from the original glucagon solution) and the oxidized glucagon (m/z 870.7 from the electrolyzed solution) were isolated and fragmented by higher-energy collision dissociation (HCD) at 20% collision energy with a 100 ms activation time. The mMass 5.5.0 software12 was used to compare tandem mass spectra and to identify/assign fragments.
3. Results and discussion
3.1 Voltammetry of glucagon at CHIT-CNT film electrodes
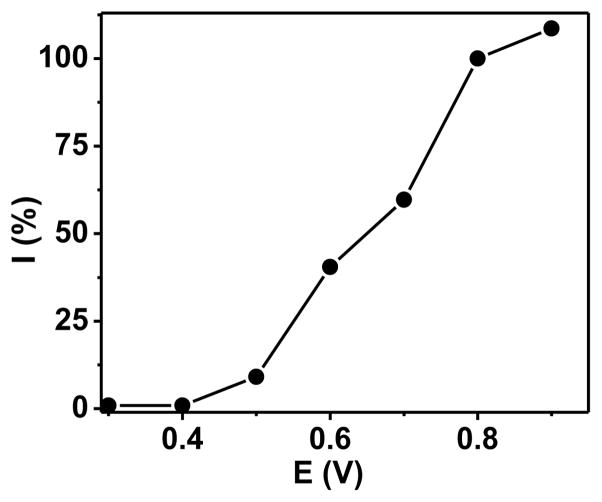
The voltammetric characteristic of 1.0 μM glucagon solution in a pH 7.40 phosphate buffer was investigated by using hydrodynamic voltammetry. The use of such low glucagon concentration minimized the deactivation of electrode surface and improved the reproducibility of data, e.g. the relative standard deviation of glucagon current was below ±10%. electrode. The y-axis was normalized by setting the current at 0.80 V as 100%. Background electrolyte, pH 7.40 phosphate buffer (0.050 M) solution.
The hydrodynamic voltammogram in Figure 1 demonstrates the presence of the current due to the oxidation of glucagon at positive potentials (>0.40 V). To attempt to further increase the current and lower the potential, the CNT were boiled in deionized water or sonicated in a concentrated nitric acid solution before their use in the CHIT-CNT film electrode. Such treatment of CNT has previously been shown to activate them for the oxidation of other analytes;13 however, it had no effect on the hydrodynamic voltammogram of glucagon.
Figure 1.
Hydrodynamic voltammogram of 1.0 μM glucagon at a CHIT-CNT film electrode. The y-axis was normalized by setting the current at 0.80 V as 100%. Background electrolyte, pH 7.40 phosphate buffer (0.050 M) solution.
3.2 Voltammetry of free tryptophan, tyrosine, and methionine at CHIT-CNT film electrodes
The voltammetric activity of glucagon can be ascribed to the presence of redox active amino acid residues in its structure including tyrosines (Y10, Y13), tryptophan (W25), and methionine (M27) (Figure 2). In order to test this hypothesis, the voltammetric characteristic of the free three amino acids was determined at the same electrode (Figure 3). In contrast to methionine that yielded no oxidation peaks, tryptophan and tyrosine yielded anodic current peaks at 0.68 and 0.65 V, respectively. The peaks were symmetrical with a current eventually falling to the base line, which indicated the electrode process from the adsorbed state. The lack of the current peak for methionine is consistent with prior reports, which showed that the methionine oxidation occurs at much more positive potentials (>1 V)14 where carbon electrodes exhibit a limited stability.
Figure 2.
Primary structure of glucagon chain.
Figure 3.
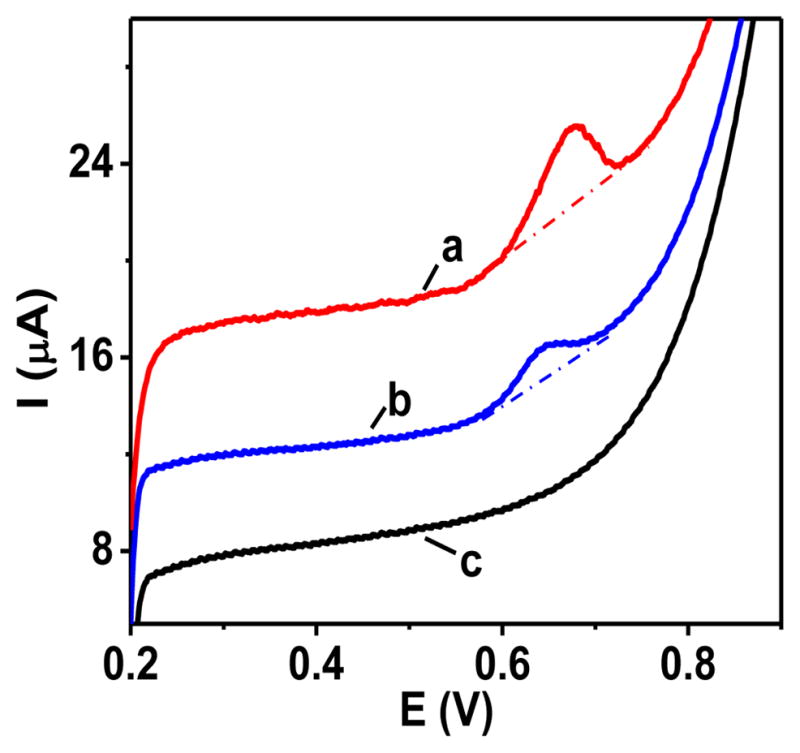
Linear scan voltammograms of (a) tryptophan, (b) tyrosine and (c) methionine (each 50 μM) at a CHIT-CNT film electrode. Background electrolyte, pH 7.40 phosphate buffer (0.050 M) solution. Scan rate, 50 mV s−1. Traces are shifted along y-axis for clarity.
Based on the above and literature reports on the redox activity of tryptophan and tyrosine,15 we hypothesize that the oxidation of glucagon at CNT involves the 2H+, 2e− oxidation of its tryptophan (W25) residue and 1H+,1e− oxidations of its two tyrosine (Y10, Y13) residues (Figure 2). Furthermore, we postulate that the oxidation of glucagon at the methionine (M27) residue is not taking place. In order to test this hypothesis, the mass spectrometric analyses of electrolyzed glucagon solutions were performed.
3.3 Mass spectrometry of electrolyzed glucagon solutions
The bulk electrolysis of large peptides has been rarely reported,16 mostly due to problems associated with the fouling of electrode surface during such electrolytic process. In this context, the increased resistance of CHIT-CNT film electrodes to fouling (vide infra) was noticeable because it allowed carrying out the meaningful bulk electrolysis of glucagon solutions. To maximize the electrolysis of 10.0 mL of 10.0 μM glucagon solution, four CHIT-CNT film electrodes (0.60 cm−2 each) were used.
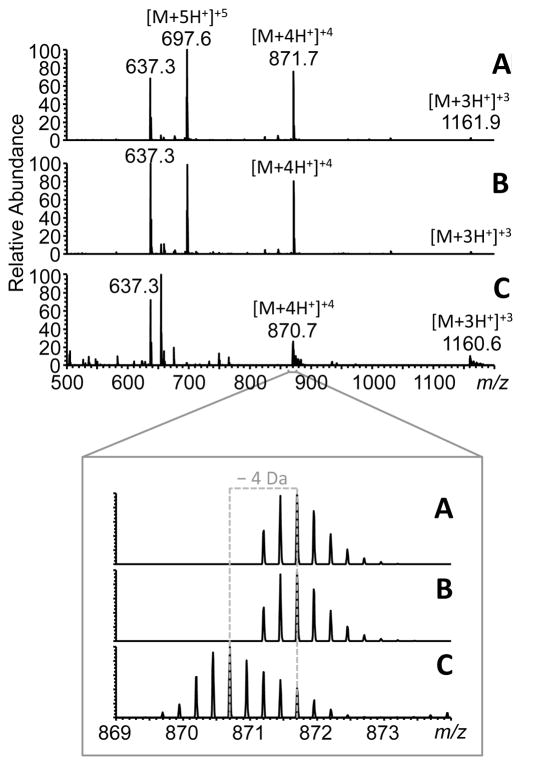
Figure 4 shows the survey ESI mass spectra of glucagon solutions in the m/z range 500-1200. The intact glucagon solutions that were stored either in a freezer (Figure 4A) or at room temperature (Figure 4B) for 3 days displayed a clear charge state distribution from [M+3H+]+3 (m/z 1161.9) through [M+4H+]+4 (m/z 871.7) to [M+5H+]+5 (m/z 697.6), with the latter being the most abundant. The spectra showed no noticeable differences indicating no change to glucagon during a short-term storage at room temperature.
Figure 4.
ESI mass spectra of 100 nM glucagon solution (A) before electrolysis stored in a freezer, (B) before electrolysis stored at room temperature for the duration of the electrolysis experiment, and (C) after electrolysis of the same solution with 4 successive CHIT-CNT film rod electrodes. The various charge states detected are indicated. The peak at m/z 637.3 is a common contaminant (ubiquitous polyether) found in the solvent. Inset shows the zoomed region from 869≤m/z≤874 for the +4 charge. The evolution of the oxidized species at 1 Th ( 4 Da) is indicated based on the most abundant peaks in the isotopic distributions.
Figure 4C shows the ESI mass spectrum of the glucagon solution that was electrolyzed with four CHE-CNT film rod electrodes. The electrolysis practically eliminated the [M+5H+]+5 peak at m/z 697.6, slightly increased the relative intensity of the [M+3H+]+3 at m/z 1161.9, and left the [M+4H+]+4 peak at m/z 870.7 as the most abundant one in the mass spectrum (the peak at m/z 637.3 is a contaminant from the solvent).
The zoomed-in region of the mass spectra for the [M+4H+]+4 species (Figure 4, inset m/z 869-874) shows that the second isotopic peaks at m/z 871.7 and 870.7 are the most abundant in the isotopic distributions of the intact and electrolyzed glucagon, respectively. Based on this, there is predominantly a loss of 4 Da from glucagon upon its electrolysis. This is consistent with the oxidation of tryptophan (W25) and two tyrosine (Y10, Y13) residues of glucagon. The tryptophan oxidation likely involves the double bond between the α and β carbons of W25;17 while the tyrosine oxidation results in the formation of o,o’-dityrosine crosslink between Y10 and Y13,18 both combined processes resulting in a total loss of 4 hydrogen atoms from the oxidized glucagon.
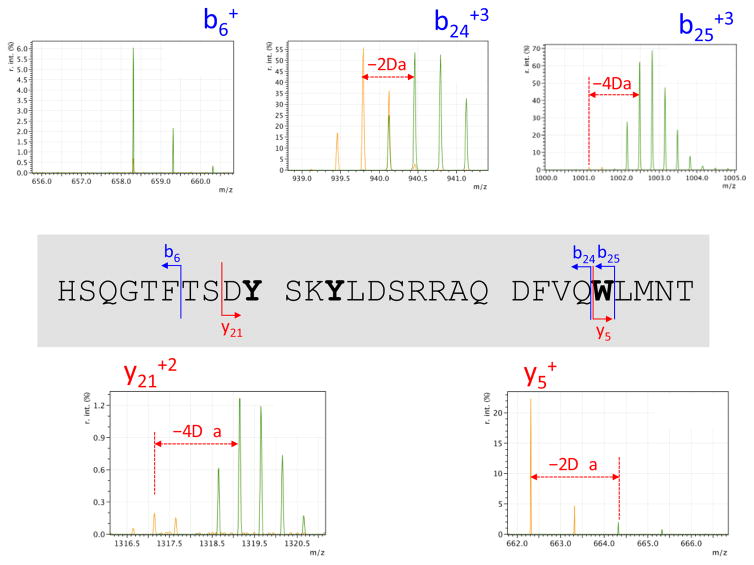
The Y-10-Y13 dityrosine crosslink and the oxidation of W25 were confirmed by higher-energy collision dissociation (HCD) tandem mass spectrometry. The entire isotopic clusters at m/z 871.7 and 870.7 corresponding to the unmodified and 4H-oxidized glucagon were isolated and fragmented. The resultant fragments were compared to identify the likely oxidized residues. Figure 5 shows a number of important fragments along with their positions in the glucagon sequence. The mass spectra show a 4H loss for the b25+3 fragment ion (m/z 1002.1) while only a 2H+ loss for the b24+3 fragment ion (m/z 940.1) upon glucagon oxidation. This difference proves that W25 was one of the sites of 2H-oxidation. This was also evident from the y5+ ion (m/z 664.3), which is complementary to b24+3 and contains the tryptophan residue W25.
Figure 5.
Overlaid tandem mass spectra showing the b6+, b24+3, b25+3, y5+, and y21+2 fragment ions from higher-energy collision dissociation (HCD) for the peaks at m/z 871.7 and 870.7 corresponding to the unmodified (green) and 4H-oxidized (orange) glucagon, respectively. These were used to confirm that the 4 Da mass change to glucagon upon electrolysis was due to the Y-10-Y13 dityrosine crosslink and the oxidation of W25. The positions of these fragment ions are indicated in the glucagon sequence where the oxidized tyrosine (Y) and tryptophan (W) residues are shown in bold type.
Figure 5 shows that the b6+ fragment ion (m/z 658.3) displays no mass difference between glucagon before and after electrolysis. This was also seen for the b9+ fragment ion (m/z 961.4, data not shown), which indicates that no amino acid residue is 2H-oxidized before Y10. The y21+2 fragment ion (m/z 1318.6) confirms that both 2H-oxidations were present after the first 8 amino acid residues in the sequence. The fact that b24+3 only shows a 2H loss after oxidation (also confirmed by b21+3 and b23+3, data not shown) suggests that the second oxidation site must be between the aspartate residues D9 and D21. The more extensive MS/MS analysis of the oxidative electrolysis of glucagon is planned; however, based on the oxidation potentials and the parameters used in the current experimental setup, the only possibility for a 2H-oxidation was the formation of o,o’-dityrosine crosslink between Y10 and Y13. Other glucagon species (e.g., +17 Da oxidation event) detected by mass spectrometry likely result from degradation and chemical oxidation of the peptide. Degradation and chemical oxidation products of glucagon under basic19 and acidic20 conditions have been well characterized in the past. To the best of our knowledge, there have been no published reports cataloging the electrochemical oxidation and degradation products of glucagon.
3.4 Amperometric determination of glucagon at CHIT-CNT film electrodes
The electrochemical quantification of glucagon was performed at a constant potential in a stirred pH 7.40 phosphate buffer solution that was spiked with the aliquots of glucagon stock solution. Under such conditions, a well-defined current step due to the electrooxidation of glucagon at an electrode surface should be observed after each spike. In the control experiment, a bare glassy carbon disk electrode without a CHIT-CNT film was used.
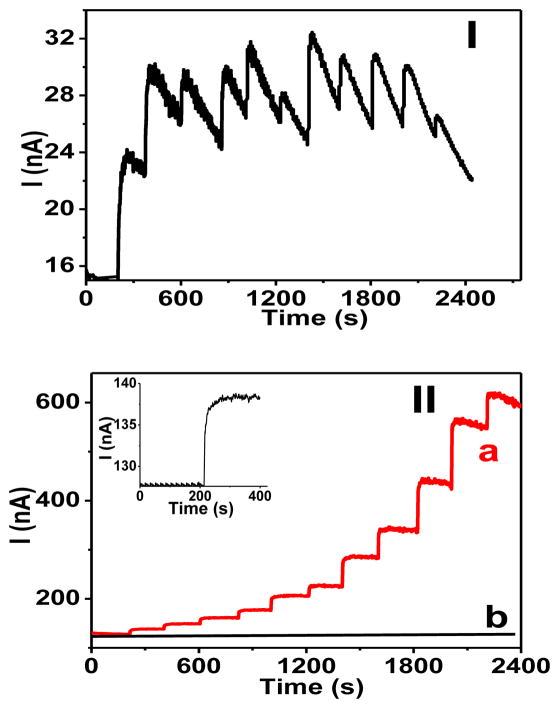
Figure 6 (panel I) shows that the current steps at a bare glassy carbon electrode were ill defined and analytically useless because of the lack of current stability. Apparently, this degraded signal was a reflection of a rapid fouling of electrode surface in the presence of glucagon in a solution. One can argue that the active sites on the electrode surface were blocked by the glucagon or its product sorption; however, the exact mechanism of this phenomenon is not known at present.
Figure 6.
Amperometric response (E = 0.800 V) of (I) a bare glassy carbon electrode, and (II) a CHIT-CNT film electrode to the additions of glucagon aliquots in 0.010 M HCl (0.10, 0.21, 0.31, 0.52, 0.83, 1.03, 2.06, 3.09, 5.16, 8.26, and 10.3 μM). Trace (b) in part I represents a control experiment where the relevant aliquots of 0.010 M HCl solution were added to a solution. Inset: current-time trace illustrating a response of the CHIT-CNT film electrode to 100 nM glucagon. Background electrolyte, a stirred pH 7.40 phosphate buffer (0.050 M) solution.
In contrast, the CHIT-CNT film electrode yielded stable current steps in response to spiking a solution with aliquots of glucagon (Figure 6, panel II). At 0.800 V, the calibration plots for glucagon were linear up to 2.0 μM and had slopes (sensitivity) equal to 0.46 ± 0.03 A M−1 cm−2 (R2 = 0.998). The inset in Figure 6 (panel II) shows a current step in response to the addition of aliquot that generated the concentration of 100 nM glucagon in a solution. The analysis of this current step (S/N = 3) yielded the limit of detection ~20 nM.
The detection limit of 20 nM has been sufficient in the past for the detection of exocytosis of insulin at single pancreatic β-cells using ruthenium-based electrodes.21,22 This suggests that the CHIT-CNT electrodes may be suitable for recording the exocytosis of glucagon at single pancreatic α-cells. In this context, the advantage of CNT-based electrodes is that they are significantly more stable than ruthenium-based electrodes, in particular, at neutral pH.22–24
At a lower potential of 0.700 V, the limit of detection was higher (~35 nM, (S/N = 3) and the sensitivity was lower (0.35 A M−1 cm−2). At even lower potential of 0.550 V, the CHIT-CNT film electrode displayed a prohibitively slow response time (>100s) to the addition of glucagon aliquots to a solution.
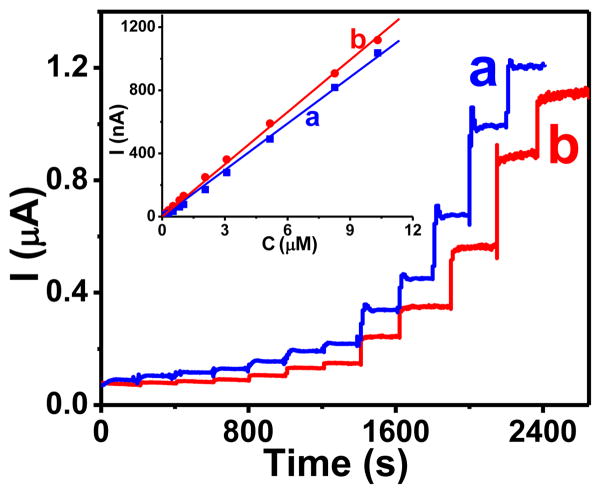
The analogous determination of free tryptophan and tyrosine at CHIT-CNT film electrodes (0.800 V) yielded also well-defined and sharp current steps (Figure 7). Their analysis yielded the limit of detection of 30 and 20 nM, and the sensitivity of 0.50 and 0.56 A M−1 cm−2 for the tryptophan and tyrosine, respectively. These analytical figures of merit compare favorably with prior reports relevant to the two amino acids.25 In contrast to glucagon, the linear range for the determination of free tryptophan and tyrosine was wider and extended to at least 10 μM (R2 = 0.999).
Figure 7.
Amperometric response (E = 0.800 V) of CHIT-CNT film electrode to the additions of (a) tryptophan and (b) tyrosine aliquots in pH 7.40 phosphate buffer solution (0.10, 0.21, 0.31, 0.52, 0.83, 1.03, 2.06, 3.09, 5.16, 8.26, 10.3 μM are they exactly the same as those for glucagon). Inset: calibration plots for (a) tryptophan and (b) tyrosine. Background electrolyte, a stirred pH 7.40 phosphate buffer (0.050 M) solution.
Perhaps the most useful feature of CHIT-CNT film electrodes as amperometric sensors for glucagon was their operational stability. Their current in the presence of low glucagon concentration (e.g. 100 nM) was constant (±10%) for hours. Even at higher glucagon concentrations, they resisted quick deactivation. Figure 8 (curve a) demonstrates the operational stability of a CHIT-CNT film electrode that was continuously polarized at 0.800 V while exposed to a stirred solution of 1.0 μM glucagon. After 50-min, the CHIT-CNT film electrode still retained ~65% of its initial response to glucagon, which is significant considering that peptides at higher concentrations are notorious for the rapid fouling of electrode surfaces. The CNT film electrode without the CHIT component deactivated faster and retained only ~45% of its initial response under the same experimental conditions (Figure 8, trace b). The bare glassy carbon electrode deactivated even faster and totally lost its glucagon signal after ~30 min (Figure 8, trace c).
Figure 8.
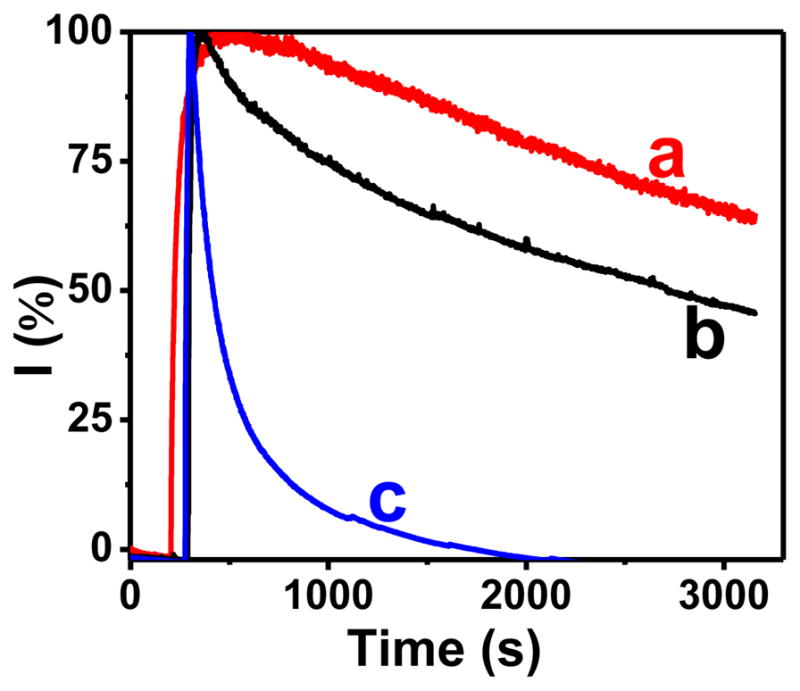
Amperometric trace (E = 0.800 V) recorded at (a) CHIT-CNT film, (b) CNT film, and (c) bare glassy carbon electrodes in stirred solutions of 1.0 μM glucagon. The CNT film electrodes were prepared by evaporating solvent from a CNT-dimethylformamide suspension. Background electrolyte, pH 7.40 phosphate buffer (0.050 M) solution.
The comparison of traces a and b in Figure 8 shows that the CHIT matrix improved the resistance of CNT to fouling during the oxidation of glucagon. One explanation is that the adsorption of CHIT on CNT slowed the electrode process, which, in turn, lowered the scope of surface fouling by electrolysis products. Indeed, the initial glucagon current in Figure 8 was ~20% lower at the CHIT-CNT than at a CNT film electrode.
The one aspect of the CHIT-CNT film electrode that needs improvement is its selectivity. We are currently designing coatings with the goal of decreasing the anodic overpotential of glucagon. However, even in the present form, the CHIT-CNT film electrode can be useful in certain situations such as a chromatographic glucagon detector because it works in mixed aqueous-organic solvents (e.g. water-acetonitrile), which are often used as mobile phases in a chromatographic analysis of peptides.
The response of five different CHIT-CNT film electrodes toward 0.50 μM glucagon was within ± 10 %, which illustrated good reproducibility of electrode preparation. The CHIT-CNT film electrodes had a shelf life of at least one month when stored in a refrigerator. Without a protective matrix of CHIT, the stored CNT electrodes (CNT-dimethylformamide) deactivated in hours because of the adsorption of impurities from air directly on the surface of CNT.
4. Conclusions
The present work fills a gap in the sensor field, which is the lack of direct detectors for peptide hormone glucagon. It provides both the new analytical method for glucagon and insight into the electrochemistry of this peptide. The method is based on a direct amperometric detection of glucagon at carbon nanotubes (CNT)-based electrodes. The electrochemistry of glucagon involves the oxidation of its tryptophan and tyrosine residues as indicated by the mass spectrometric analyses of glucagon solutions that were electrolyzed at CNT-based electrodes. The amperometric limit of detection for glucagon (20 nM) is comparable to that for the free molecules of tryptophan and tyrosine (30 and 20 nM, respectively). The CNT-based electrodes can serve as sensitive detectors for the direct chromatographic determination of glucagon, which otherwise has to be derivatized with sensitivity increasing labels. Such electrodes have a potential to be useful also for the analysis of other peptides and proteins that contain redox-active amino acid residues.
Acknowledgments
Research reported in this publication was supported by the National Institute on Minority Health and Health Disparities of the National Institutes of Health under Award Number G12MD007591 and R37 DK046960 (R.T.K.).
References
- 1.Unger RH. J Clin Invest. 2012;122:4. doi: 10.1172/JCI60016. [DOI] [PMC free article] [PubMed] [Google Scholar]
- 2.Gylfe E, Tengholm A. Diabetes Obes Metab. 2014;16:102. doi: 10.1111/dom.12345. [DOI] [PubMed] [Google Scholar]
- 3.Shackman JG, Reid KR, Dugan CE, Kennedy RT. Anal Bioanal Chem. 2012;402:2797. doi: 10.1007/s00216-012-5755-7. [DOI] [PMC free article] [PubMed] [Google Scholar]
- 4.German I, Kennedy RT. J Chromat B. 2000;742:353. doi: 10.1016/s0378-4347(00)00180-8. [DOI] [PubMed] [Google Scholar]
- 5.Salehi A, Vieira E, Gylfe E. Diabetes. 2006;55:2318. doi: 10.2337/db06-0080. [DOI] [PubMed] [Google Scholar]
- 6.Von Schenck H, Nilsson OR. Clin Chim Acta. 1981;109:183. doi: 10.1016/0009-8981(81)90333-8. [DOI] [PubMed] [Google Scholar]
- 7.Roeser J, Alting NFA, Permentier HP, Bruins AP, Bischoff R. Anal Chem. 2013;85:6626. doi: 10.1021/ac303795c. [DOI] [PubMed] [Google Scholar]
- 8.Jahn S, Karst U. J Chromatogr A. 2012;1259:16. doi: 10.1016/j.chroma.2012.05.066. [DOI] [PubMed] [Google Scholar]
- 9.McClintock C, Kertesz V, Hettich RL. Anal Chem. 2008;80:3304. doi: 10.1021/ac702493a. [DOI] [PubMed] [Google Scholar]
- 10.Zhang M, Karra S, Gorski W. Anal Chem. 2014;86:9330. doi: 10.1021/ac502687z. [DOI] [PubMed] [Google Scholar]
- 11.Zhang M, Mullens C, Gorski W. Anal Chem. 2005;77:6396. doi: 10.1021/ac0508752. [DOI] [PubMed] [Google Scholar]
- 12.Strohalm M, Kavan D, Novak P, Volny M, Havlicek V. Anal Chem. 2010;82:4648. doi: 10.1021/ac100818g. [DOI] [PubMed] [Google Scholar]
- 13.Wooten M, Gorski W. Anal Chem. 2010;82:1299. doi: 10.1021/ac902301b. [DOI] [PMC free article] [PubMed] [Google Scholar]
- 14.Brabec V, Mornstein V. Biophys Chem. 1980;12:159. doi: 10.1016/0301-4622(80)80048-2. [DOI] [PubMed] [Google Scholar]
- 15.Palecek E, Ostatna V. Electroanalysis. 2007;19:2383. [Google Scholar]
- 16.Permentier HP, Bruins AP. J Am Soc Mass Spectrom. 2004;15:1707. doi: 10.1016/j.jasms.2004.09.003. [DOI] [PubMed] [Google Scholar]
- 17.Domingues MRM, Domingues P, Reis A, Fonseca C, Amado FML, Ferrer-Correia AJV. J Am Soc Mass Spectrom. 2003;14:406. doi: 10.1016/S1044-0305(03)00127-2. [DOI] [PubMed] [Google Scholar]
- 18.Heinecke JW. Faseb J. 1999;13:1113. doi: 10.1096/fasebj.13.10.1113. [DOI] [PubMed] [Google Scholar]
- 19.Caputo N, Castle JR, Bergstrom CP, Carroll JM, Bakhtiani PA, Jackson MA, Roberts CT, Jr, David LL, Ward WK. Peptides. 2013;45:40. doi: 10.1016/j.peptides.2013.04.005. [DOI] [PMC free article] [PubMed] [Google Scholar]
- 20.Joshi AB, Russ E, Kirsch LE. Int J Pharm. 2000;203:115. doi: 10.1016/s0378-5173(00)00438-5. [DOI] [PubMed] [Google Scholar]
- 21.Gorski W, Aspinwall CA, Lakey JRT, Kennedy RT. J Electroanal Chem. 1997;425:191. [Google Scholar]
- 22.Huang L, Shen H, Atkinson MA, Kennedy RT. Proc Natl Acad Sci USA. 1995;92:9608. doi: 10.1073/pnas.92.21.9608. [DOI] [PMC free article] [PubMed] [Google Scholar]
- 23.Gorski W, Cox JA. J Electroanal Chem. 1995;389:123. [Google Scholar]
- 24.Cox JA, Alber KS, Tess ME, Cummings TE, Gorski W. J Electroanal Chem. 1995;396:485. [Google Scholar]
- 25.Wei M-Y, Guo L-H, Famouri P. Trends Anal Chem. 2012;39:130. A table of contents entry (Gorski et al.) [Google Scholar]


